Last year’s US (and global) broad money surge is expected, on the “monetarist” view, to be reflected in a significant inflation rise over 2021-22. US broad money* growth, however, has normalised recently: six-month expansion has retreated from 41% at an annualised rate in July to 4.3% in January. Stabilisation at the current pace would suggest an eventual return of low inflation.

A key driver of the broad money slowdown has been a narrowing of the federal budget deficit after its H1 2020 blowout. The six-month rolling shortfall declined from $2.42 trn to $1.06 trn between July and January. Monetary deficit financing – net lending to the federal government by the Fed, commercial banks and money funds – has fallen accordingly.

President Biden’s stimulus package will drive another deficit surge and a reasonable base case scenario is that this will be associated with a rebound in monetary financing and broad money growth, with unfavourable implications for medium-term inflation prospects.

This monetary scenario, however, is not guaranteed.

Monetary financing by the Fed will rise substantially as the recent pace of Treasury purchases is maintained and the Treasury runs down its deposit balance at the Fed to finance the stimulus package and comply with the 2019 Bipartisan Budget Act. This could, however, be offset by reduced purchases, or even sales, by commercial banks and money funds, reflecting Treasury plans to reduce bill supply and a constraint on banks’ balance sheet expansion from the supplementary leverage ratio (SLR), assuming that this is not relaxed. The recent rise in Treasury yields could attract buying from “real money” domestic investors and foreigners, implying an increase in non-monetary financing of the deficit.

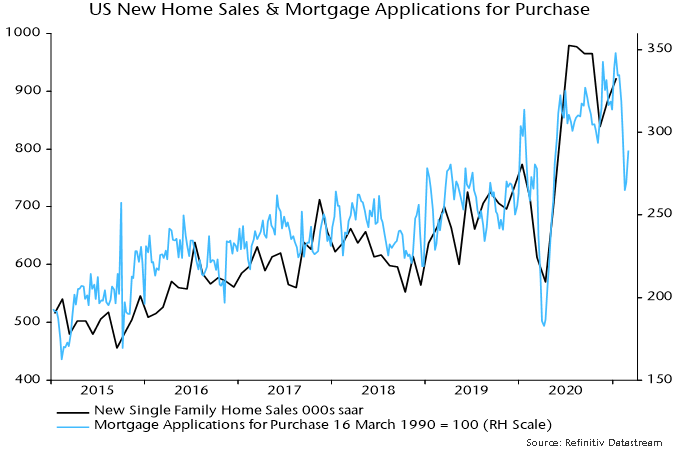
Higher yields could also dampen money growth via their impact on private sector credit demand. The jump in mortgage rates has already been reflected in a fall in mortgage applications for house purchase – chart 1. Growth of commercial banks’ lending book will continue to be dragged down by forgiveness of Payment Protection Program (PPP) loans: of the $521 bn of advances in 2020, only $169 bn had been forgiven as of 4 March.

Chart 1
The upshot is that broad money reacceleration is likely but not certain and there is no alternative to monitoring the incoming monetary data to judge whether another inflationary boost is in the pipeline.

It is, therefore, unfortunate that the Fed recently ended publication of weekly monetary data while pushing back the release of monthly figures to the fourth Tuesday of each month.

Timely monitoring of monetary trends, however, is still possible using alternative sources of weekly data for currency in circulation, commercial bank deposits and money funds. Chart 2 shows 26-week growth rates (not annualised) of broad money* and M2 up to the final week of Fed data (ending 1 February) along with growth of proxy measures calculated from the alternative sources. Broad money growth remains modest but has firmed since year-end ahead of the expected fiscal package boost. The extent of any further pick-up will be key for assessing medium-term inflation danger.

Chart 2
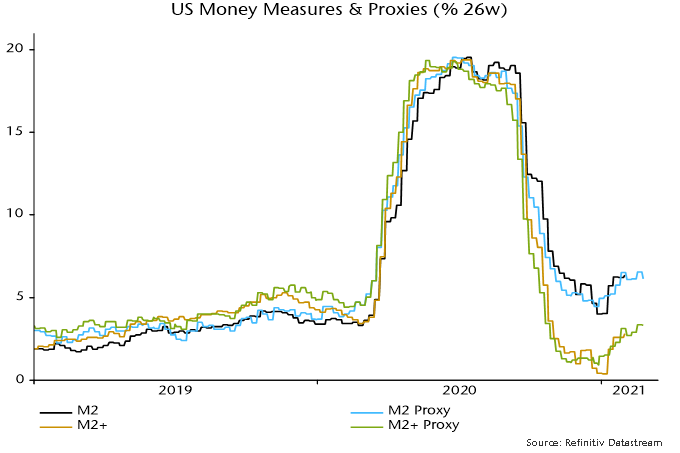
*”Broad money” refers to “M2+”, calculated as M2 plus large time deposits at commercial banks and institutional money funds.


In typical fashion, markets have reflected opposing sentiments – uncertainty and optimism. On the one hand, the worry associated with the pandemic and on the other, optimism fueled by a resurgence in activity and strong government support. Our portfolio management and asset allocation teams have been busy, first and foremost, protecting capital during the market decline and then shifting positioning to benefit from the recovery. As we look forward here are some areas of opportunity we see as we manage client capital through a challenging time. 

Revisiting equity exposure for a changing environment

Some investors might conclude that mega-cap stocks in Canada and US are the only place to be. Companies like Shopify, Facebook, Amazon, Microsoft, Apple and Google had very strong returns and our portfolios benefited from owning them. However, the recovery in stocks has broadened beyond these names. For example, in late 2020 we saw a resurgence in companies that were hurt most from lockdowns. With new vaccines these companies got a new lease on life. Throughout the year our teams took profits by selling some of the mega-cap stocks and buying companies likely to benefit from a post-vaccine world. This includes buying leaders in the travel and leisure industry. This may be hard to imagine at this point of COVID fatigue, but remember markets are always looking forward.

Late last year investors also began to favour areas that are more cyclical like value stocks, small-cap and emerging markets. These areas of the market were laggards earlier last year and have now risen above the pack. We were positioned for this shift in leadership by having a strategic allocation to value stocks and tactically buying small-cap and emerging earlier in the year. Today we are overweight equities in client portfolios with a bias to global small-cap companies. We believe we will benefit from a strong earnings recovery as more businesses reopen and stimulus remains a strong tailwind. We have also continued to increase our weight in emerging markets companies and recently launched a frontier equities strategy. As we look longer-term we believe these asset classes will be important sources of return in portfolios. 

Bond investing in the wake of a pandemic

Our positioning in bond portfolios also reflects that the worst appears to be over. Yet we are not in the clear and safety is important in a bond portfolio. The challenge, however, is that the tradeoff for safety is low yields. Current yields remain lower than they were before the pandemic and central banks are inclined to keep them low. Our bond portfolios are positioned to improve yield by investing in high quality corporate and provincial bonds. We also believe that government stimulus will result in rising inflation expectations. This has led us to own real return bonds which will benefit from this trend. Finally, we have positioned the portfolio to benefit if the recovery stalls and bond yields fall. This is a prudent offset to other positioning and helps protect capital should the economic recovery falter. 

As we look to strike a balance between safety and income, we have also been adding to high yield bonds that carry a much higher yield. The focus here is on strong credit research to avoid companies that may not be resilient if economic recovery stalls. 

Fertile ground for alternatives

Private market alternatives have been an attractive addition to portfolios for some time. These assets can be generally characterized as having strong returns, coming mostly from income and relatively low volatility. This combined with added diversification makes private market alternatives appealing on a long-term basis. The tradeoff for accessing these characteristics is reduced liquidity and the time it takes to deploy capital into new assets. Recently, however, we have been able to put more client assets to work in these strategies. Within our infrastructure portfolio we completed the purchase of four operating wind assets and one construction-stage solar project in the US. These assets have strong expected returns and benefit from fixed price contracts for the energy produced. Not to mention this now brings our renewable power generation to 1.4 gigawatts, enough energy to power more than 320,000 homes.  

Within our direct real estate portfolio we have completed our first purchase in the residential apartment sector. Historically residential has generated more stable returns and income compared to other property types like retail and office. We expect our allocation to this property type will increase.

Our positioning

The bumpy road to long-term performance

Building wealth for the future requires discipline, thorough research and a process for managing risk. The opportunities that are most attractive today are assets that can benefit the most from the economic recovery. Yet we also need to recognize that the road to recovery from here will be bumpier than what we’ve experienced so far. To manage this risk we continue to be broadly diversified while tactically tilting the portfolio to the areas of the market with the greatest opportunity. 

This post is for information only and is not intended as investment advice. The views expressed are those of the author at the time of publication and are subject to change at any time.

TORONTO, March 5, 2021—Connor, Clark & Lunn Funds Inc. (CC&L Funds) announced today the launch of the PCJ Absolute Return II Fund, a market neutral, absolute return strategy targeting long term returns similar to equities, but with less volatility and low correlation to market direction. The Fund will be offered via prospectus under the alternative mutual fund framework (Liquid Alt) and will be managed by PCJ Investment Counsel Ltd. (PCJ), consistent with a portfolio they have managed institutionally for the past 10 years.

Both CC&L Funds and PCJ are part of the Connor, Clark & Lunn Financial Group Ltd. (CC&L Financial Group), one of Canada’s largest independently owned asset management firms, and a leader in alternative investments, responsible for over $86 billion in assets on behalf of institutional investors globally, as well as individual investors in Canada.

“We have been fortunate to partner with a number of top investment advisory teams across Canada who have told us in recent years that they want the convenience of an absolute return portfolio in Liquid Alt form, but also one with a demonstrated track record of success. With the launch of the PCJ Absolute Return II Fund, we are meeting those objectives.” said Tim Elliott, President and CEO of CC&L Funds.

“We’re excited that our Absolute Return portfolio is being made accessible to a broader group of Canadian investors,” said Adam Posman, Chief Investment Officer at PCJ, “Our team has conviction in our ability to continue to generate compelling long term, risk-adjusted returns with this strategy. Given its lower volatility profile than equity markets, and the low expected returns from fixed income markets, we view the portfolio as a compelling standalone investment or portfolio diversifier.”

About the fund

Available in A and F Series, the fund conforms with the regulatory framework related to Alternative Mutual Funds.  The fund will be offered through licensed investment dealers, priced daily, with weekly liquidity, and available through FundServ.

About Connor, Clark & Lunn Funds Inc.

Connor, Clark & Lunn Funds Inc. (CC&L Funds) partners with leading Canadian financial institutions and their Investment Advisors to deliver unique institutional investment strategies to individual investors through a select offering of funds, alternative investments and separately managed accounts.

By limiting the offering to a focused group of products, CC&L Funds is able to deliver unique and differentiated strategies designed to enhance traditional investor portfolios. For more information, please visit www.cclfundsinc.com.

About PCJ Investment Counsel Ltd.

PCJ Investment Counsel Ltd. provides discretionary investment management of Canadian equity securities to pension plan sponsors, corporations and mutual funds. PCJ employs an active approach that blends an initial top-down perspective with bottom-up fundamental research focusing on stock selection and trading. PCJ manages three Canadian long-only equity strategies as well as an absolute return strategy with a focus on Canadian equities. For more information, please visit www.pcj.ca.

About Connor, Clark & Lunn Financial Group Ltd.

Connor, Clark & Lunn Financial Group Ltd. (CC&L Financial Group) is a multi-boutique asset management firm that provides a broad range of investment management products and services to institutional investors, high net worth individuals and advisors. We bring significant scale and expertise to the delivery of non-investment management functions through the centralization of all operational and distribution functions, allowing our talented investment managers to focus on what they do best. CC&L Financial Group’s affiliates manage over $86 billion in assets. For more information, please visit www.cclgroup.com.

Contact

Lisa Wilson
Manager, Product & Client Service
Connor, Clark & Lunn Funds Inc.
416-864-3120
[email protected]

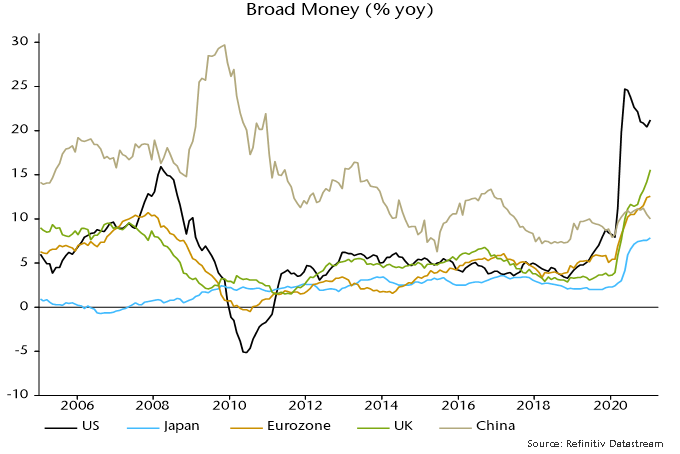
UK broad and narrow money measures continue to surge, with growth now significantly above that in the Eurozone – a reversal of the norm in recent years. This suggests strong near-term prospects for domestic demand and support for UK equity prices but at the likely cost of a sizeable deterioration in the balance of payments combined with much higher inflation.

Annual growth of the preferred broad money measure here – non-financial M4, comprising money holdings of households and private non-financial corporations – rose further to 15.6% in January, the highest since 1989. Eurozone money growth on a comparable measure – non-financial M3 – was 12.5%.

Chart 1

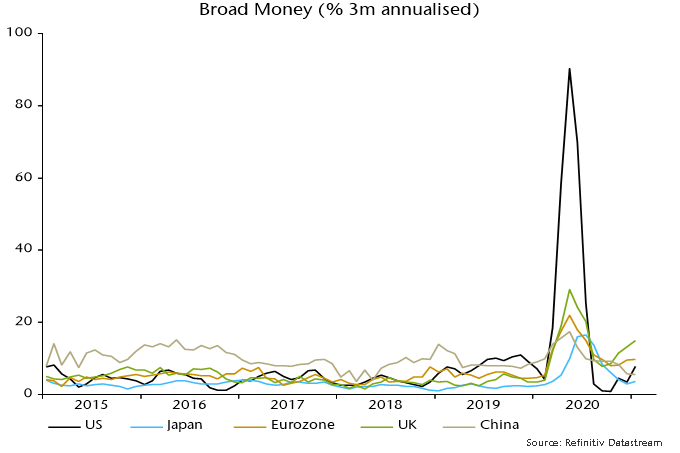
Annual broad money growth remains strongest in the US but the UK has moved into the lead on a three-month comparison: UK annualised expansion of 14.9% over November-January compares with 7.8% in the US and 9.8% in the Eurozone – chart 2.

Chart 2

The Bank of England has suggested that household bank deposits have been boosted by a recent outflow from National Savings but this provides, at best, only a partial explanation of broad money strength. A wider aggregate including National Savings and foreign currency deposits grew by 11.4% annualised in the latest three months.

The National Savings effect, in any case, may have been offset by an outflow from bank deposits to purchase unit trusts and OEICs: inflows to retail funds totalled £14.5 billion in November / December, according to the Investment Association, compared with a £9.1 billion outflow from National Savings over the same two months.

Why has UK broad money growth strengthened relative to trends elsewhere? The UK has been running a larger fiscal deficit and funding this almost wholly through the banking system. “Monetary financing” – net lending to government by the Bank of England and other monetary financial institutions – totalled £261 billion in the 12 months to January, equivalent to 93% of public sector net borrowing of £279 billion.

Monetary financing contributed (in an accounting sense) 13.7 percentage points (pp) to annual non-financial M4 growth of 15.6% in January; the equivalent contribution to non-financial M3 growth in the Eurozone was 7.4 pp.

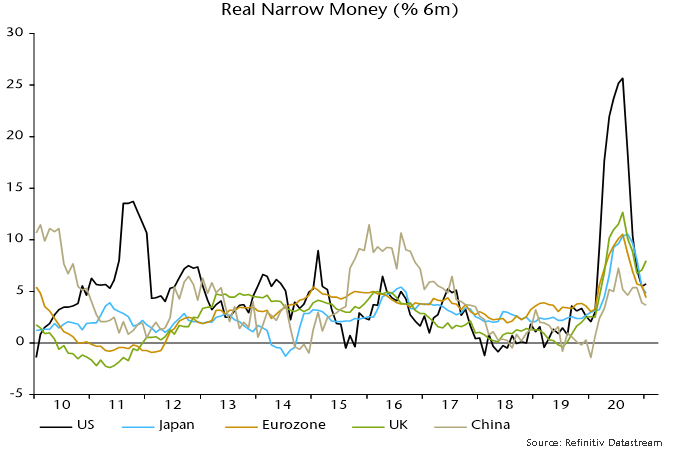
Broad money trends set the medium-term path for nominal demand, incomes and inflation but narrow money is a better guide to short-term economic prospects. Six-month growth of real narrow money (non-financial M1 deflated by consumer prices) has risen since November and is stronger than in other major economies  – chart 3.

Chart 3

Six-month real narrow money growth was consistently lower than in the Eurozone over 2017-19, a period during which UK GDP lagged Eurozone growth by 1.4 pp (i.e. measured between Q4 2016 and Q4 2019). UK equities returned 5.1% less than Eurozone equities in the three years to end-2019, with underperformance accelerating last year, according to MSCI US dollar indices. With Eurozone six-month real narrow money growth continuing to moderate, the current UK lead is the largest since 2002.

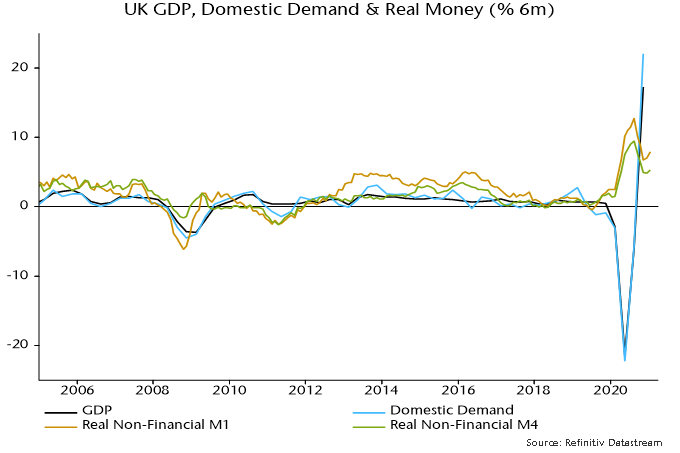
The rebound in six-month real money growth since November from an already strong level suggests a monetary boost to domestic demand and GDP momentum during H2 2021. This could interact with economic reopening to generate boom conditions by early 2022.

Chart 4

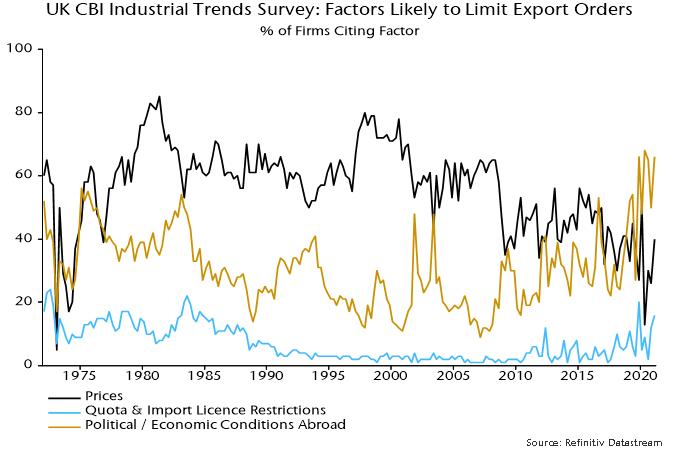
Domestic demand strength has been associated historically with rapid growth of imports and a worsening current account position. The impact could be magnified on this occasion by supply-side damage from the pandemic and a Brexit drag on exports. The CBI quarterly industrial trends survey asks manufacturers whether specified factors are acting to limit export orders. The Brexit effect is probably captured under “quota and import licence restrictions” and “political or economic conditions abroad”. The percentage citing the former is the highest since the 1980s, while the series for political / economic conditions abroad reached a record before the covid shock, rising further since. The percentage of firms expressing concern about price competitiveness, by contrast, is below the long-run historical average, though has increased as sterling has appreciated – chart 5.

Chart 5

Services exporters are expected to be harder hit than manufacturers because of the omission of services from the trade agreement with the EU.

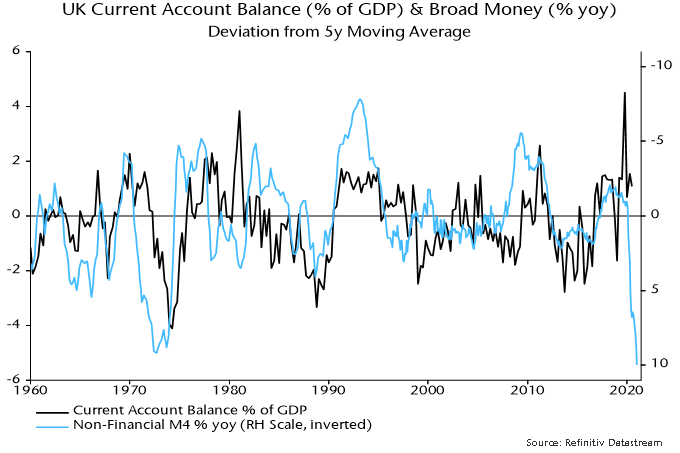
Chart 6 shows that the current account position has tended to deteriorate following a rise in broad money growth relative to the medium-term trend (plotted inverted), although often with a significant lag. A comparable money growth surge in 1971-72 was associated with the current account moving from surplus in 1972 to a deficit of 3.9% of GDP in H1 1974. The starting position now is worse, with a deficit of 2.9% of GDP in Q3 2020.

Chart 6

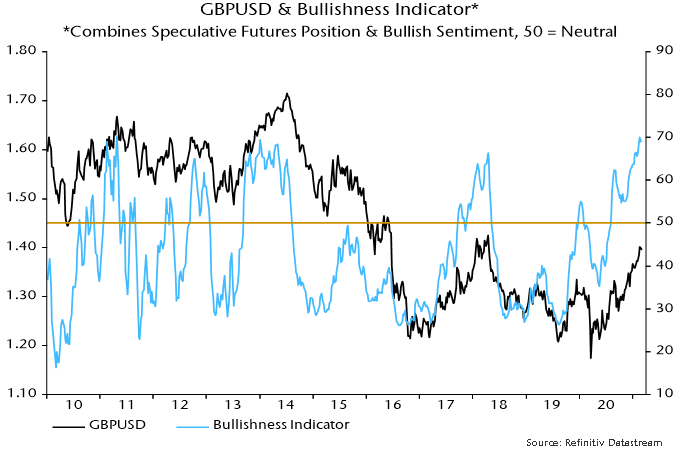
A blowout in the current account deficit would suggest medium-term downward pressure on sterling. A strong economic rebound might be expected to provide near-term support for the currency but speculators are already long and worries about the inflationary implications of fiscal dominance of monetary policy could bring forward weakness. An indicator combining speculative futures positioning and bullish sentiment as measured by Consensus Inc. is at the top of its range in recent years, suggesting a pause in sterling’s rally, at least – chart 7.

Chart 7

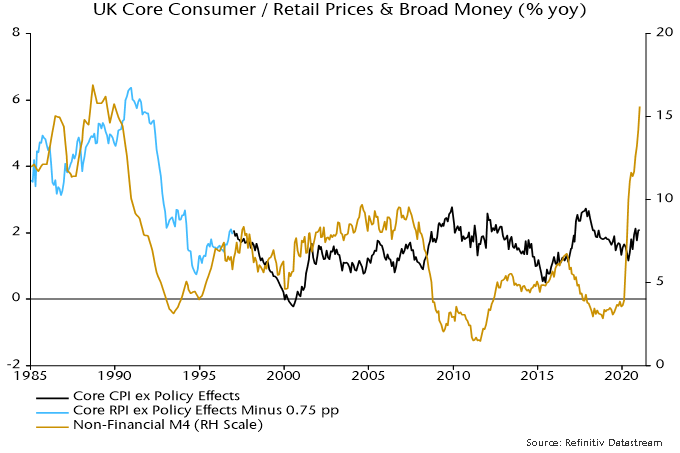
A fall in sterling has been a standard feature of the transmission of rapid UK money growth into inflation. As previously discussed, annual broad money growth has led turning points in annual core CPI / RPI inflation by an average of 26-27 months since WW2. With money growth still rising in January 2021, core inflation may pick up into early 2023, at least.

Chart 8

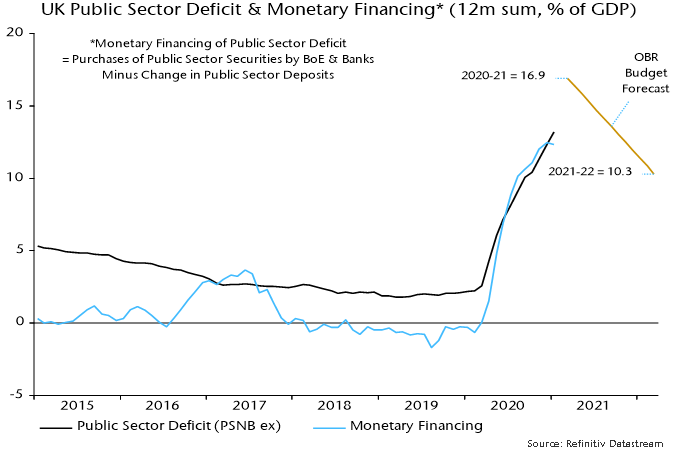
Annual broad money growth will moderate as bumper monthly rises over March-May 2020 drop out of the calculation but fiscal / monetary plans suggest that it will remain high. The MPC decided at its November meeting to buy an additional £150 billion of gilts during 2021, equivalent to 6.9% of the stock of non-financial M4 at the start of the year. Fiscal financing needs may call forth more QE, with the OBR now expecting borrowing of £234 billion in 2021-22, up from £164 billion in November and equivalent to 10.3% of GDP – chart 9.

Chart 9

The Environmental, Social & Governance (ESG) revolution reached a long-awaited turning point in 2020. Responsible investment assets experienced explosive growth around the world, and the issues and developments in ESG are becoming increasingly complex and diverse. In this commentary, we provide you with a few highlights on the following: growth of global sustainable assets; government initiatives on climate change; and Global Alpha’s ESG progress.

Growth of global sustainable assets

According to Bloomberg, governments, corporations and other groups raised a record $490 billion in 2020, selling green, social and sustainability bonds. A further $347 billion was poured into ESG-focused investment funds – an all-time high. More than 700 new funds were launched globally.

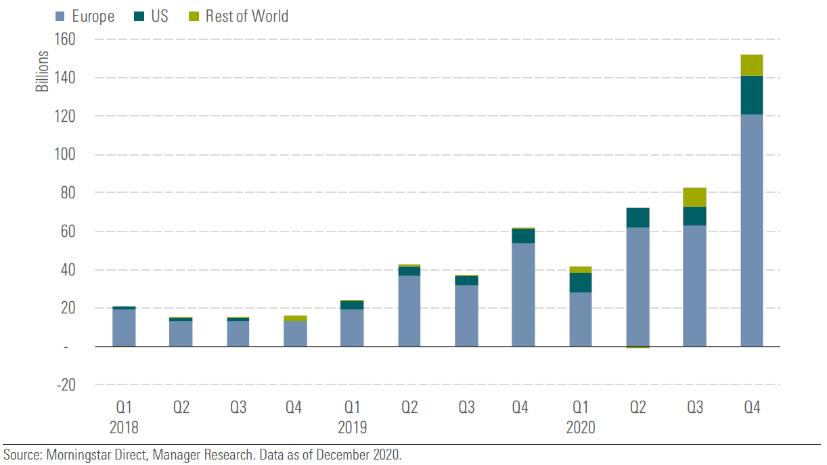
Based on Morningstar’s report on sustainable open-end funds and ETFs, there were a total of 4,153 sustainable funds as of December 2020[1]. The total sustainable fund assets hit a record $1.65 trillion in 2020. In Q4 alone, the inflow surpassed $150 billion, led by Europe.

Quarterly Global Sustainable Fund Flows (USD Billion)

New ESG fund launches accelerated into year-end, with a record of 196 in Q4. Again, the increase was driven by Europe, which launched 147 funds, while the United States (US) and rest of the world launched 12 and 37, respectively. According to the Institutional Shareholder Services (ISS) ESG Asset Manager’s survey conducted in Q3 2020, 37.5% of asset managers reported plans to hire more ESG-related staff to manage the expected increase in workload[2].

Government initiatives on climate change

Europe has consistently been a leader on the ESG front. The European Green Deal aims to make the European Union (EU) climate neutral by 2050. It plans to increase the EU’s greenhouse gas emission reductions target for 2030 to at least 50% and towards 55%, compared with the 1990 level.

Several pieces of sustainable finance legislation will come into force soon. The most mentioned is the EU Taxonomy Regulation, which is intended to ensure that designated environmentally sustainable economic activities genuinely contribute to climate change mitigation and adaption, and thus to the transition to a low-carbon economy.

In the US, the Biden administration plans to invest $1.7 trillion to achieve 100% clean energy and net-zero emissions by 2050. Meanwhile in South America, Amazon rainforest fires resulted in enhanced measures to protect biodiversity in Brazil. The Brazilian government faces a threat of divestment by major European investors if ESG risks facing Amazon rainforest regarding deforestation, mining and beef production are not addressed.

Asia is a latecomer in terms of ESG development, but is catching up rapidly. Japan is committed to becoming carbon neutral by 2050, and plans to spend $2 trillion in green business and investment. China also announced the carbon neutral target by 2060 and will implement mandatory environmental reporting by companies in 2021. The Hong Kong Stock Exchange already set up mandatory ESG disclosure rules regarding board disclosure, climate change and ESG reporting.

Global Alpha’s ESG progress

Principles for Responsible Investment (PRI) Reporting

The assessment of our PRI Reporting in 2020 demonstrated a clear improvement in comparison to 2019. Three reporting modules were applicable to us:

  1. Strategy & Governance: Our score was A+ (A in 2019)
  2. Direct & Active Ownership: Listed Equity – Incorporation: Our score was A (B in 2019)
  3. Direct & Active Ownership: Listed Equity – Active Ownership: Our score was B (same as in 2019)

Proxy Voting

While acknowledging the slow progress in active ownership, in 2020 we enhanced our engagement efforts by implementing a detailed Proxy Voting Policy with stricter guidelines. When we considered voting against a company’s proposal, we would engage with them first.

In 2020, we voted against 21% of proposals, versus 10% the previous year. The biggest disapproval was related to executive compensation, where we voted against 39% of proposals, versus 23% a year earlier. Other common issues were about board independence and board diversity.

Our Proxy Voting Policy in some cases is more stringent than ISS’s recommendations. In 2020, we voted against ISS for 14% of proposals, versus 3% in 2019.

Diversity & Inclusion

In October 2020, we became one of the founding signatories to the new Canadian Investor Statement on Diversity & Inclusion. Subsequently, we updated our ESG questionnaire to companies to enhance engagement on this topic. We work with several brokerage firms that are owned by women or minorities.

Within Global Alpha we also promote diversity & inclusion:

  • One of the three co-founders is female;
  • Three of the six partners at the firm are minorities, and two of the six are female;
  • Seven of the eleven team members were immigrants to Canada;
  • The team speaks many languages, including English, French, Spanish, Mandarin, Japanese, Vietnamese, Hindi, Gujarati, Memoni, Konkani and Marathi.

It is our strong belief that diversity of team and thought are key contributors to successful investing. It has been a deliberate practice at the firm to build a team of investment professionals with different backgrounds and experiences. Collectively, the team has worked across a number of industries, and in a variety of capacities. In particular, the team believes that having professional experience outside of the finance industry provides an added perspective when evaluating a company and understanding its growth potential.

Carbon Footprint Analysis

Based on the Climate Impact Assessment reports provided by ISS, the carbon footprint analysis of our Global Small Cap and EAFE Small Cap portfolios have consistently beaten benchmarks since the adoption of the reports in 2017.

Over the years, our Global Small Cap portfolio has been 30-40% less emissions intense than the benchmark, and our EAFE Small Cap portfolio 60-70% less intense.

Examples of ESG Leaders

Many of our holdings demonstrate excellent ESG practices. Here we would like to highlight two.

Vitasoy International Holdings (345 HK) was listed in 2020 Corporate Knights’ Global 100 Most Sustainable Corporations in the World. Among the 8,080 listed companies being rated worldwide, it ranked 62nd, up from 90th in 2019. Vitasoy is a leading food and beverage company in Asia, known for its soy-based products. It has been a holding since inception in 2008.

DMG Mori Co. Ltd. (6141 JP) announced recently that it aims to achieve carbon neutrality in all its operation bases across the world in 2021. DMG Mori AG, its European subsidiary, already achieved carbon neutrality in 2020, by offsetting the carbon emissions from its business activities through the investment in certified sustainable and climate protection projects. DMG Mori is the largest machine tool company in the world.

Outlook

Without a doubt, responsible investment assets will continue to grow rapidly, as more investors turn to ESG, not only for their personal values, but also for better risk management and investment return.

However, the world of responsible investment is not all rosy. The lack of company disclosure, different ESG approaches, sometimes contradictory ESG ratings, and fears of ‘greenwashing’ have created a maze for many people. Covid-19 also caused more concerns around social issues, such as workplace safety, treatment of employees, diversity and inclusion, and supply chain labour dynamics.

As a responsible investor, we are conscious that our role carries renewed purpose.


[1] Global Sustainable Fund Flows: Q4 2020 in Review, Morningstar, January 28, 2021

[2] ESG Themes & Trends 2021 – Volatile Transitions: Navigating ESG in 2021, Institutional Shareholder Services

TORONTO, ON, March 1, 2021 – CarbonFree Technology and Connor, Clark & Lunn Infrastructure (CC&L Infrastructure) today announced the sale of their jointly owned interest in a portfolio of commercial-scale Ontario solar projects to Potentia Renewables Inc, with funding from the newly created Power Sustainable Energy Infrastructure Partnership.

The BrightRoof solar portfolio, comprised of 57 rooftop and 5 ground-mount operating projects located across the province, has a generating capacity 18.6 MWp and produces more than 20 GWh of clean electricity each year. Twelve of the projects in the portfolio are wholly owned, while the other 50 are owned in partnership with the Métis Nation of Ontario (MNO), which will continue to hold its stake in the portfolio.

Over the past 10 years of working together, CarbonFree and CC&L Infrastructure have shifted their focus to developing and operating larger, utility-scale solar projects. In addition to the BrightRoof portfolio and 390 MWp of larger Ontario solar projects, the two companies have developed, constructed and operate 200 MWp of solar plants in Chile and have the rights to another 100 MWp of solar plants in Chile, to be constructed before the end of 2022.

CarbonFree and CC&L Infrastructure would like to thank the MNO for its steadfast partnership since 2012.

About CarbonFree Technology

CarbonFree Technology is a leading solar project developer, owner and operator, based in Toronto, Canada. CarbonFree develops and owns solar projects in Canada, the United States and Chile. Over the past 14 years, the company has developed more than 100 solar power projects with a total capacity of more than 500 MWp. For more information, please visit www.carbonfree.com.

About Connor, Clark & Lunn Infrastructure

CC&L Infrastructure invests in middle-market infrastructure and infrastructure-like assets with highly attractive risk-return characteristics, long lives and the potential to generate stable cash flows. CC&L Infrastructure is a part of Connor, Clark & Lunn Financial Group Ltd., a multi-boutique asset management firm whose affiliates collectively manage over CAD$86 billion in assets. For more information, please visit www.cclinfrastructure.com.

Contact

Kaitlin Blainey
Director
Connor, Clark & Lunn Infrastructure
(416) 216-8047
[email protected]

David Oxtoby
CEO
CarbonFree Technology
(416) 975-8800 x604
[email protected]

In the last week, record cold weather hit most of the United States (US), causing gas and power prices to spike across the country, from less than $3/btu to over $600. Texas regulators ordered rolling blackouts as the cold weather froze wind turbines, and snow and ice reduced solar energy production. Some experts were quick to blame renewable energy as the cause of these blackouts. Even if the growing use of wind and solar energy meant the grid may be less reliable, Texas still produces over 50% of its electricity from non-renewables, and that was also affected as gas was in short supply and water pipes froze. In this commentary, we will provide an update on the situation regarding renewable energies.

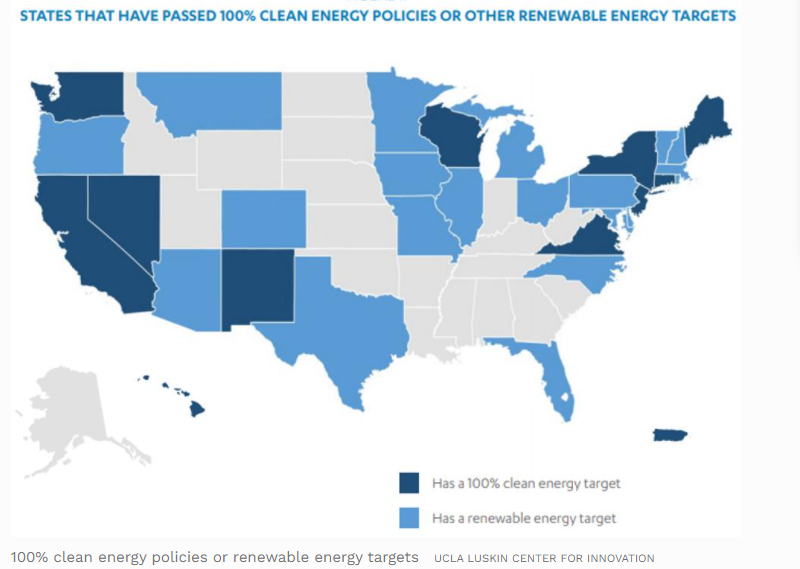
In 2020, more US states mandated renewable energy targets.

Source: UCLA Luskin Center for Innovation

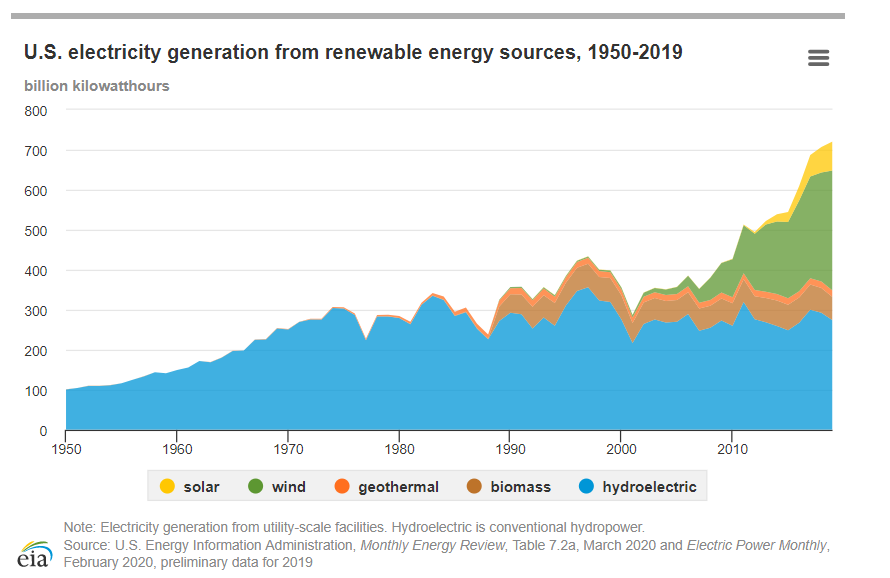
With or without these mandates, 2020 was another record year around the world for the growth of renewables. In the US, 78% of new electrical generating capacity commissioned was renewables, according to a review by the Federal Energy Regulatory Commission (FERC). Combined, it accounted for 22,451 megawatts (MW) or more than 78.09% of the 28,751 MW of new utility-scale capacity reported to have been added last year. Wind (13,626 MW or 47.4%) and solar (8,543 MW or 29.7%) each contributed more new generating capacity than natural gas (6,259 MW or 21.7%).  

Current capacity of renewables is now above 24% of total capacity in the US and should exceed 30% by 2025.

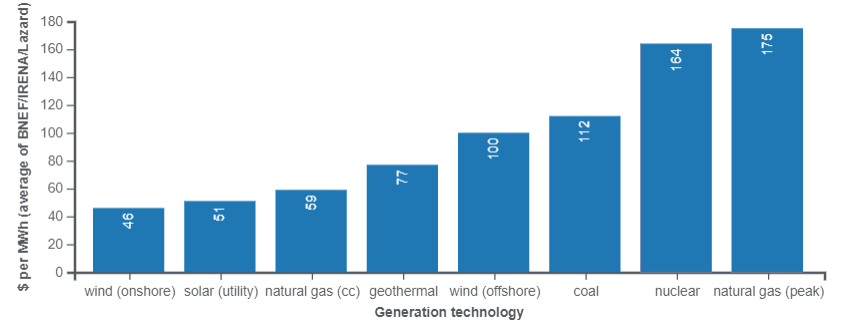
We often hear that renewables require subsidies to compete with oil and gas, coal and nuclear. Let’s take a look at the total cost and production cost of these various sources. The costs include capital costs, operations, maintenance, and de-commissioning and remediation. Recent major global studies of generation costs note that wind and solar power are the lowest-cost sources of electricity available today.

Sources: Lazard 2020, Bloomberg New Energy Finance (2020), International Renewable Energy Agency (IREA) 2020

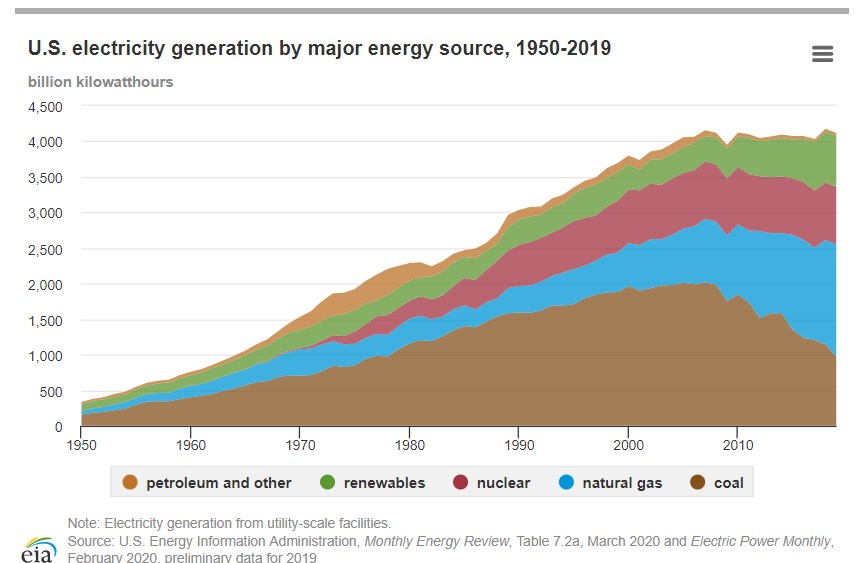
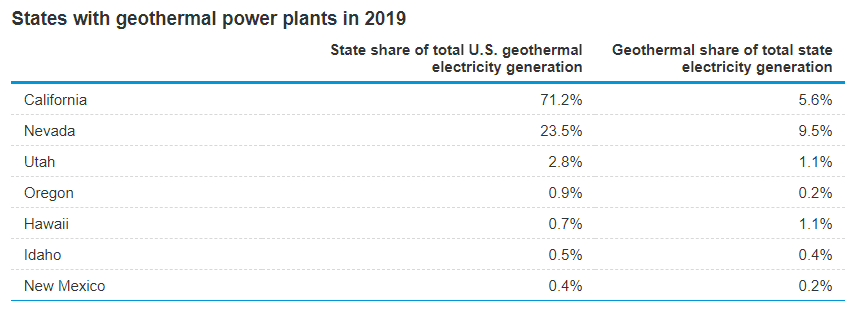
What about the reliability of wind and solar energies? If they could never represent 100% of generating capacity, what should the base load be? We can see in the above chart that geothermal energy is also attractive in terms of costs. It’s clean and renewable, and better yet, is available 24/7, meaning it could be a base load energy. However, in 2019, geothermal only represented 0.5% of US electricity generation. 

Source: US Department of Energy

There are signs that things could change. A report released in May 2019 by the Department of Energy suggested that US geothermal power capacity could increase by more than twenty-six times by 2050, reaching a total installed capacity of 60 GW, thanks to accelerated technological development and adoption. This is turn would greatly reduce costs. 

Since 2008, we’ve held Ormat Technologies in our portfolio, a world-leading geothermal energy company. Ormat Technologies (ORA US, ORA IT) was founded in Israel in 1965 to pursue its objective to further develop renewable energy. Active in the geothermal field since the early 1980s, the Integrated Two-Level Unit (ITLU) was a vital development in maximizing the thermodynamic efficiencies of lower-temperature resources. The patented ITLU design revolutionized the industry and, to this day, distinguishes Ormat from other companies. The company has been public since 2004, and has established its headquarters in Reno Nevada. Further, Ormat is an energy producer with 933 MW of production globally. Another important achievement is regarding the world’s largest single binary geothermal power plant – the Ngatamariki in New Zealand – that began its commercial operations in 2013.  Ormat provided the engineering, procurement and construction for the 100 MW geothermal project that delivers sustainable energy to power 80,000 homes annually.

In addition to its geothermal expertise, Ormat is now a leading player in the field of energy storage and management. Its solutions started from energy and demand response management, and energy storage systems. The company provides grid operators with the power to enhance grid performance, stability, and responsiveness, while delivering capacity at the right time and the right price. It also provides commercial, industrial and municipal clients with reliable and good quality power solutions, as well as peak shaving and demand charge management solutions to lower their utility bill and, in the unregulated markets, provide ancillary market services to generate revenue.

Coming back to Texas, last August, Lone Star Demand Response, LLC and Viridity Energy Solutions, Inc. signed a new five-year business-to-business agreement to continue the delivery of first-class demand response (DR) curtailment management services throughout times of high electricity demand. This will bring Lone Star Demand Response into a position to carry on with protecting the various generation and transmission systems from overloading during peak times and to fine-tune the demand to match the available supply. While Lone Star Demand is not part of the portfolio, Viridity is owned by Ormat.   

In short, geothermal and energy storage may be the solutions to increase the reliability of electricity production while keeping with the goal of increasing renewables and reducing the environmental impact.

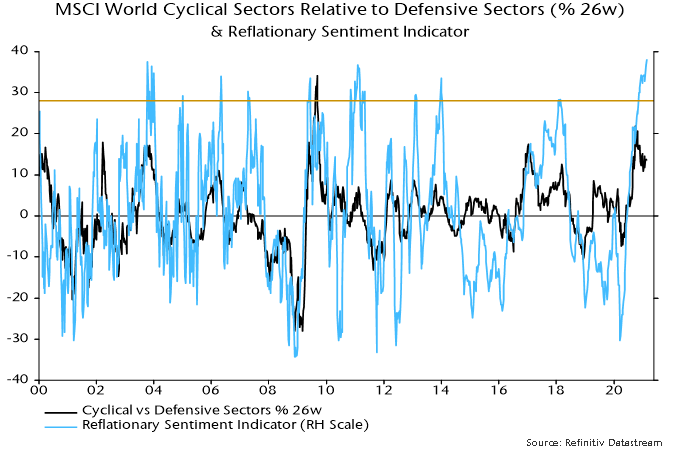
Reflationary sentiment in markets is extreme, suggesting that investors should be cautious about chasing cyclical assets and inflation hedges.

The chart updates the reflationary sentiment indicator calculated here by combining bullish sentiment data sourced from Consensus Inc. for various markets that have correlated (positively or negatively) with global economic momentum historically. This week’s reading is a record in data extending back to 2000.

The sentiment indicator, unsurprisingly, correlates positively with the relative performance of MSCI World cyclical equity market sectors* but extreme readings often signal a short-term turning point.

Indicator values above the 95th percentile of the distribution over 2000-19 (the horizontal line) were associated with an average decline of 6.6% in the ratio of cyclical to defensive sectors within the following six months (i.e. from the starting level to the low point over that period). The range was -1.5% to -13.3%.

The maximum rise within the six months following an extreme positive indicator reading averaged 1.6%. In 8 of the 37 weekly cases, the sentiment extreme marked the high point of the cyclical to defensive sectors relative.

The time to switch to a pro-cyclical investment strategy was March last year when the sentiment indicator was at an opposite extreme and money measures were surging, suggesting strong support for economies and markets.

Global six-month real narrow money growth peaked in July 2020 and appears to have fallen further in January – an update will be provided following the release of remaining January country data over coming days.

*Cyclical sectors (MSCI definition) = materials, industrials, consumer discretionary, financials, real estate, IT and communication services. Defensive sectors = energy, consumer staples, health care and utilities.

As a result of COVID-19 and the consequent travel restrictions, household consumption has increased in recent months while spending on leisure travel has declined. It is anticipated that spending on leisure travel will gradually return, however we doubt it will result in a decrease in at-home leisure spending. Due to the pandemic, a greater number of people are working from home, thus spending more time at home. The cocooning and healthy living trends should continue to support household spending in categories such as gardening, well-being, and home-related expenses. We believe that long-term growth trends in the swimming pool industry are looking bright. Fluidra, a company we initiated a few months ago, should benefit from strong market fundamentals.  

Spanish-based Fluidra is one of the leading manufacturers of pool equipment. The company is the most vertically integrated player in that industry, with manufacturing and distribution activities for residential and commercial pools. Fluidra manufactures all components of a residential or commercial pool (i.e., pumps, heaters, valves, filters, cleaners, chemicals). In 2018, the company merged with Zodiac, another well-established pool equipment manufacturer. With that merger, Fluidra became the world’s largest pool equipment manufacturer with a market share of around 18%. The company generates 49% of its sales in Europe, 31% in North America and 20% in other international markets. For fiscal year 2020, consensus estimates are for sales of €1,475 million and an EBITDA of €304 million.

We expect demand to remain strong in the coming months, both in the aftermarket and new build areas. In addition, product innovation should continue to drive demand for pool products up. Last year was a good year for new builds, and based on pool builders, 2021 will be even stronger. Further, the commercial segment will be another driver, despite a relatively soft 2020. As the hospitality sector gradually recovers in 2021, we anticipate that the commercial market will experience renewed growth soon.

Market size

  • The market size for pool equipment is €7.1 billion, growing at 4%-6% per annum. Growth will come from an increasing average ticket size, growth in the installed pool base as well as new build growth.
  • The aftermarket represents about 73%, while new build is 21%.  
  • Regarding end markets, the residential pool market is 70%, the commercial pool market (hotels, spas, etc.) is 7%, pool water treatment is 14%, while other uses account for 9%.
  • On average, the base of new pool installations grows by 325,000 units per annum.

Growth strategy

  • Product development driven by innovation (e.g., energy efficiency products, Internet of Things, sustainability, etc.).
  • Growing the distribution network by signing new distributors.
  • Bolt-on acquisitions.

Strengths

  • Fluidra is the dominant player in pool equipment with a market share of 18%.
  • Following the merger with Zodiac, Fluidra is well positioned in all market segments.
  • Widespread global coverage with a strong distribution network.
  • Broad diversification by products, geographies, and distributors.
  • Management has delivered the balance sheet over the past two years and the company is now in a stronger financial position.
  • Commercial and industrial synergies.
  • Ability to innovate.

Opportunities

  • Environmental consideration and stronger demand for energy efficient products.
  • The average basket value for pool equipment is expected to soar (e.g., variable speed pumps are 50% more expensive than single speed pumps).
  • There is also a strong demand for better product functionality, such as connected devices (only 3% of existing pools are considered somewhat connected).
  • Emergence of the middle class in developing countries would generate new demand. Global warming should support demand for pools.
  • Housing activity and urbanization overall.
  • The market is very fragmented and there are many small to medium companies that could be consolidated.

Risks

  • There is some seasonality in the business skewed towards the first half of the year.
  • Their products are discretionary by nature and could be impacted by a deterioration of housing activity, and by weaker disposable incomes.
  • Competition.

An article in November presented a “monetarist” forecast of a rise in UK annual CPI inflation to 3.2% in Q4 2021, far above the Bank of England’s central projection of 2.1% (reduced to 1.9% in February). News since then has been consistent with the assumptions underlying the forecast, which is maintained.

January inflation of 0.7% was slightly above the forecast for the month made in November.

Economists share the Bank’s relaxed view of prospects. The median Q4 projection in the Treasury’s latest survey of independent forecasters is 2.0%. Only one contributor expects an outturn above 3%*.

The assumptions underlying the forecast are set out below but the key differences from the Bank / consensus are 1) a larger rise in global commodity prices and associated stronger paths for energy / food inflation, 2) a more pessimistic assessment of current core trends, and 3) an expected increase in core inflation in response to last year’s broad money surge.

The commodity price view is on track, with the Brent oil price up by 40% since November and Ofgem hiking the energy price cap by 9% from April – above a 5% assumption in the November forecast. The FAO world food price index, meanwhile, rose by 7% between November and January, pushing annual growth up to 11%.

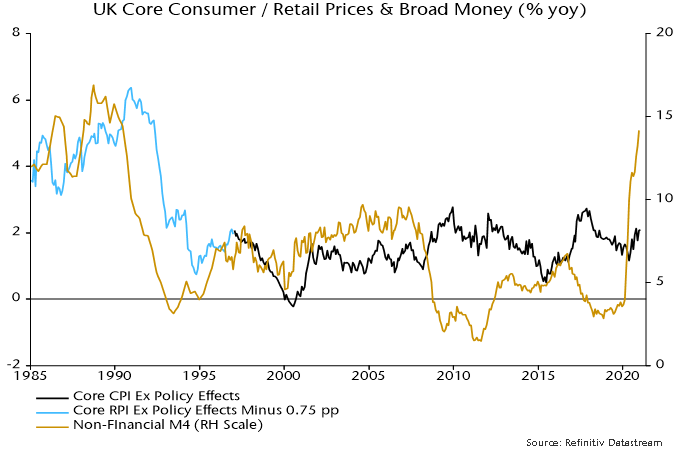
The preferred broad money measure here (i.e. non-financial M4, comprising money holdings of households and private non-financial corporations) continued to rise strongly in November / December, with annual growth now at a 31-year high of 14.2% – see chart 1.

Chart 1 

Previous research documented a leading relationship between broad money growth and core CPI / RPI inflation in post-WW2 data, with an average lead time at turning points of 26-27 months. The lead, however, varied widely and was affected particularly by exchange rate developments. A fall in money growth in the late 1990s, for example, was swiftly reflected in core inflation because of prior sterling strength. The lead was much longer after the GFC, when a large fall in the currency placed extended upward pressure on import prices.

Sterling’s effective rate has firmed 3% since November but is little changed from a year ago. A reasonable assumption, therefore, is that the lead time from money growth to core inflation will conform to historical average experience, implying a rising core rate through end-2022, at least.

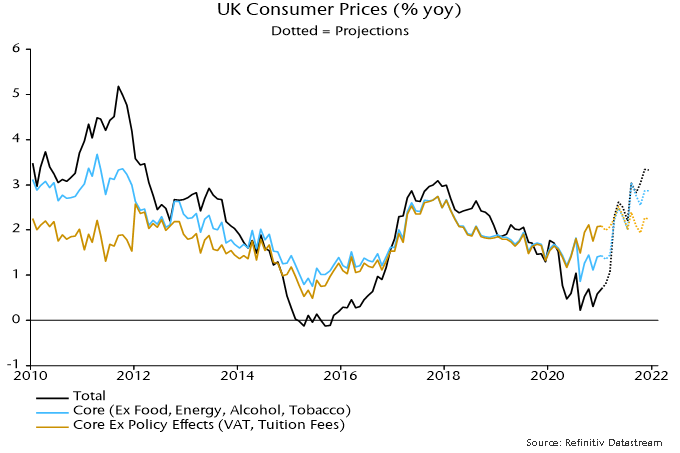
An assessment of current core trends is complicated by the temporary VAT cut for hospitality and tourism. The assumption here is that one-third of this cut was reflected in prices, in which case core inflation (i.e. ex. energy, food, alcohol and tobacco) of 1.4% in January is understated by 0.7 percentage points (pp). The Bank of England and consensus assume that pass-through was much lower.

The forecast, accordingly, assumes a 0.6 pp boost to published core inflation when VAT for these industries is normalised – currently scheduled for April but possibly to be delayed**. The Bank / consensus view, by contrast, implies little impact. The VAT reversion is likely to coincide with excess demand for these services as the economy reopens, suggesting scope for providers to hike prices to protect current margins – the assumption of one-third pass-through could be too conservative.

Chart 2 shows projections for headline inflation, the published core measure and the policy-adjusted core series calculated here. These incorporate the same assumptions as in November, except for a small change in the Ofgem energy price cap.A rise in inflation for food, alcohol and tobacco to 2.0% in December 2021 (2010-19 average = 2.5%, January = 0.4%).

A return of vehicle fuel prices to their pre-covid level (unleaded petrol = £1.28 per litre).

A further 3% increase in the Ofgem energy price cap in October.

Monthly growth in core prices excluding tax effects of 2.25% at an annualised rate.

Chart 2

Note that the headline and published core rates will be artificially high in Q4 because of a reversal of the VAT effect. This distortion will end in April 2022, assuming that VAT is normalised in April 2021. Adjusted core inflation, however, is likely to have risen further by then, suggesting limited decline in headline / published core rates.

What could derail this forecast? A significant further rise in the exchange rate could push back an inflation pick-up but bullish positioning in sterling may already be extreme, judging from Consensus Inc. sentiment and US CFTC futures data – risks may now be skewed to the downside.

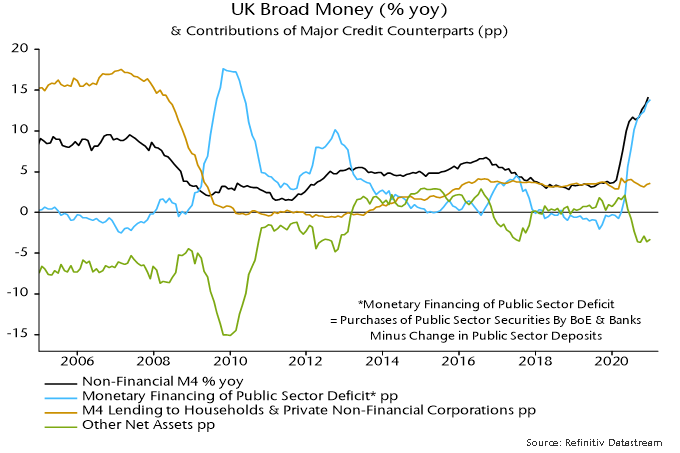
Inflation prospects beyond 2021-22 will depend on broad money developments this year. Monetary deficit financing has given as large a boost to broad money growth in the UK as in the US – chart 3. With little appetite for fiscal restraint***, and the Bank of England restored to its historical role of government financing arm, it is likely to remain a significant driver this year, suggesting low probability of money growth returning to its post-GFC average (i.e. over 2010-19) of 4.2%.

Chart 3

*Economic Perspectives (Peter Warburton).
**The impact is asymmetric because of changes in weights.
***The claim that low bond yields “make it a good time for governments to borrow” is misleading, because deficits are being financed by monetary expansion (and an implicit future inflation tax) rather than borrowing from savers: low yields would be unlikely to survive a switch to non-monetary financing.