Global money trends continue to suggest a near-term economic slowdown, with the caveat that interpretation of US monetary statistics is complicated by recent regulatory changes.
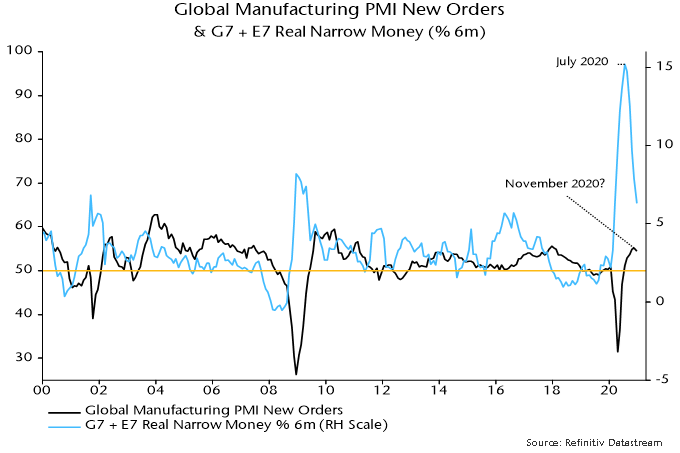
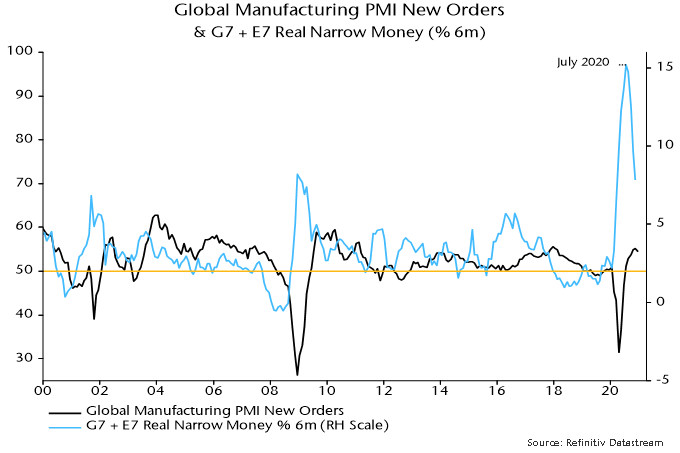
The key global monetary indicator followed here – six-month growth of real narrow money in the G7 economies and seven large emerging economies – is estimated to have fallen further in December, based on monetary data covering 70% of the aggregate. Real money growth has led the global manufacturing PMI new orders index by 6-7 months on average historically, so the continued decline from a July 2020 peak suggests that this PMI measure will move lower into Q2 – see chart 1.
Chart 1
An important qualification is that the G7 plus E7 money numbers for November / December incorporate an adjustment to US data to correct for an apparent upward distortion due to some banks reclassifying savings deposits (excluded from M1 and related measures) as demand deposits (included).
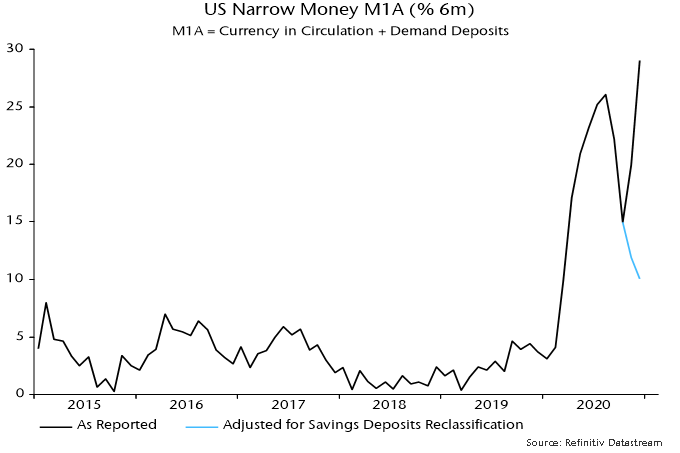
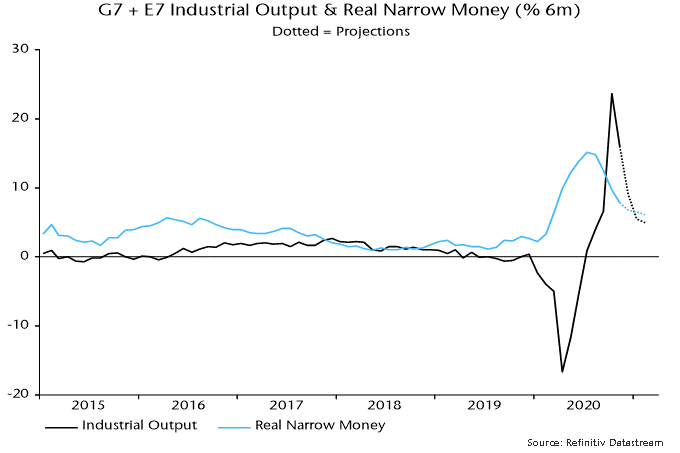
Excluding this adjustment, six-month growth of US narrow money rose to a new high at year-end – see chart 2. Some monetary observers ignore or are unaware of the reclassification distortion, arguing that the narrow money surge presages a super-strong economy and sharply higher inflation.
Chart 2
Fed statisticians haven’t responded to a request for confirmation of a reclassification effect on the data. The view that the strong November / December numbers are explained by such an effect – rather than a genuine flow of money out of “inert” savings deposits into “high velocity” demand deposits – rests on three considerations.
First, the Fed indicated that deposit reclassifications would occur following its decisions to cut reserve requirements on transactions deposits to zero and remove restrictions on withdrawals from savings deposits last spring.
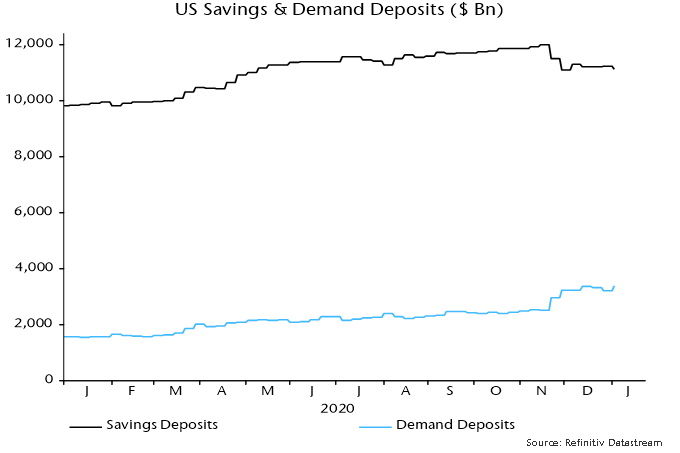
Secondly, the big fall in savings deposits and corresponding rise in demand deposits occurred between the weeks ending 16 November and 30 November – see chart 3. Movements outside this two-week window were “normal”. The weekly numbers are averages of daily data, so the reclassification is likely to have occurred during the week ending 23 November, with the effect carrying over into the following week. (The alternative view is that US election results triggered a big movement of money.)
Chart 3
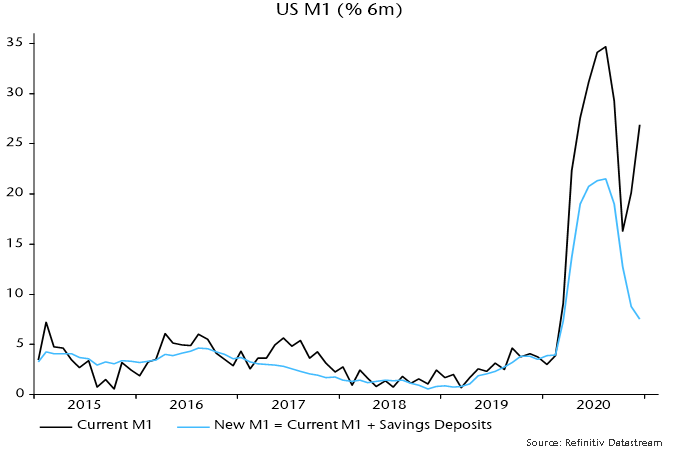
Thirdly, the Fed implicitly acknowledged that the M1 data have become distorted in its decision to redefine the aggregate to include savings deposits from next month. Six-month growth of the new M1 measure continued to slide in November / December – see chart 4.
Chart 4
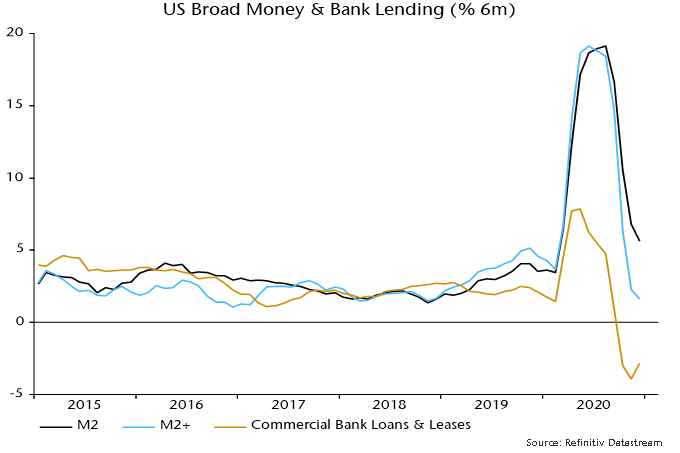
The suggestion that US monetary conditions have become less expansionary is supported by broad money trends, while bank lending continued to contract into year-end (with weakness not due to PPP loan forgiveness, which has yet to kick in) – see chart 5.
Chart 5
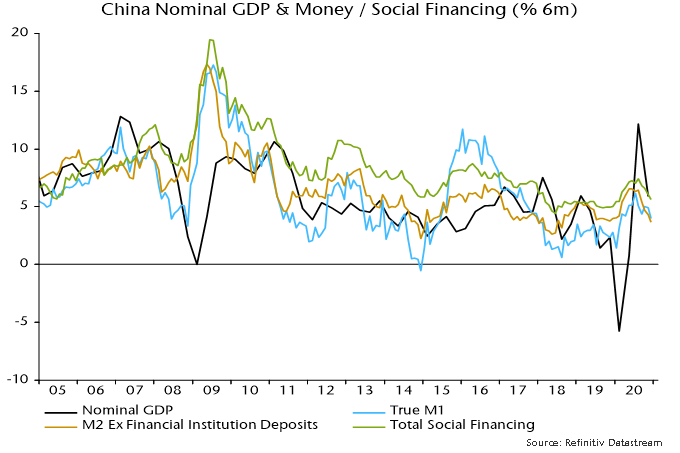
The fall in global six-month real narrow money growth in December also reflected declines in China, Japan and Brazil. The further slowdown in China – extending to broad money and credit, as shown in chart 6 – is consistent with the view here that PBoC policy is too tight and Chinese economic news is likely to disappoint in early 2021. A dovish PBoC policy shift may be needed to trigger the next leg of the global reflation trade but isn’t expected by the consensus and could be conditional on a prior market setback.
Markets overview
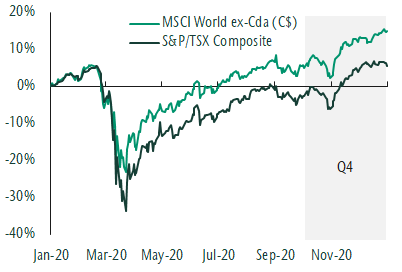
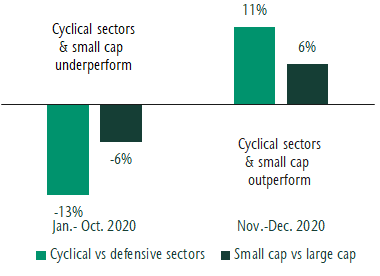
Equity market returns were strong this quarter as the global economy continued to show signs of healing in the face of rising virus cases and more shutdowns. The S&P/TSX Composite Index was up 9.0% and the MSCI World ex Canada Index (C$) advanced 8.8% this quarter. The start of November marked a significant inflection point for markets. The US election resulted in some short-term market volatility which subsided. This was followed by the clearly positive news of an approved COVID-19 vaccine. A better vaccine that is available to people faster than previously expected provides a boost to the economic outlook, even if it does take many months to distribute widely. This has allowed investors to look beyond near-term economic uncertainty to a more normal environment. A shift in market leadership followed as investors bought companies that were most negatively affected by lockdowns and stood to benefit the most from an eventual end of the pandemic. In addition, assets that are more sensitive to the economic cycle began to outperform. This includes cyclical sectors like energy and financials as well as asset classes like global small cap stocks.
Equity markets reach new highs in Q4
Source: Refinitiv
Significant shift in market leadership
Sector returns are for the MSCI World. Cyclical sectors include materials, energy, consumer discretionary, financials and real estate. Defensive sectors include consumer staples, health care and utilities. Small cap returns are based on the MSCI World Small Cap Index and large cap returns are for the MSCI World Index. All returns in Canadian dollars. Source: Refinitiv
Bond returns were mixed this quarter. Government and provincial bonds were modestly negative and corporate bonds generated positive returns. The net result was that the FTSE Canada Universe Bond Index returned 0.6% for the quarter. High yield bonds, like equities, benefited from an improved investor outlook. Despite default rates remaining elevated, demand for these investments has been strong and yields have tightened.
Our thoughts
We have been seeing a recovery in the economy unfolding for some time and have positioned portfolios accordingly. We have maintained an overweight to equities with a bias to global stocks. We have increased our weight to asset classes that tend to do well in a recovery such as small cap stocks. This quarter we sold core bonds and bought high yield bonds as credit conditions improved. This is consistent with the beginning of a new business cycle which historically coincides with improving returns for high yield.
Overall our equity teams continue to own resilient, stable businesses that have higher earnings growth than the market. Through the recovery we have selectively added more cyclical companies standing to benefit from an improving outlook and the start of a new business cycle. Within Canada this means increasing exposure to banks and energy companies. Within our global strategy we remain overweight emerging markets and have reduced the underweight to financials and increased positioning in select leisure companies. Within fixed income we are overweight credit and inflation-protected debt. Our positioning has benefited clients well this quarter and year.
From the desk of Jeff Guise, Managing Director, Chief Investment Officer, CC&L Private Capital.
This post is for information only and is not intended as investment advice. The views expressed are those of the author at the time of publication and are subject to change at any time.
FOR IMMEDIATE RELEASE
CONNOR, CLARK & LUNN INFRASTRUCTURE CLOSES U.S. RENEWABLE POWER INVESTMENT
TORONTO, JANUARY 11, 2021
Connor, Clark & Lunn Infrastructure (CC&L Infrastructure) is pleased to announce that it has completed its previously announced acquisition of an 80% equity interest in a U.S. wind and solar portfolio.
This transaction, which was completed alongside Régime de Rentes du Mouvement Desjardins and Desjardins Financial Security Life Assurance Company (together, Desjardins Group), included the purchase of four operating wind projects and one construction-stage solar project located in Indiana, Wisconsin, Oklahoma, and Ohio. Each asset is fully contracted through long-term power purchase agreements with high-quality offtakers, and the portfolio provides geographically diversified exposure to three distinct U.S. electricity markets. Construction of the solar facility began in December 2020 and is expected to be operational later this year or early in 2022.
“Completing this investment achieves an exciting milestone for our business,” said Matt O’Brien, President of CC&L Infrastructure. “The addition of these projects increases the total capacity of our renewable power portfolio well past a gigawatt globally. We look forward to operating these high-quality projects alongside our partners over the coming years.”
CC&L Infrastructure now owns approximately 1.4 GW of renewable power globally, with more than 1GW in operation. On a combined basis, these operating facilities are expected to produce approximately 4 million MW hours of clean energy each year – enough energy to power more than 320,000 homes and offset the equivalent greenhouse gas emissions of more than 600,000 passenger vehicles for a year.
About Connor, Clark & Lunn Infrastructure
CC&L Infrastructure invests in middle-market infrastructure and infrastructure-like assets with highly attractive risk-return characteristics, long lives and the potential to generate stable cash flows. CC&L Infrastructure is a part of Connor, Clark & Lunn Financial Group Ltd., a multi-boutique asset management firm whose affiliates collectively manage over CAD$85 billion in assets. For more information, please visit www.cclinfrastructure.com.
Contact
Kaitlin Blainey Director Connor, Clark & Lunn Infrastructure (416) 216-8047 [email protected]
The forecasting approach employed here – relying on monetary and cycle analysis – turned positive on the global economy and risk markets in early Q2 2020 but is giving a more cautionary message at the start of 2021. The suggestion is that underlying economic momentum will slow temporarily while monetary support for markets has diminished, together raising the risk of a correction. The central view remains that global growth will be strong over the course of 2021 as a whole but with the adverse corollary of a significant pick-up in inflation into 2022.
The monetary aspect of the forecasting approach can be summarised as “real money leads the economy while excess money drives markets”. Six-month growth of real (i.e. inflation-adjusted) narrow money in the G7 economies and seven large emerging economies (the “E7”) was weak at the start of 2020 but surged from March, correctly signalling a strong rebound in global economic activity during H2.
Real money growth, however, peaked in July, falling steadily through November, the latest data point – see chart 1. Turning points in real money growth have led turning points in the global manufacturing PMI new orders index – a key coincident indicator – by 6-7 months on average historically, suggesting that the PMI will move lower in early 2021. The level of money growth remains high, arguing against economic weakness (except due to “lockdowns”), but a directional shift in activity momentum could act as a near-term drag on cyclical assets.
Chart 1
“Excess” money refers to an environment in which actual real money growth exceeds the level required to support economic expansion, with the surplus likely to be invested in markets. Two gauges of excess money are monitored here: the gap between six-month growth rates of G7 plus E7 real narrow money and industrial output, and the deviation of year-on-year real money growth from a long-run moving average. Historically, global equities performed best on average when both measures were positive, worst when they were negative, and were lacklustre when they gave conflicting signals.
Following a joint positive signal (allowing for data release lags) at end-April 2020, the measures became conflicting again at end-December – year-on-year real money growth remains well above its long-run average but six-month growth fell below that of industrial output in October / November. Markets, therefore, may no longer enjoy a monetary “cushion” against unfavourable news, including the expected PMI roll-over.
The expectation here is that markets will become more volatile but risk assets are unlikely to be outright weak – any sizeable set-back would probably represent another buying opportunity. As noted, real money growth remains at an expansionary level and may stabilise soon, while the cycle analysis is giving a positive economic message for the next 12+ months, as explained below.
The cross-over of six-month real narrow money growth below industrial output growth, moreover, could prove short-lived, with output momentum about to fall back sharply as positive base effects fade. Assuming a stabilisation of monthly money growth, a positive differential could be restored as early as January – see chart 2 – in which case the assessment of the monetary backdrop for markets would shift back to favourable from Q2.
Chart 2
The cycle analysis provides a medium-term perspective and acts as a cross-check of the monetary analysis. There are three key economic activity cycles: the stockbuilding or inventory cycle, which averages 3.5 years (i.e. from low to low); a 9-year business investment cycle; and a longer-term housing cycle averaging 18 years. These cycles are essentially global in nature although housing cycles in individual countries can sometimes become desynchronised.
The cycle analysis was cautionary at the start of 2020, reflecting a judgement that the stockbuilding and business investment cycles were in downswings that might not complete until mid-year. The covid shock magnified but ended these downswings, with both cycles bottoming in Q2 and entering a recovery phase in H2. With the housing cycle still in an upswing from a 2009 low, all three cycles are now acting to lift global economic momentum.
The next scheduled cycle trough is a low in the stockbuilding cycle, due to be reached in late 2023 if the current cycle conforms to the average 3.5 year length. The downswing into this low would probably start about 18 months earlier, i.e. around Q2 2022. The cycle analysis, therefore, is giving an “all-clear” signal for the global economy for the next 15-18 months, implying that any data weakness – such as suggested by monetary trends for early 2021 – is likely to be minor and temporary.
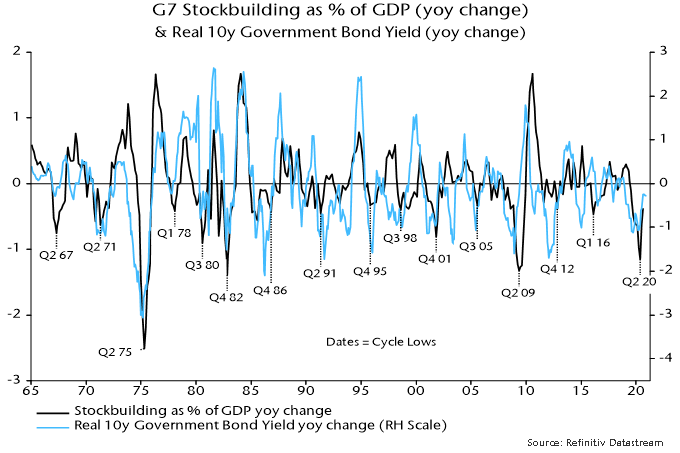
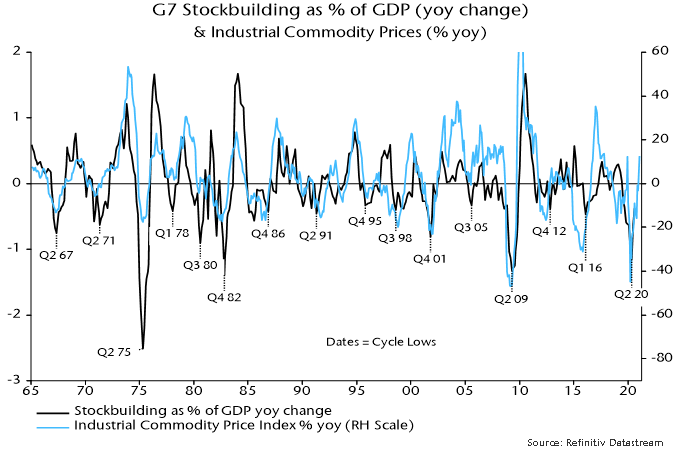
Financial market behaviour is strongly correlated with the stockbuilding cycle in particular. Cycle upswings are usually associated with rising real government bond yields and strong commodity markets – see charts 3 and 4 – as well as low / falling credit spreads and outperformance of cyclical equity sectors. The latter three of these trends, of course, were in place during H2 2020 and may extend during 2021 after a possible Q1 correction. A surprise to the consensus in 2021 could be a rebound in real bond yields, which would challenge current equity market valuations and could favour “value”.
Chart 3
Chart 4
To sum up, monetary data in early 2021 will be important for the strategy assessment here. The current monetary backdrop and possible weaker near-term economic data suggest reducing cyclical exposure relative to H2 2020 but a stabilisation or revival in real money growth would support the positive message from the cycle analysis, arguing for using any setback in cyclical markets to rebuild positions in anticipation of a strong H2.
Consumer price inflation rates are widely expected to rise during H1 2021, reflecting recent commodity price strength, a reversal of temporary tax cuts (Germany / UK) or subsidies (Japan), and base effects. The policy-maker and market consensus is that this will represent a temporary “cyclical” move of the sort experienced regularly in recent decades. The suspicion here is that it will prove more lasting and significant, because the monetary backdrop is much more expansionary / inflationary than before those prior run-ups.
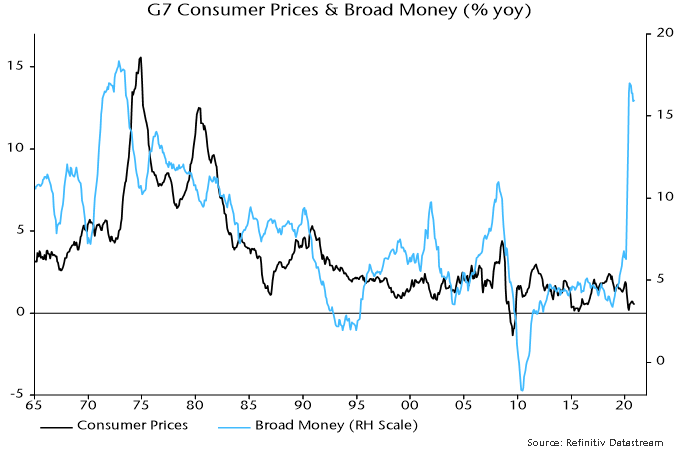
Broad rather than narrow money trends are key for assessing medium-term inflation prospects. This is illustrated by Japan’s post-bubble experience: narrow money has grown strongly on occasions but annual broad money expansion never rose above 5% over 1992-2019, averaging just 2.1% – the monetary basis for sustained low inflation / mild deflation. Similarly, G7 annual broad money growth averaged only 3.7% in the post-GFC decade (i.e. 2010-19).
2020 may have marked a transformational break in monetary trends. G7 annual broad money growth peaked at 17.0% in June, the fastest since 1973 – see chart 5. Monthly growth has subsided but there has been no “payback” of the H1 surge. At the very least, this suggests a larger-than-normal “cyclical” upswing in inflation in 2021-22. Ongoing monetary financing of large fiscal deficits may sustain broad money growth at well above its levels of recent decades, embedding the inflation shift.
Chart 5
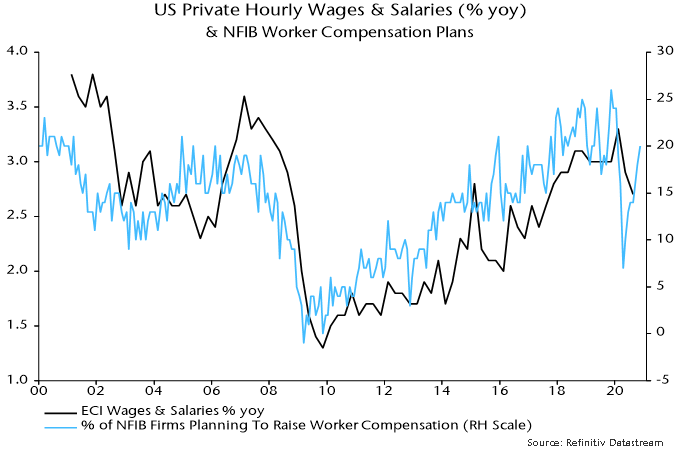
The consensus view that an inflation pick-up will prove temporary rests on weak labour markets bearing down on wage growth. Unemployment rates adjusted for short-time working / furlough schemes, however, fell sharply as the global economy rebounded in H2 2020 and structural rates have probably risen – labour market “slack”, therefore, may be less than widely thought and much lower than after the 2008-09 recession. The slowdown in wages to date has been modest and some business surveys are already hinting at a rebound – see chart 6.
Chart 6
Commentators who take seriously the prospect of a sustained inflation rise often argue that real bond yields would take the strain by moving deeper into negative territory, the view being that central banks will cap nominal yields. Such a scenario would be bullish for risk assets but probably overstates the power of the policy emperors. Pegged official rates and a QE flow currently running at about 10% of the (rapidly rising) outstanding stock of G7 government bonds per annum could prove insufficient to offset selling by existing holders in the event of an unexpected inflation surge.
Markets reached new highs in 2020 in the face of a global pandemic. This leaves some asking if this is sustainable. Continued growth depends on improvements in the economy, company earnings and government support. The good news is that we have seen advances on these fronts over the last several months. However, markets have high expectations for 2021 and any shortfall may result in a setback. Here are three areas we are looking to see progress on in 2021:
1. Markets and the economy become more connected
The global economy had a terrible 2020 but equity markets delivered strong returns. This disconnect is quite normal when a cycle comes to an end and a new one emerges. The reason is that the economic data provides an assessment of where we were, while the market is focused on a brighter future. Looking forward we need to see continued improvements in the economy and believe market returns may be more modest- reflecting a more normal outlook as opposed to a strong recovery. Of course, these improvements don’t happen in a straight line and fluctuation in the economic recovery will cause volatility in markets.
2. Earnings will need to move above pre-pandemic levels
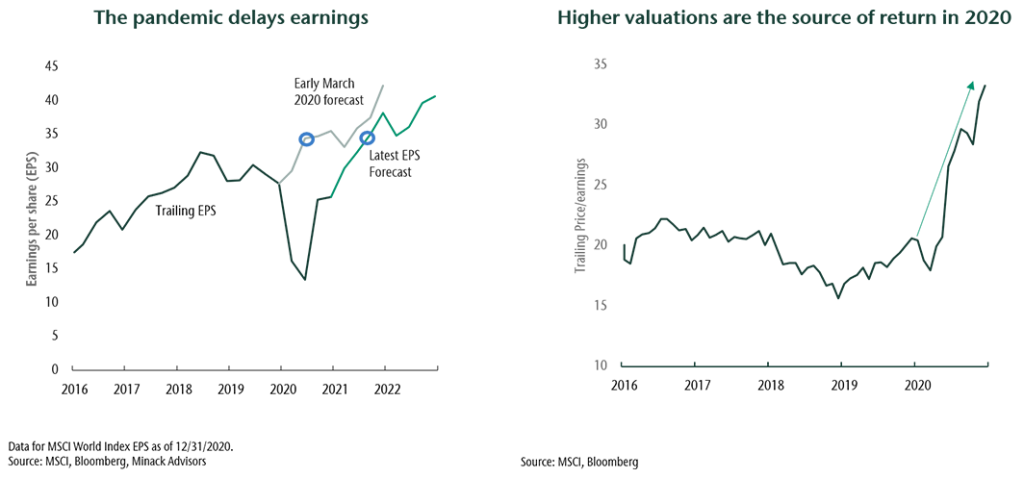
As economic activity increases in 2021, overall business earnings should continue to recover. Globally, earnings are expected to rise and surpass pre-pandemic levels in late 2021. This isn’t good for equity markets- it’s a requirement! This is because the current market level already reflects this earnings recovery in the form of higher valuations. If this outlook falters, it may lead to a temporary decline in markets.
3. Government support is a necessity
The recovery we have experienced has been largely the result of unprecedented government spending, zero percent interest rates and bond-buying by central banks to heal credit markets. Going forward, government spending will be the dominant tool for managing the recovery. We are looking for a continued willingness of policymakers to run sustained supportive policy until there can be a transition to private-sector spending and investment.
What does this mean for your portfolio?
An improved outlook for the economy combined with uncertainty argues for portfolio diversification. At CC&L Private Capital, we have built diversity within our asset class strategies and across our investment platform. Diversification across traditional and alternative asset classes will be even more important as we look ahead. In 2020 we increased investments in private market assets like infrastructure. We also began to offer frontier market investments to our clients and increased exposure to emerging markets. This broadens portfolio diversification and positions our clients well for the future.
Often after discussing our market outlook, a client will ask, what should I be doing? For long-term investors, sticking to your existing strategy (while we manage the rest) is almost always the best advice. This year we would add to this sage wisdom and say now is a really good time to revisit your asset allocation to ensure that you are balancing risks while achieving the long-term return necessary to meet your financial objectives.
This post is for information only and is not intended as investment advice. The views expressed are those of the author at the time of publication and are subject to change at any time.
CC&L Private Capital recently passed the milestone of managing $10 billion of clients’ assets. While this is a tremendous accomplishment, we know it is not about the dollars. It is about the trust of so many Canadian individuals, families, Indigenous communities, not-for-profits and charitable foundations. We take immense pride in our commitment to stewarding our clients’ wealth with confidence.
We founded CC&L Private Capital in 1997. Our vision was to give private clients access to the discipline and talent afforded to the institutional pension clients our progenitor firm has been managing since 1982. In those early days, our main competitors were mostly independently owned. Since then, they have merged, or the big banks have taken them over – a constant reminder of the importance of evolving and staying at the forefront of our clients’ needs.
It took a decade to get our footing, but a steady momentum of new clients joining came over time. In 2013, to address our ambitious goals for growth, performance and a best-in-class client experience, we made a meaningful change in response to an increasingly competitive, complex and regulated industry. A review of CC&L Private Capital’s leadership brought three Managing Directors to the helm to provide a new level of depth in the three areas of importance to an investment firm’s success. Catherine Dorazio, Jeff Guise, and Corey MacEachern, respectively provided expertise in sales, investments and operations, while working as one to direct the business in unison. Leveraging their combined knowledge to create and drive strategy has translated into even greater success. We have outpaced industry peers in asset growth, client retention and investment performance.
Today, our clients have access to our broad, pension-grade investment platform. It complements traditional global stocks and bonds with alternative assets, such as private loans, real estate, infrastructure, hedge funds and private equity. This goes well beyond the early days of a traditional investment offering. We have also strengthened our client experience, delivered by more than 40 investment professionals countrywide, supported by a growing team dedicated to advancing all business areas. On top of this, CC&L Private Capital is part of CC&L Financial Group, which has grown in parallel over these decades. It provides our clients with a strong backbone of 11 affiliated investment teams managing approximately $80 billion in assets.
Over the past 20 years, we have evolved and adapted to the challenges of a continually changing financial market environment. More and more clients have trusted us to steward their wealth so they will comfortably live out their lifetime dreams. Our unique corporate structure, investment platform and high-calibre team put us in a position to succeed alongside them in achieving this.
Most importantly, we have never wavered on implementing our conditions for success: putting our clients’ interests first, attracting and retaining top talent, and protecting and nurturing our entrepreneurial corporate culture. These same guiding principles will serve us well into the future.