post in November presented a “monetarist” forecast that CPI inflation would rise to more than 3% by late 2021. This forecast appears on track.

The Bank of England’s central projection for Q4 2021 was 2.1% in November. This was lowered to 1.9% in February but raised to 2.5% in May.

A key element of the November forecast was a significant inflation boost from energy prices, reflecting a view that a strong global industrial recovery would push up oil and other commodity prices. This has played out: the CPI energy component rose by 7.5% in the year to April, contributing 0.5 percentage points (pp) to annual CPI inflation of 1.5%.

The energy effect explains the upward revision to the Bank of England’s forecast. The Bank now expects the contribution of energy prices to annual inflation to rise further to 0.75 pp by Q4 – similar to the view here, which assumes an additional 5% increase in the Ofgem price cap in October.

The forecast that CPI inflation will exceed 3% by year-end is driven by three additional factors:

  • The planned increase in VAT in the hospitality and tourism sectors from 5% to 12.5% in October, with a return to 20% scheduled for April 2022.
  • A pick-up in food price inflation, partly reflecting recent strength in global food commodity prices.
  • A rise in underlying core inflation (i.e. excluding the VAT effect as well as energy / food contributions) in lagged response to faster broad money growth.

Taking these in turn, the forecast assumes that there will be 35% pass-through of the VAT rise to prices, implying a 0.2 pp boost to the monthly change in the CPI in October. The Bank and consensus, by contrast, appear to assume a negligible impact. This is surprising: firms face rising costs and the withdrawal of government support while economic reopening should ensure strong demand – why would they allow margins to take the full hit from the VAT hike?

Food prices have so far been weaker than assumed in the November forecast here, falling by 0.5% in the year to April. Producer output prices of food products, however, were up by 2.3% over the same period, the largest annual rise since 2018 – see chart 1.

Chart 1
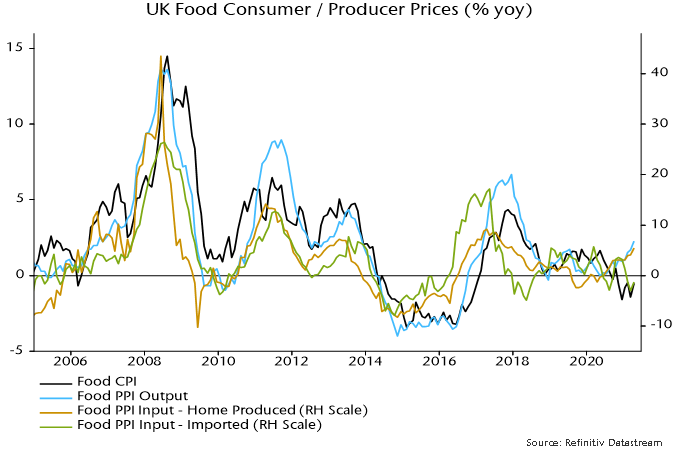
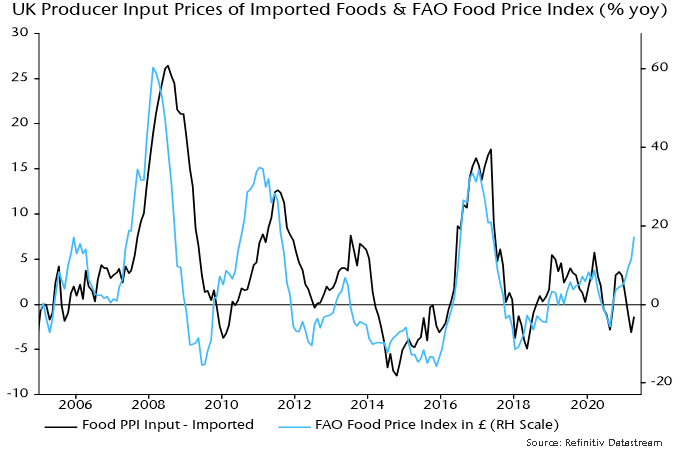
The pick-up in producer output prices appears to have been driven by higher input costs of home-produced food. Imported food materials, by contrast, have cheapened, partly reflecting sterling appreciation. This is about to change: the FAO global food commodity price index rose by 17% in sterling terms in the year to April – chart 2.

Chart 2
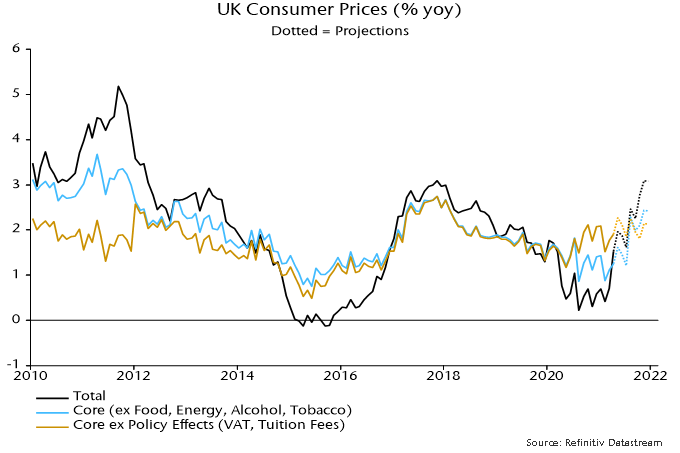
The forecast here continues to assume that annual CPI food inflation will rise to 2.0% by December.

The final element of the forecast is an expected further rise in underlying core CPI inflation. Actual core inflation (i.e. excluding energy, food, alcohol and tobacco) was 1.3% in April but the assumption of 35% pass-through of the VAT cut in hospitality and tourism implies a significantly higher underlying rate, of 1.9%. The underlying rate has risen from a low of 1.2% in May 2020.

Research previously reported here found a consistent directional leading relationship between broad money growth and underlying core inflation, albeit with a variable lead time influenced particularly by exchange rate movements – chart 3. The surge in annual broad money growth, as measured by non-financial M4, from 3.6% at end-2019 to a likely peak of 16.1% in February suggests further upward pressure on the underlying core rate in 2021 -22 – the assumption here is that it will rise to 2.1% by December.

Chart 3
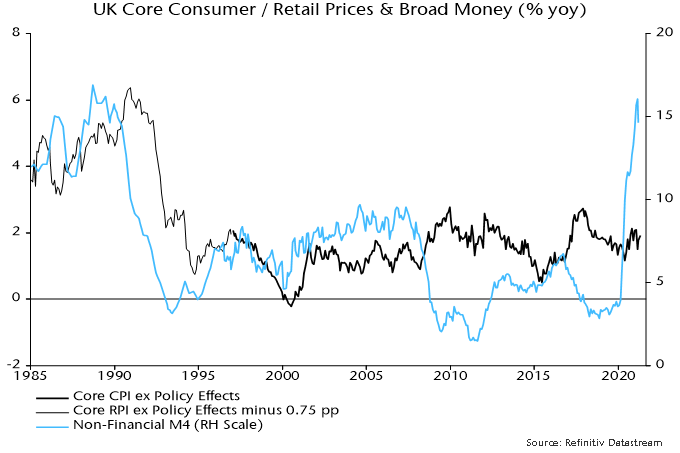
Chart 4 shows forecasts for headline, core and underlying core CPI Inflation through end-2021 based on the above assumptions. The headline rate finishes the year at 3.1% – slightly lower than in the November forecast because of the Budget decision to postpone full reversal of the VAT cut until 2022.

Chart 4
As most of you know, fundamental research informs Global Alpha’s stock selection, as it identifies equities with growing earnings that will meet or exceed our expectations. The pandemic challenged this philosophy in 2020, due to the volatile and unpredictable nature of corporate earnings. With low rates and subsidies, cashed-up investors looked elsewhere and flocked to non-earning companies, sending the Nasdaq 45.1% higher versus the S&P 500 at 18.4%.

A company with no earnings typically supports its stock price with material events that can de-risk future earnings. Investors gravitate to this approach as it can provide substantial short-term returns given the timelines around material events are well understood. Global Alpha tends to focus more on the entire capex cycle, smoothing out the volatility of a single event. For example, the technology and biotechnologies industries hold many event-driven companies. 

Hedge funds are a class of investors that commonly use event-driven strategies. According to the Hedge Fund Research (HFR) Database, the highest-returning hedge fund strategies in 2020 were event-driven funds, which gained 9.3% for the year. Macro hedge funds returned 5.2% for the year, while HFR’s own relative value index ended 2020 up 3.3%. The hedge fund industry’s total assets stand at $3.8 trillion, a 21% growth in one year. This occurred while the industry has had net outflows of -1.9% in 2020, according to Opalesque, a hedge fund publication.[1]

Interestingly, the Financial Industry Regulatory Authority (FINRA) reports that margin debt has jumped 51% since February 2020, to $823 billion in March 2021.[2] The $340 billion change is three times greater than any annual change in the last decade. It is therefore arguable that hedge funds, as well as many investors, are highly levered and exposed to event-driven companies.

Following the debacle of Archegos Capital Management, which faced massive margin calls from its prime brokers, Federal Reserve Governor Lael Brainard stated, “The Archegos event illustrates the limited visibility into hedge fund exposures and serves as a reminder that available measures of hedge fund leverage may not be capturing important risks.”

Where is all the new levered money (or at least part of it)?

According to PWC, the United States (US) equity and IPO capital markets in Q1 kicked off with yet another record, driven by the continued SPAC attack, with 389 IPOs raising $125 billion; 2020 raised $150 billion in total. A lot of this money is in newly issued, event driven, technology and biotechnology companies. The money is used to develop new products and services at an accelerated pace to catch up to their rich IPO valuations.  

These amounts materialize as capex and revenues to the subcontractors of technology or biotechnology companies, commonly known as the picks and shovel of an industry. Global Alpha is invested in these types of companies, which stand to benefit from the capital exuberance described above.

Additionally, our companies are profitable and diversified. They also are of lesser interest to event-driven hedge funds. These companies could be at a lesser risk of mass sell-off due to an Archegos Capital Management type liquidity crunch. Rich in pharmaceutical history, Europe holds many excellent contract research organizations that appear in our investment universe and have the biopharma industry as clients.

Evotec (EVT:GR)

Based in Hamburg, Germany, Evotec operates multiple scientifically driven contract research centers for the biopharma industry. The company has extensive scientific knowledge to assist in genetic and biochemical drug development programs.

With the large biopharma market growing at a compound annual growth rate (CAGR) of 13.5%, Evotec has been gaining market share with a 20% growth rate. The company recently launched a low cost biological drug production platform that is expected to grow revenues considerably in the mid-term. Evotec also signed an agreement with the Japanese giant Takeda for the development of RNAi drugs.

Oxford Biomedica (OXB:LN)

Global Alpha also owns Oxford BioMedica, a biopharmaceutical company engaged in the production of viral vectors, a key component of delivering a genetic drug.  Without vectors or other delivery systems, genetic material decays extremely quickly in the body. Oxford BioMedica offers a variety of vectors, including adenoviruses that are used in the present coronavirus vaccination program with AstraZeneca. However, it specializes in lentivirals, which have proven very efficient with biologics.

The FDA is predicting a wave of cell and gene therapies coming to market in the next few years, which is set to drive the overall end market to exceed $20 billion in the mid-term. The lentivirus vector market is expected to grow in excess of $1 billion by 2026, from $350-400 million today.


[1] https://www.opalesque.com/

[2] https://www.finra.org/

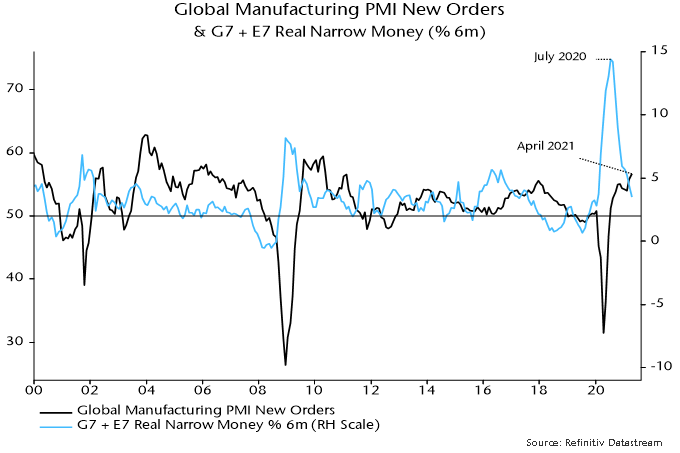
The forecast here remains that global industrial momentum, as measured by the manufacturing PMI new orders index, is at or close to a peak, with a multi-month decline in prospect.

The basis for the forecast is a fall in global six-month real narrow money growth from a peak in July 2020 – the rise into that peak is judged to correspond to the increase in PMI new orders to an 11-year high in April.

Available April monetary data indicate that real narrow money growth fell further last month, suggesting that the expected PMI decline will extend into late 2021 – see chart 1.

Chart 1

The presumption here is that PMI weakness will be modest, partly reflecting a view that the global stockbuilding cycle will remain in an upswing through H2. The cycle has averaged 3.5 years historically and bottomed in Q2 2020, suggesting a peak in Q1 2022 assuming an upswing of half-cycle length. Large declines in PMI new orders (i.e. to 50 or below) have usually occurred during cycle downswings.

Any PMI pull-back, however, could have significant market implications given consensus bullishness about global economic prospects.

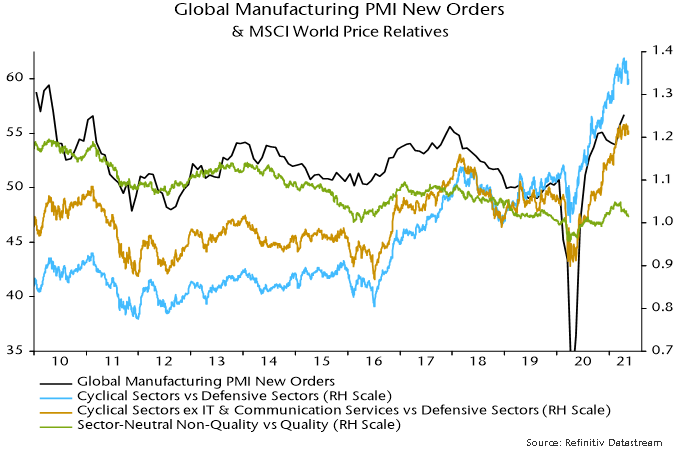
Historically, a declining trend in global manufacturing PMI new orders has been associated with underperformance of cyclical equity market sectors and outperformance of quality stocks within sectors. The price relative of MSCI World cyclical sectors to defensive sectors peaked in mid-April, falling to a three-month low last week – chart 2.

Chart 2

The decline has been driven by a correction in tech – the MSCI cyclical sectors basket includes IT and communication services. The price relative of non-tech cyclical sectors to defensive sectors has moved sideways since March.

The MSCI World sector-neutral quality index, meanwhile, has recovered relative to the non-quality portion of MSCI World since March, following underperformance in late 2020 / early 2021 when cyclical sectors were outperforming strongly.

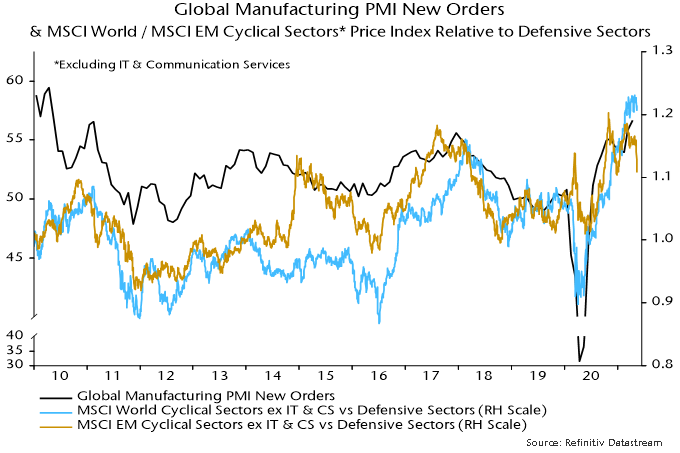
Equity market behaviour, therefore, appears to have started to discount a PMI roll-over, although confirmation is required – in particular, a breakdown in the price relative of MSCI World non-tech cyclical sectors to defensive sectors.

A sign that this could be imminent is a recent sharp fall in the non-tech cyclical to defensive sectors relative in emerging markets – chart 3. A possible interpretation is that the decline reflects worsening Chinese economic prospects, with China likely to be a key driver of a global slowdown. Early Chinese monetary policy easing may be required to mitigate this drag and lay the foundation for a resumption of cyclical outperformance.

Chart 3

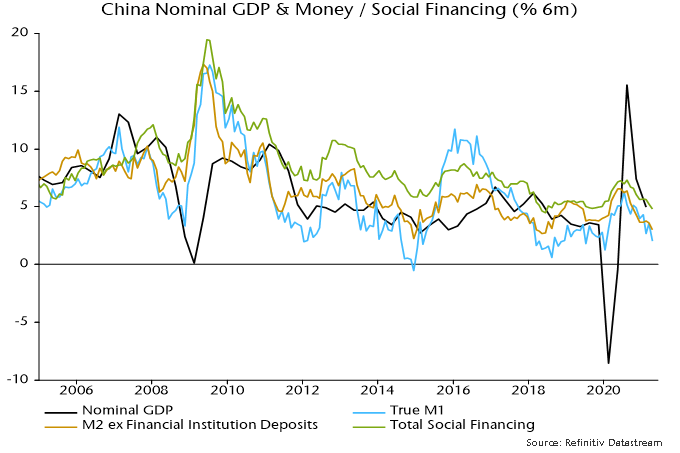
Chinese money trends continue to give a negative message for economic prospects. The PBoC could be moving towards easing policy despite a surge in producer price inflation.

Monthly changes in money and lending aggregates were notably weak in April. Six-month growth rates of narrow money, broad money and broad credit fell again, sustaining a downward trend since Q3 2020 – see chart 1.

Chart 1

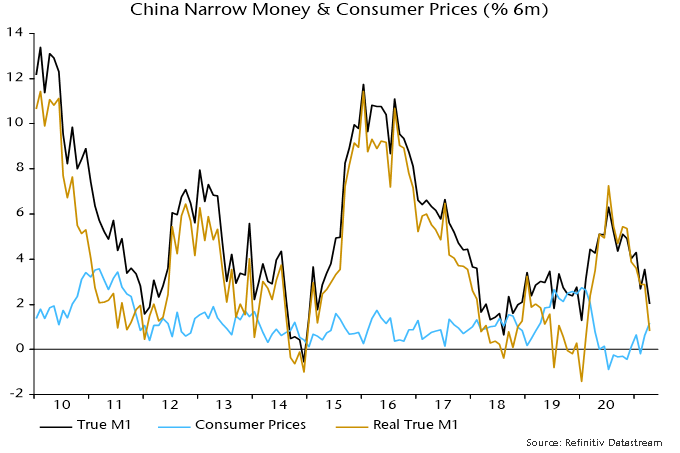
Trends are weaker in real terms because of a recovery in six-month consumer price inflation. Six-month real narrow money growth is the lowest since February last year – chart 2.

Chart 2

The monetary slowdown was the basis for a forecast that the economy would lose momentum in H1 2021. Q1 GDP growth was below consensus and PMIs have moderated since late 2020. Further monetary weakness suggests that that the slowdown will extend through Q3, at least.

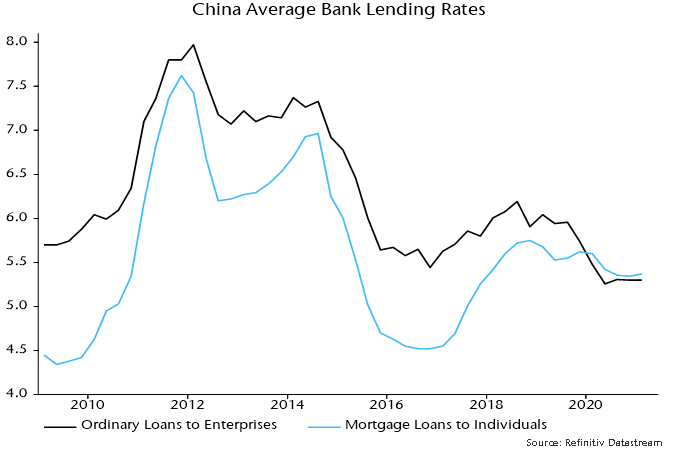
There is little reason to expect money / credit trends to revive. Average interest rates on bank loans have moved sideways since Q3 2020 – chart 3. The PBoC’s Q1 bankers’ survey reported a fall in loan approvals, consistent with a decline in the Cheung Kong Graduate School of Business corporate financing index – weaker readings imply less favourable credit conditions.

Chart 3

The expectation here was that the PBoC would reverse its H2 2020 policy tightening in response to softer economic data and an ongoing money / credit slowdown. The central bank, however, was concerned about housing market strength in early 2021 and withdrew liquidity to reverse a decline in money market rates into late January.

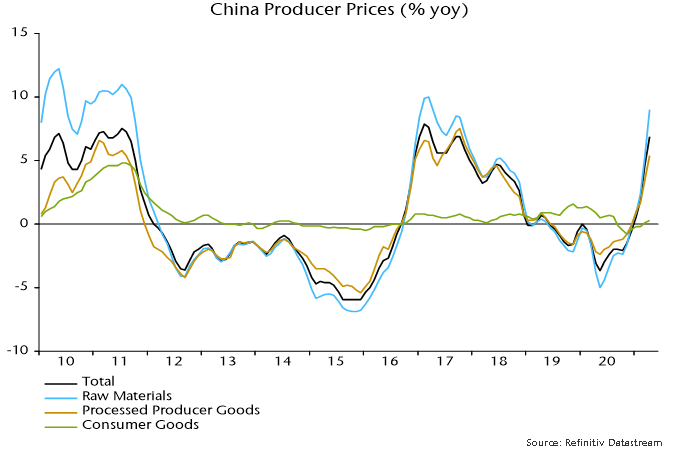
Many continue to expect the next PBoC move to be a tightening, a forecast seemingly supported by a recent surge in producer price inflation. The latter, however, has been driven by raw material costs, with little pass-through to date into producer prices of consumer goods – chart 4.

Chart 4

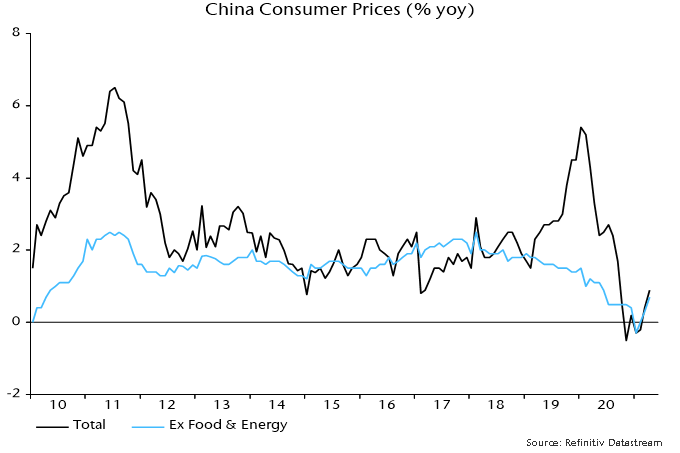
Core consumer price inflation has recovered from early year weakness but remains low – chart 5.

Chart 5

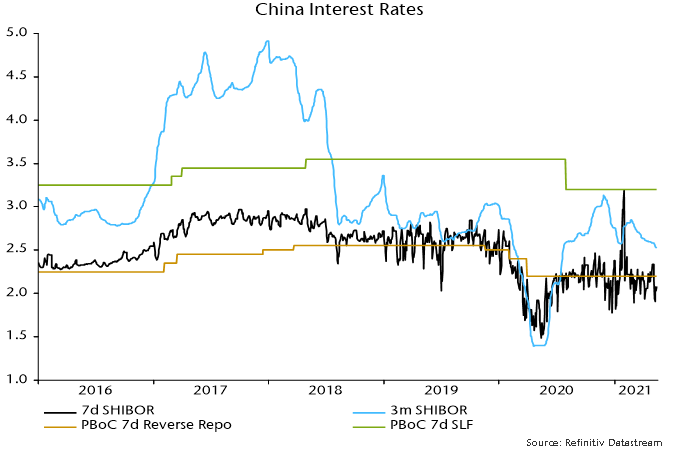
The weak April money / credit numbers could be the trigger for a PBoC rethink. Three-month SHIBOR has been allowed to drift slightly below its January low – chart 6. A further decline would support the view that a policy shift is under way.

Chart 6

On April 22 and 23, 2021, United States (US) President Joe Biden convened 40 world leaders for a virtual Leaders Summit on Climate, to rally the world in combatting the climate crisis.

Many countries announced ambitious new climate targets, ensuring that nations accounting for half of the world’s economy are now committed to the emission reductions needed globally to keep the goal of limiting global warming to 1.5 degrees Celsius within reach. For example:

  • The US submitted a new “nationally determined contribution” (NDC) under the Paris Agreement, setting an economy-wide emissions target of a 50-52% reduction below 2005 levels in 2030. 
    • Japan will cut emissions by 46-50% below 2013 levels by 2030, with strong efforts toward achieving a 50% reduction, a significant acceleration from its existing 26% reduction goal.
    • Canada will strengthen its NDC to a 40-45% reduction from 2005 levels by 2030, a significant increase over its previous target to reduce emissions 30% below 2005 levels by 2030.
    • The United Kingdom will embed in law a 78% greenhouse gas reduction below 1990 levels by 2035.
    • The European Union is putting into law a target of reducing net greenhouse gas emissions by at least 55% by 2030, and a net zero target by 2050.
    • China and Russia also reaffirmed commitments to reduce emissions, and agreed to cooperate with the US on climate change despite division on issues like trade and human rights.

During one of the sessions, Unleashing Climate Innovation, world leaders urged investment in mitigation and adaptation technologies, which include clean fuels such as hydrogen; renewables such as offshore wind and geothermal energy; energy storage; clean desalination; carbon capture; advanced mobility; sustainable urban design; and monitoring technologies to verify emissions and stop deforestation.

At Global Alpha, sustainability is one of our five major investment themes. The energy transition towards a low-carbon society provides long-term growth opportunities. We look for niche market leaders who will benefit from this secular growth trend. A few current holdings include:

  • Clean Energy Fuels (CLNE US), based in the US, designs, builds and operates natural gas filling stations for vehicle fleets. It has 550+ stations in North America. Its primary fuel is Renewable Natural Gas (RNG), the only fuel available for heavy-duty vehicles that can have carbon-negative emissions (RNG avoids more emissions than it generates).
  • Ormat Technologies (ORA US), based in the US, is a leading renewable energy provider globally with a 932 megawatt portfolio. Its business expands from geothermal to recovered energy and energy storage.
  • Hexagon Composites (HEX NO), based in Norway, is a global market leader in a carbon fiber gas containment system used in the transportation industry. It operates in Norway, Germany and the US. Hexagon’s products are mostly used for clean alternatives, such as RNG, hydrogen, and propane.

We also invest in companies related to electric vehicles (EV) and waste management but this week, we would like to profile one of our new holdings, Iwatani Corporation (8088 JP), which is the largest distributor of hydrogen, LPG, and helium in Japan.

Business Overview

Founded in 1930, Iwatani is a leading distributor of gases for industrial and household use in Japan. It has several business areas. The industrial gases segment includes hydrogen, oxygen, nitrogen, helium, semi-conductor material gas and medical gas. The energy segment distributes a wide range of gases such as LPG, LNG, kerosene, and gasoline. The company also manufacturers machinery and environmental-friendly materials, such as biomass fuels, eco PET resin and EV-related battery materials.

Iwatani is the only fully-integrated supplier of hydrogen in Japan, with a nation-wide network, including manufacturing, transportation, storage, supply, and security.

Target Market

Iwatani has a steadily growing product portfolio led by LPG, but the new growth driver is hydrogen.

Japan was the first country to adopt a “Basic Hydrogen Strategy” as early as in 2017. Japan aims to increase the number of fuel cell vehicles (FCVs) to 40,000 units by 2020, to 200,000 units by 2025 and to 800,000 units by 2030. It also aims to increase the number of hydrogen stations to 160 by 2020, to 320 by 2025, and to 900 by 2030.[1]


The Japanese hydrogen market is expected to grow 56-fold to JPY 408.5 billion by 2030, according to the market research company Fuji Keizai.

Competitive Advantages

  • Top market shares in Japan
    • #1 in hydrogen sales volume with 70% market share
    • #1 hydrogen stations network with 33% market share
    • #1 in helium sales with 50% Japan market share, and 8% global market share
    • #1 in LPG sales in the retail market with 4.1% market share
    • #1 in LPG sales in the wholesale market with 13.1% market share
    • #1 in the portable gas cooking stoves market with 80% market share
    • #1 in the cassette gas canisters with 60% market share
  • Close relationship with government as the industry leader
    • High entry barriers: a highly regulated industry because safety is of the utmost importance when handling industry gases.

Growth Strategy

  • Distribution: expand distribution network for hydrogen and LPG
  • Consolidation : 
  • To acquire smaller LPG competitors
  • To acquire companies into its organized Marui Gas network


Management

Akiji Makino has been Iwatani’s Chairman and CEO since 2012. He joined the company in 2000 and has rich industry experience. Insiders own about 16%, including the Iwatani Naoji Foundation.


ESG

Iwatani has been an industry leader in energy transition. Its sustainability report is very comprehensive. Iwatani’s major offices are ISO14001 certified. The company is focused on eco-friendly products and promotes eco-efficient use of energy. At its workplace, Iwatani promotes diversity, employee development, and provides support for child care and nursing care.

Regarding corporate governance, Iwatani has met all the requirements of the Tokyo Stock Exchange. However, at Global Alpha, we apply more stringent requirements in line with western standards. For example, we encouraged the company to have at least one-third of board directors be independent, with a separate board chair and CEO, and at least one female board director.


Risks

  • Delay in the rollout of FCV commercialization ad FC technology development
  • Decline in LPG price
  • Low industrial production

[1] https://www.meti.go.jp/english/press/2017/pdf/1226_003a.pdf

Connor, Clark & Lunn Financial Group, one of Canada’s largest independent asset management firms, announced today the launch of the Connor, Clark & Lunn UCITS ICAV. The initial sub-funds include the CC&L Q Emerging Markets Equity UCITS Fund and the CC&L Q Global Equity Market Neutral UCITS Fund. The investment manager is Vancouver based Connor, Clark & Lunn Investment Management Ltd. (CC&L Investment Management), a team of 100 professionals who manage US$41.7 billion across a range of asset classes.

The CC&L Q Emerging Markets Equity UCITS Fund is an actively managed long-only equity strategy that targets long-term capital growth relative to emerging market equity indices.

The CC&L Q Global Equity Market Neutral UCITS Fund is an actively managed long/short equity strategy that seeks to generate returns that have a low correlation with global equity markets and to maximise long-term total return.

“We have successfully managed quantitative equity strategies for over two decades. Launching UCITS funds for our emerging markets and market neutral strategies allows these strategies to be available to European investors” said Martin Gerber, President & CIO of CC&L Investment Management.

The core of CC&L Investment Management’s investment philosophy is that equity prices are set by the growth, valuation and quality fundamentals of their companies over the long term. However, the market process by which prices accurately reflect these fundamentals is not perfect with a number of behavioral, informational and structural hurdles and frictions that can prevent stock prices from efficiently reflecting these fundamentals. This results in mispricings in the marketplace that offer opportunities to add value. These opportunities are evaluated using a systematic process that objectively assesses each company in relation to CC&L Investment Management’s entire global universe comprised of approximately 16,000 securities, 160 industry groups and 49 developed and emerging countries. The outcome of this daily process is an optimal portfolio that objectively and consistently invests in companies that will provide the best possible return while maintaining disciplined risk management.

“CC&L Investment Management’s experienced team and disciplined approach to investing provide the necessary foundation for success as they expand their product offering into Europe,” said Warren Stoddart, Co-CEO, Connor, Clark & Lunn Financial Group.

The Connor, Clark & Lunn UCITS ICAV is an Irish collective asset-management vehicle constituted as an umbrella fund with segregated liability among sub-funds and managed by Carne Global Fund Managers (Ireland) Limited.  HSBC Global Fund Services is the administrator, registrar, depository, custodian and transfer agent; and Matheson acts as legal advisor as to Irish law.

For additional information on the sub-funds, click here to view the Prospectus, Supplements, and key investor information.

About Connor, Clark & Lunn Investment Management Ltd.

Connor, Clark & Lunn Investment Management Ltd. (CC&L Investment Management) is one of the largest independent partner-owned investment management firms in Canada with US$41.7 billion in assets under management. Founded in 1982, CC&L Investment Management offers a diverse array of investment services including equity, fixed income, balanced and alternative solutions including portable alpha, market neutral and absolute return strategies. CC&L Investment Management is a part of Connor, Clark & Lunn Financial Group Ltd.

About Connor, Clark & Lunn Financial Group Ltd.

Connor, Clark & Lunn Financial Group Ltd. (CC&L Financial Group) is a multi-boutique asset management firm that provides a broad range of investment management products and services to institutional investors, high net worth individuals and advisors. We bring significant scale and expertise to the delivery of non-investment management functions through the centralization of all operational and distribution functions, allowing our talented investment managers to focus on what they do best. With offices across Canada, and in Chicago and London, CC&L Financial Group’s affiliates manage over US$70 billion in assets. For more information, please visit www.cclgroup.com.

Contact

Carlos Stelin
Director, Institutional Sales, Europe
Connor, Clark & Lunn UK
+44 (20) 3535 8107
[email protected]

Connor, Clark & Lunn Financial Group (CC&L Financial Group) is pleased to announce that through the CC&L Foundation, we have pledged $150,000 over three years as part of a partnership with the Centre for Addiction and Mental Health (CAMH).

Through this partnership, CC&L Financial Group becomes a founding member of CAMH’s Business Leaders for Mental Health Action. CAMH’s Business Leaders for Mental Health Action is a community of leaders committed to improving the psychological health and safety of employees and advocating for businesses to take action.

“This partnership aligns with CC&L Financial Group’s overarching health and wellness strategy. We are committed to supporting the health and wellness of both the people who work here and the people in the communities in which we do business,” said Michael Walsh, Managing Director, CC&L Financial Group. “As a firm, we are committed to providing our employees with support and resources to help them manage their mental health.”

The announcement coincided with the launch of CAMH’s Mental Health week, which ran from May 3 – 9, 2021. Mental Health Week aims to shift societal beliefs and perception about mental health and promotes behaviours and attitudes that foster well-being, support good mental health, and create a culture of understanding and acceptance. More information on Mental Health Week can be found at mentalhealthweek.ca.

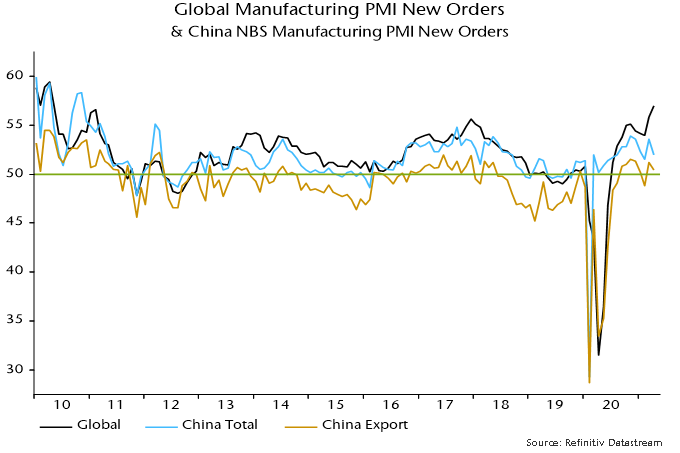
The forecast here at the start of the year was that the global manufacturing PMI new orders index – a key indicator of industrial momentum – would reach a peak in early 2021 and fall into the summer. The index declined slightly between November and February but rose to a new recovery high in March, with flash data last week and today’s Chinese results indicating a further significant increase in April. What has gone wrong?

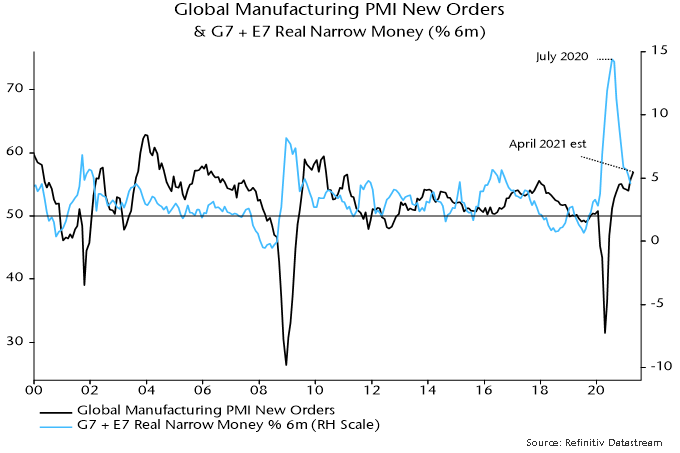
The expectation of an early 2021 peak and subsequent relapse was based on a fall in global six-month real narrow money growth from an extreme peak in July 2020 – real money growth has led turning points in PMI new orders by 6-7 months on average historically. Six-month real narrow money momentum continued to weaken into March, so the monetary signal for PMI direction remains negative – see first chart.

Chart 1

There was meaningful variation around the 6-7 month historical average lead time. An April PMI new orders peak, were it to be confirmed, would imply a nine-month lead, which would be within one standard deviation of the average. So the further rise into April is not yet an unusual departure from the norm.

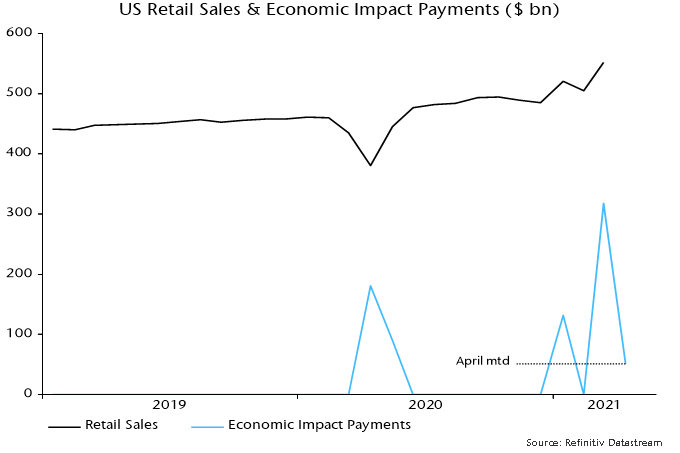
The most likely explanation is that the PMI upswing has been extended by US fiscal stimulus – particularly the third round of payments to households – along with initial moves towards economic reopening in the US, UK and other countries showing progress in virus containment. A 9.3% monthly surge in US retail sales in March may have been a key driver of stronger March / April new orders.

“Economic impact payments” authorised by the American Rescue Plan Act were $318 bn in March and $51 bn through 28 April for a total $369 bn, representing the bulk of a programme costed at $411 bn by the Congressional Budget Office.

New York Fed analysis of data collected in its monthly survey of consumer expectations indicates that households have spent or plan to spend 25% of the windfall, similar to the proportion in the first and second rounds, with remainder used to increase savings (42%) or pay down debt (34%). Rounding the $369 bn received to date up to $400 bn, this suggests additional consumer outlays of about $100 bn.

Assume that half of this amount is spent on goods, which could be an overestimate given that services account for two-thirds of total consumption. That would suggest additional retail sales – a rough proxy for goods spending – of about $50 bn. Monthly sales jumped by $47 bn between February and March. The suggestion is that the bulk of the boost to goods spending has already occurred and sales will fall back sharply into the summer.

Chart 2

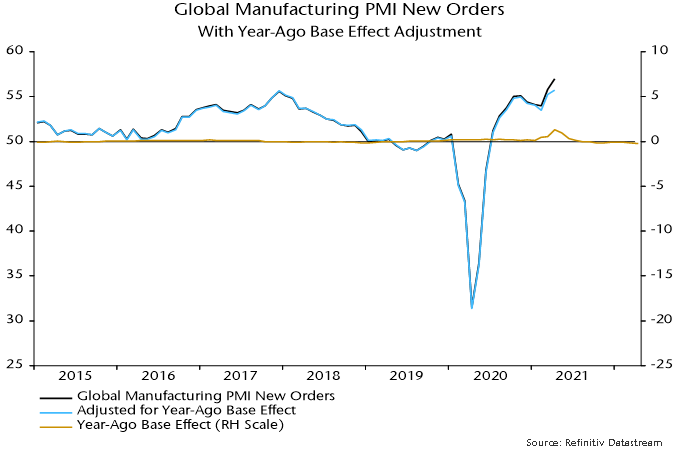
An additional technical explanation for the March / April rise in PMI new orders is a positive base effect from the slump in the index to a low in April 2020. Survey respondents are asked to draw a comparison with the previous month but there is evidence that some replies take into account the level of business in the same month a year earlier – understandable in cases where there is a strong seasonal pattern in demand.

Specifically, a regression of the global manufacturing PMI new orders index on its one- and 12-month lagged values finds a small but statistically significant negative coefficient on the latter*. The coefficient suggests that a 13.7 point plunge in the index in March / April 2020 contributed 0.8 of a point to the estimated 3.0 point increase in March / April 2021 – third chart. This boost will reverse by June, reflecting the recovery in the index after April last year.

Chart 3

With global real narrow money growth still moderating, the US fiscal boost probably passing its maximum and China still on a slow growth path pending PBoC easing, the forecast here of a PMI pullback through late Q3 is maintained.

Chart 4

*The same result is obtained using US ISM manufacturing new orders data over a much longer sample.

Governments around the world are incurring record deficits to sustain their economies during the COVID-19 pandemic. These deficits are expected to persist, as revenue will be needed to rebuild infrastructure and support an aging population.

Benjamin Franklin, the inventor, philosopher, politician, and one of the founding fathers of the United States, famously said: “In this world, nothing can be said to be certain, except death and taxes.” Yet, in 2018, a record year for corporate profits levels, 91 Fortune 500 companies paid no federal income tax; among them, companies such as Amazon, Netflix, Chevron, GM, and Delta.  Even more, their tax rate was -5%, meaning they got a tax refund. The 379 profitable Fortune 500 members paid an effective federal tax rate of 11.3%, almost half of the 21% tax rate established in the 2017 tax revamp. That represented a missing $73.9 billion worth of tax revenue for the federal government. As a result, in 2019, the Organisation for Economic Co-operation and Development (OECD) formally established base erosion and profit shifting (BEPS).

What is BEPS?

BEPS refers to tax planning strategies that exploit gaps and mismatches in tax rules to artificially shift profits to low or no-tax locations where there is little or no economic activity or to erode tax bases through deductible payments, such as interest or royalties. Although some of the schemes used are illegal, most are not. This undermines the fairness and integrity of tax systems because businesses that operate across borders can use BEPS to gain a competitive advantage over enterprises that operate at a domestic level.  Moreover, when taxpayers see multinational corporations legally avoiding income tax, it undermines voluntary compliance by all taxpayers.”

“BEPS is of major significance for developing countries due to their heavy reliance on corporate income tax, particularly from multinational enterprises. Engaging developing countries in the international tax agenda is important to ensure that they receive support to address their specific needs and can effectively participate in the process of standard-setting on international tax.”

The digital economy giants have been very apt at using BEPS. Looking at cash taxes paid globally by FAANG stocks in 2019/2020, according to Global Alpha’s estimates, Facebook paid 12.75%, Apple 14.4%, Amazon 7%, Netflix 7.3%, and Google 11.9%. As an example of BEPS, Google declared $23 billion in revenues in Bermuda in 2017. Until 2015, Amazon was able to declare all its European revenues in Luxembourg.

The significant tax drag caused by these large multinationals was a major issue in negotiations over tax reforms at the OECD, since they were largely US corporations. The stalemate brought many local governments, such as Australia, the United Kingdom (UK), and France, to impose a local tax based on revenues earned in their respective country. That brought retaliation from the US by taxing imports from these countries.

This graph shows that in the 1970s, the largest corporation paid slightly higher tax rates than smaller ones. By the early 80s, the situation reversed, and the unfair advantage of larger companies has amplified since.

Why should we care? The tax system encourages businesses to consolidate and grow bigger. With a risk, they may abuse their market dominant position. The discussion until recently was concentrating on anti-trust measures. Companies like Amazon, Google and Facebook are currently being investigated by various government entities using anti-trust laws. As the case against Microsoft in 2001 demonstrated, it is hard to win a case against multinationals as current anti-trust regulations focus on the price paid by consumers. Anti-trust cases are overly complex and may take years before reaching a conclusion. Studies show that a minimum corporate tax would be a more effective way to ensure fairness and stable government revenues.

In the last few weeks, US President Joe Biden and his secretary of the Treasury, Janet Yellen, former Federal Reserve chairwoman, have proposed an ambitious plan to arrive at a global framework on taxation, which would stop the race to the bottom and allow countries to fund their needed services to their population.

The Biden tax plan includes the following proposed business tax changes:

  • Increase the corporate income tax rate, from 21 to 28 percent.
    • Create a minimum tax of at least 15% on corporations with book profits of $100 million or higher.
    • Double the tax rate on global income earned by subsidiaries of U.S. firms, from 10.5 percent to 21 percent.

Immediately, countries around the world, like France, Canada, Germany, Japan and many others, welcomed the idea. President Biden went further in supporting the idea of a local tax based on local revenues. There is a high likelihood that OECD negotiations may finally reach a new global tax accord by the end of this summer.

What would be the impact on stock markets?

First, we think the large cap US benchmarks would be most negatively affected, as they incorporate most of the large digital companies, which as explained above, have been the biggest users of BEPS.  The S&P500 sells at a record price-to-sale ratio and at an extremely high 24x 2021 earnings.  Increasing the tax on these earnings by 25% would mean a ratio above 30 times, which is unprecedented. That compares with a ratio of 17 times for the MSCI EAFE index (ex: North America).

Smaller companies, as discussed, pay a much higher tax rate. The impact of revised tax rates will be much smaller.  The MSCI EAFE small-cap index sells at 17.9 times 2021 earnings. In addition, the MSCI World small-cap index, which includes the US and Canada, sells at 18.8 times 2021 earnings. The impact should be less for smaller companies, which should drive outperformance. Another aspect that we should mention is the increased importance of ESG in investment decisions.

The environmental impact and carbon footprint of companies is now an important topic for investors. We believe that aggressive tax planning and avoidance may very soon become another important factor that investors may look at.

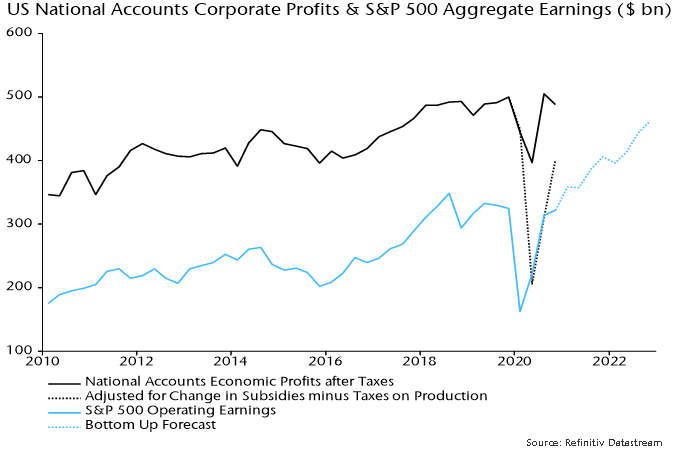
The consensus has swung from pessimism about prospects for corporate profits in 2020 to likely excessive optimism now. Analysts, in particular, may underappreciate the contribution to recent profits resilience of government subsidies, withdrawal of which may offset much of the benefit of economic normalisation.

Posts here last year suggested that global profits would mirror V-shaped rebounds in retail sales and industrial output. S&P 500 aggregate operating earnings are likely to have risen above their pre-pandemic peak in Q1 2021, based on results to date and analyst estimates, according to S&P. Analyst forecasts imply growth of 29% between Q1 and Q4 2022 – see first chart.

Chart 1

S&P 500 operating earnings are equivalent to about 60% of corporate post-tax economic* profits in the national accounts and the two series follow a similar path. An attribution analysis, however, is available for the national accounts measure, allowing the recent contribution of higher subsidies and reduced taxes on production to be separated out.

As of Q4 2020, national accounts profits were 2.4% below their pre-pandemic peak in Q4 2019. If subsidies / production taxes had remained unchanged, the shortfall would have been 19.8%. Put differently, the rise in subsidies accounted for 17.8% of the level of profits in Q4 2020.

This direct contribution of government to profits will normalise as the economy reopens and emergency programmes are withdrawn. Assuming that the rise in subsidies since Q4 2019 is reversed, “underlying” profits – excluding the recent additional support – would need to grow by 21.7% from their Q4 2020 level to maintain overall stability. The consensus forecast of a 29% increase in S&P 500 operating earnings between Q1 2021 and Q4 2022, therefore, could require underlying growth of more than 50%.

Data later this week will show that GDP almost regained its pre-pandemic level in Q1 2021 and the FOMC’s median projection implies a further increase of more than 8% by Q4 2022. Adding in inflation at 2-3% pa suggests nominal GDP growth of about 13% – unlikely to support profits expansion of 50%.

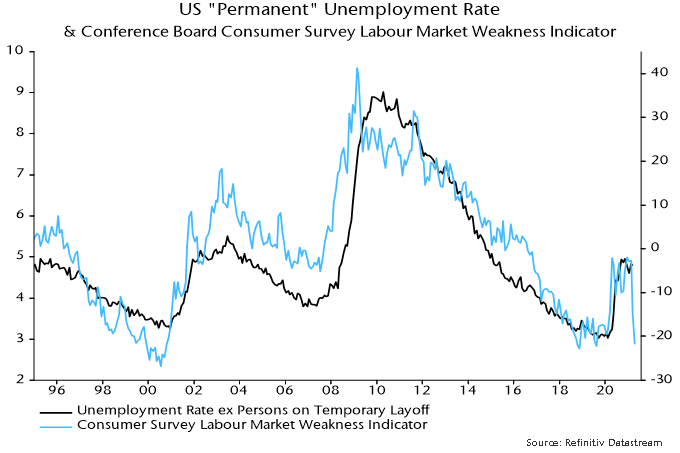
Profit margins, indeed, could be squeezed by rising labour costs. The view here has been that the labour market would return to pre-pandemic levels of tightness by late 2021, resulting in upward pressure on wage growth. Labour market responses in the April Conference Board consumer survey support the view that conditions are normalising rapidly – second chart.

Chart 2

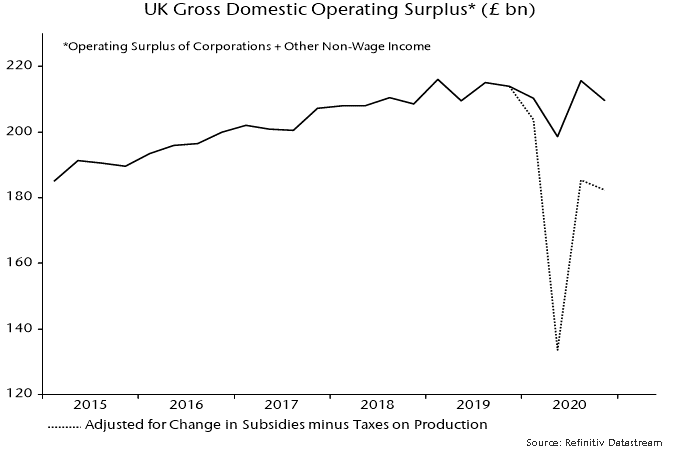
National accounts data for other G7 countries are less detailed / timely than for the US but government subsidies are likely to have provided similar or larger-scale support for profits. In the UK, the economy-wide gross operating surplus** would have been 13.0% lower in Q4 2020 without additional government subsidies / lower production taxes – third chart. The extra support amounted to 5.0% of GDP in Q4, double the equivalent in the US, reflecting the “generosity” of the UK’s furlough scheme.

Chart 3

*”Economic” = including inventory valuation and capital consumption adjustments.
**This is not comparable with the US national accounts profits measure – it is gross of depreciation, interest and income taxes and includes non-corporate business income.