The surge in global broad money last spring and summer was expected here to result in a major inflation rise in 2021-22. A post in September presented reasoning supporting a forecast of 4-5% average G7 inflation in the two years to Q4 2022.
Recent data appear consistent with this forecast but monetary developments suggest that medium-term inflation risks are diminishing.
The latter assessment rests on three considerations. First, six-month growth of global (i.e. G7 plus E7) broad money has moved back towards its pre-pandemic pace. Growth was 4.2% in April, or 8.6% at an annualised rate, versus an average increase of 6.6% pa in the 10 years to end-2019.
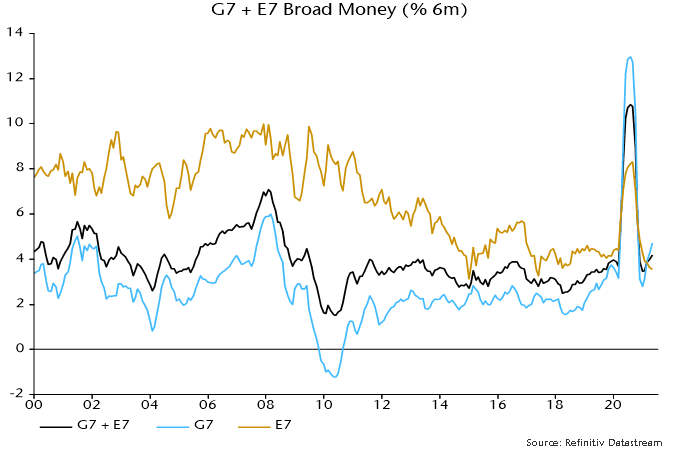
G7 broad money growth remains elevated relative to the 2010s but E7 growth is at the bottom of its range, with Chinese weakness a key driver – see chart 1.
Chart 1
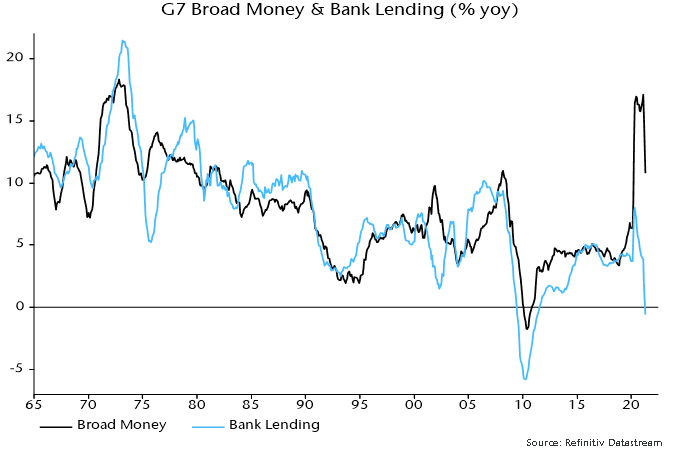
Secondly, G7 bank loans to the private sector have contracted following a brief spurt last spring, contrary to forecasts that government guarantee programmes and central bank incentives would spark a lending boom – chart 2.
Chart 2
Sustained high inflation in the 1970s reflected strong broad money growth driven by bank lending. Last year’s money surge, by contrast, was due to monetary financing of ballooning fiscal deficits and additional QE.
Bank lending is a coincident / lagging economic indicator and is likely to revive as economic activity continues to recover. “Excess” household and corporate liquidity, however, may delay and / or damp a pick-up in credit demand, while the impact on broad money may be neutralised by reduced monetary deficit financing / QE as fiscal positions improve and central banks taper.
A third reason for thinking that monetary inflation risks may have diminished is that a portion of the excess liquidity created last year has been absorbed – at least for the moment – by higher asset prices.
A simplistic quantity theory approach posits that the demand to hold money varies proportionately with nominal GDP. Money, however, is held as a store of wealth as well as to support transactions in goods and services.
Posts here last year described a modified quantity theory model in which nominal GDP and gross wealth have equal roles in driving broad money demand, with an additional impact from real bond yields. This model is consistent with G7 data over the last 50+ years and explains the secular decline in conventionally-defined broad money velocity as a consequence of a rising trend in the ratio of wealth to GDP and a fall in real bond yields.
The current stock of G7 broad money is 20% higher than at end-2019. G7 gross wealth – i.e. the aggregate value of equities, bonds and stocks – is also up by about 20% since then, while real bond yields, on the measure calculated here, are little changed. According to the model, the rise in wealth will have boosted broad money demand by 10%. So markets may have “absorbed” about half of the additional liquidity created since end-2019, implying a smaller excess to be reflected in goods and services prices.
The implication of the model that buoyant asset prices are disinflationary is controversial – it suggests, for example, that inflation prospects would worsen if markets were to crash. That was, however, the experience following the GFC – G7 inflation rose sharply in 2010-11 after the 2008-09 collapse in asset prices. High inflation in the 1970s was associated with weak markets, with equities volatile but directionless and a trend decline in bond prices.
The suggestion that the medium-term inflation outlook has improved at the margin is based on current information and will be revised if any of the inputs discussed above change.
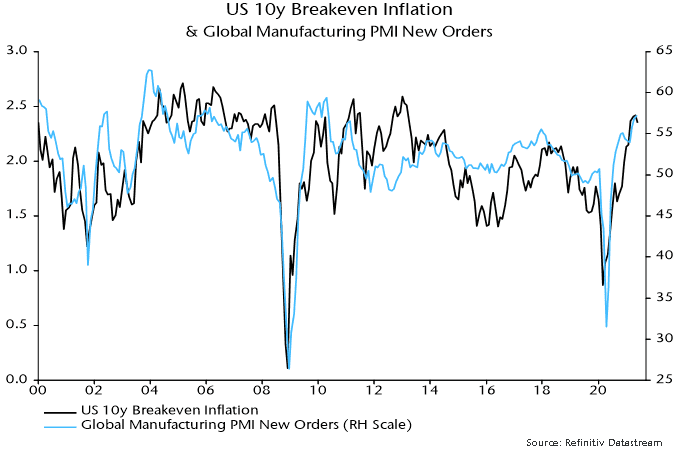
Medium-term inflation expectations in markets are correlated with swings in global industrial momentum – chart 3. The forecast here that the global manufacturing PMI new orders index will decline through late 2021 suggests that expectations will stabilise or moderate near term.
Chart 3
These are the views of the author at the time of publication and may differ from the views of other individuals/teams at Janus Henderson Investors. Any securities, funds, sectors and indices mentioned within this article do not constitute or form part of any offer or solicitation to buy or sell them.
Past performance does not predict future returns. The value of an investment and the income from it can fall as well as rise and you may not get back the amount originally invested.
The information in this article does not qualify as an investment recommendation.
Marketing Communication.
The Connor, Clark & Lunn Foundation (CC&L Foundation) is pleased to announce it has donated $25,000 to the Canadian Red Cross in support of India’s COVID-19 relief efforts. Funds will be directed from the Canadian Red Cross to the Indian Red Cross. The recent surge of COVID-19 cases in India caused a shortage of supplies and a strain on the health care system. Funds directed to the Indian Red Cross support COVID-19 response and recovery activities in India, as well as preparedness and resiliency activities for future pandemic and/or emergency events. Many employees at Connor, Clark & Lunn Financial Group and its affiliates call India home and have family and friends located in the hot spot areas. As the pandemic continues to create various uncertainties during these challenging times, we must continue to support those affected by COVID-19.
About the Connor, Clark & Lunn Foundation
Created in 1999, the CC&L Foundation is supported by CC&L Financial Group and its affiliates and it responds to requests from clients, staff and others to fund programs and not-for-profit organizations that help promote a better environment, improvements to education, advances in science and medicine, stronger communities and the arts.
Inflation has been at the centre of attention recently. The most recent core personal consumption expenditure data release, which excludes food and energy, was at a level not seen in decades. Despite this, the Fed has not acted yet, believing that it is transitory due to a combination of low base level and a challenged supply chain. With the economy transitioning from recovery to stability, and no tapering just yet, commodity prices look set to remain at current high levels. Therefore, the question is: are these current commodity prices also transitory, or are we going to enter a commodity supercycle?
A supercycle is hard to define, but can be generalized as a long-term period, usually greater than 10 years, where commodity prices are above their long-term trend. Supercycles are caused by an event that causes a significant increase in global demand. In natural resources, bringing a significant new supply, such as building a large mine or developing a new oilfield to the market (i.e., not just restarting idle mines or oilfields), can take years.
In the last century, there have been three commonly identified supercycles. The most recent was caused by the rapid industrialization of China that consumed raw materials at a pace that oil producers and miners could not keep up with. Before that, there was the oil crisis of the 1970s, which caused an increase in production costs for other commodities, hence lifting their prices. The third was related to rebuilding infrastructure after the Second World War.
Those who believe we are entering a supercycle point to governments needing to focus on job creation and stimulus post-Covid-19, rather than fiscal responsibility in the wake of the great financial crisis. They point to commodity-heavy infrastructure spending and green projects, such as the $2.3 trillion American Jobs Plan and Europe’s Green New Deal as evidence of this. Another reason why we could be heading for a supercycle is the lack of new or expansion projects that could respond to an increase in demand. Each supercycle is followed by an equally long period of low prices as demand wanes and new supply emerges. Recent years of low commodity prices have meant producers have spent less on exploration and production.
A contrasting opinion is that these commodity prices are more of a spike than entering into a new supercycle, with the recovery and fiscal response being the cause for the increase in commodity prices; this opinion is shared by the Fed. They believe this is not the structural change in demand needed for a supercycle and any increase in demand from the green energy transformation will be offset by slowing growth coming from China. Rather, they foresee sustained rallies in certain commodities more highly correlated to energy transition or electric vehicles and a limited new supply, such as copper, cobalt, nickel, lithium, and some rare earth metals.
Whether this is a short-term spike for commodity prices, or the start of another supercycle, Global Alpha has a diversified commodity exposure across its portfolios.
Westgold (WGX:AU) owns and operates three mining centres in Western Australia, a very favourable mining jurisdiction. These three operations have a throughput capacity of over 4 million tonnes per annum production capacity. The potential upside to throughput will come from the Big Bell mining operations, where production is set to go from 250,000 oz per annum to a long life 300,000 oz per annum average. Westgold has a solid balance sheet and will generate strong free cash flow as the company moves from an intensive capital spending phase.
Alumina (AWC:AU) is a leading Australian resource company with a specific focus on alumina, the feedstock for aluminum smelting. Alumina owns 40% of the world’s largest alumina business, Alcoa World Alumina and Chemicals (AWAC) JV with Alcoa. AWAC assets include bauxite mines and alumina refineries in Australia, Brazil, and other countries. AWAC also owns a 55% interest in an aluminum smelter in Australia. AWAC is the world’s largest producer of alumina and has a low position on the bauxite and alumina cost curves.
Aurubis (NDA:GY) is a leading integrated copper group and the largest copper recycler worldwide. The company produces over 1 million tons of copper cathodes per year, and from them a variety of copper products. Aurubis also produces precious metals, lead, nickel, tin, and zinc among other metals, as well as additional products, such as sulfuric acid. Aurubis has production sites in Europe and the United States.
Rayonier (RYN:US) is the second-largest timber REIT, with approximately 2.7 million acres located in strong softwood timber growing regions throughout the United States, primarily in the south with some operations in the Pacific Northwest, and New Zealand. What differentiates Rayonier is that they are a pure timber play – they do not own any pulp, paper or wood manufacturing operations.
Osisko Gold Royalties (OR:CN) is the fourth-largest precious metal royalty company in the world, with a North American focused portfolio of over 140 royalties, streams, and precious metal offtakes. Their main asset is a 5% net smelter return royalty on the Canadian Malartic mine, the largest gold mine in Canada. Osisko enjoys a diversified cash flow from 17 producing assets in low geopolitical risk jurisdictions.
Limoneira (LMNR:US) is one of the largest growers of lemons and avocados in the United States. In addition, the company grows oranges and a variety of specialty citrus and other crops. Demand for fresh citrus continues to grow steadily, driven by a growing middle class with disposable income and changing consumer preferences. Limoneira is vertically integrated due to its packing facilities, and its real estate portfolio could be another source of realizing value for shareholders.
Eagle Materials (EXP:US) is a leading supplier of heavy construction materials, such as cement, concrete and aggregates, and light building materials, such as gypsum wallboard in the United States. The company is a low cost producer, with between 30 and 50 years of raw material reserves. The majority of Eagle’s revenues are generated in markets where population growth, highly correlated to construction activity, is expected to be greater than the United States as a whole.
ARC Resources (ARX:CN) is a leading Canadian oil and gas company with high quality assets in the Montney region. After a merger with Seven Generations Energy, ARC is the Montney leader in production, land base, and condensate output.
Some forecasters expect global industrial momentum to receive a further boost over coming months from a rebuilding of manufacturing inventories. The assessment here, by contrast, is that the growth impact of the inventory cycle is peaking, although major weakness is unlikely until next year.
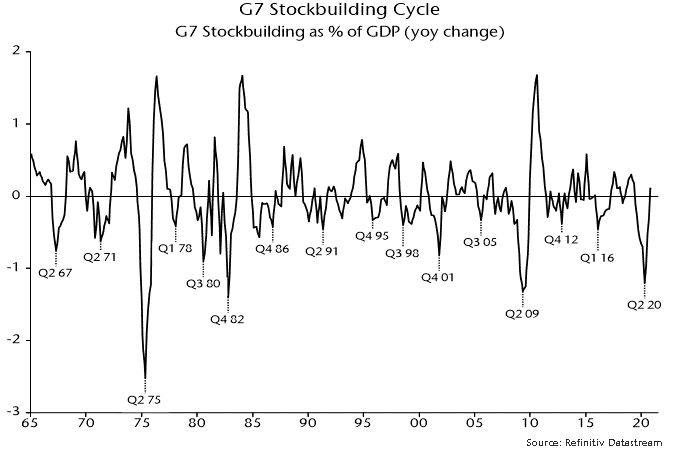
The stockbuilding or inventory cycle, also known as the Kitchin cycle, has an average length of 3.5 years – more precisely, 40 months – and is a key driver of overall economic activity and market behaviour. The history of the cycle is illustrated in chart 1, showing the contribution of stockbuilding to G7 annual GDP growth.
Chart 1
The cycle bottomed in April 2020, suggesting that the next low will occur around August 2023, based on the average 40-month length. This, in turn, would imply a cycle mid-point around December 2021 – seemingly supportive of the consensus view that that the growth impact of the cycle will remain positive in H2 2021.
There are three reasons, however, to doubt this interpretation.
First, the cycle usually peaks early after deep recessions. The maximum growth contribution topped out within five quarters after the 1975, 1982 and 2009 recessions, suggesting a current peak by Q3 2021.
Secondly, the current cycle could be shorter than average to compensate for a 50-month previous cycle, which was extended by covid shock, i.e. the current cycle could compress to 30 months, implying a mid-point around July 2021.
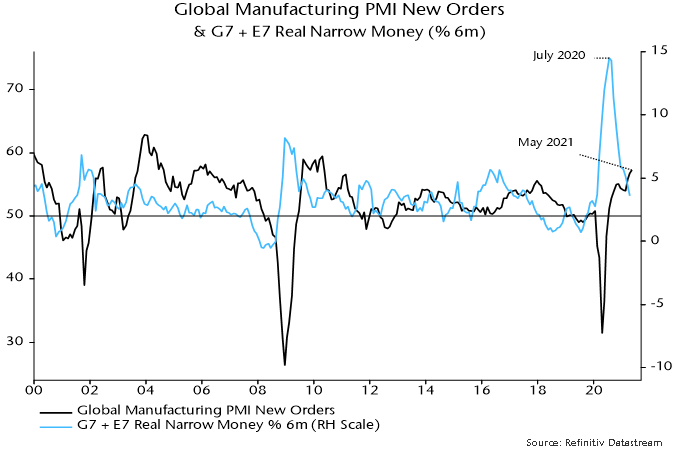
Thirdly, cycle peaks are signalled in advance by slowdowns in global real narrow money. Six-month growth of real money peaked in July 2020, with annual growth topping in January 2021.
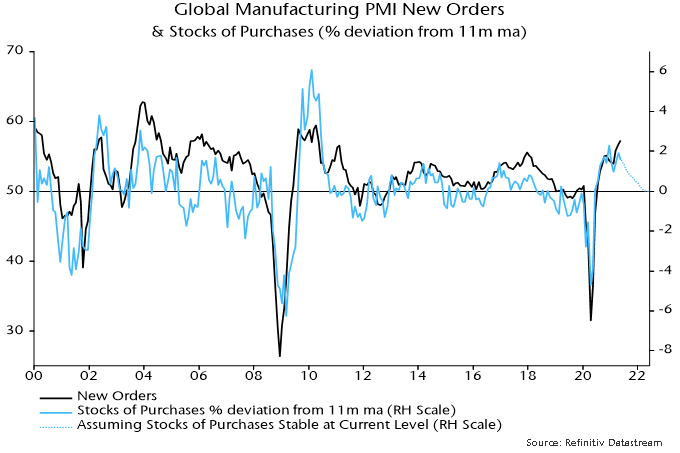
The view that the cycle will deliver a further significant boost is based partly on the low level of the global manufacturing PMI finished goods inventories index. However, the stocks of purchases index, covering intermediate goods and raw material inputs, is near the top of its historical range – chart 2.
Chart 2
Growth of new orders and output is related to the rate of change of stockbuilding. This is illustrated in chart 3, showing a significant correlation between the PMI new orders index and the deviation of the stocks of purchases index from a moving average.
Chart 3
This rate of change measure has already peaked and will decline further even if the stocks of purchases index maintains its current high level, as shown by the dotted line on the chart. For this not to occur, the index would have to continue to rise by 0.25 points per month, implying a move through its record high during H2.
Will the drag on new orders from a stabilisation or decline in the rate of increase of intermediate goods / raw material stocks be offset by faster accumulation of finished goods inventories. The assessment here is that the net effect will be negative, based on two considerations.
First, there has been a stronger historical correlation between new orders and the rate of change measure for intermediate goods / raw material stocks than the corresponding measure for finished goods inventories.
Secondly, the maximum correlation is contemporaneous for the former measure but incorporates a three-month shift for the finished goods inventories measure, i.e. finished goods inventories lag new orders by three months. So a rise in this measure over June-August would be consistent with a May peak in new orders.
The view here remains that the PMI new orders index will weaken through late 2021, based on the fall in global six-month real narrow money growth between July and April – chart 4. An early estimate of real money growth in May will be available later this week, assuming release of Chinese numbers.
Chart 4
A Herbal Renaissance
COVID-19 has been a stark reminder of human mortality, particularly in the countries where we invest. Poor health infrastructure, strained fiscal resources, and the large informal labour market are just some of the factors magnifying its profoundly negative impact. It is easy to forget our privilege as we sit at our home offices with Amazon orders keeping the doorbell busy and fresh food only a phone tap away.
The notion of immortality has fascinated humans for millennia. Since the scientific revolution, death has become a technical challenge over a divine one[1]. Medical and societal advances have lifted global life expectancy from 46 to 72 years in the space of five decades[2]. Humans today are looking to live better for longer. In his book Homo Deus, Yuval Noah Harari talks at length on immortality, proposing enhanced-sapiens as the next evolution of our species. Once we satiate our consumption needs and wants, which have their respective ceilings, what is next? Whilst advances in genomics, artificial intelligence and prosthetics are given the most attention, what is more immediately relevant, and more accessible for the majority, are incremental life adjustments and new habit formations in day-to-day life.
“Having raised humanity above the beastly level of survival struggles, we will now aim to upgrade humans into gods, and turn Homo sapiens into Homo deus.” – Homo Deus, Yuval Noah Harari
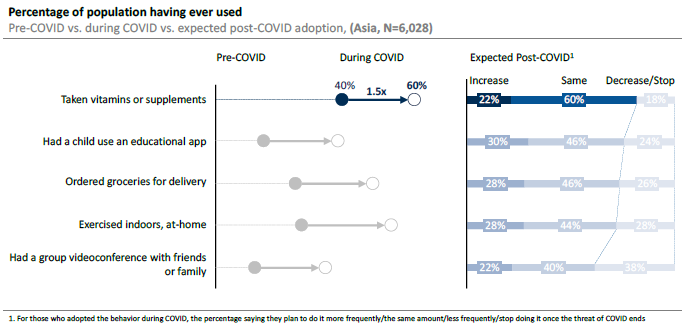
The pandemic appears to have accelerated the pursuit for healthier and better living, evident by an uptick in demand for better-for-you products, vitamins and supplements[3]. The global supplements market is estimated to be worth over $170 billion with the herbal sub-segment contributing $7.5 billion[4],[5]. The segment has grown on the back of heightened health and wellness considerations, enhanced expression of values in purchase behaviour and greater industry commercialisation. In developed countries, having saturated the margins of society, herbal and alternative medicines are now intertwined with more conventional Western practices. The ‘herbal influence’ is certainly visible in the fast-moving-consumer-goods (FMCG) industry, yet it is geared towards the premium end of the market. We believe this speaks to the idea that ‘herbal’ has, to some extent, become a heuristic cue for premium.
Vitamin and Supplement Consumption in Asia
We see a different picture in developing countries. In Asia specifically, we have witnessed more democratised consumption of herbal products and supplements as entrepreneurs, brand owners and even spiritual leaders have taken to formalising traditional remedies[6].
Source: L Catterton Asia Consumer Survey 2021
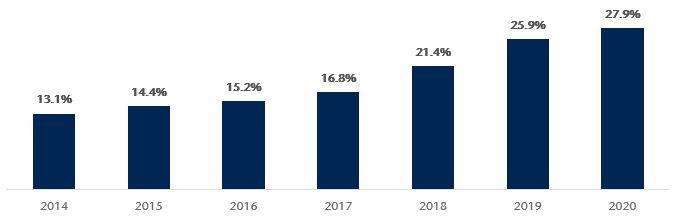
India is home to one of the best examples of this, with the modernisation and commercialisation of Ayurveda, an alternative medicine system, in everyday FMCG products[7]. Against the backdrop of rising Hindu nationalism and a democratisation of route-to-market accessibility, both local (Dabur, Himalaya, Emami, Marico and Patanjali) and multinational corporations (Nestle, Colgate, Unilever) have capitalised upon this structural trend. India has seen a culmination of factors, which together have propelled the segment to over $5 billion, with 76% of Indian households using Ayurvedic products for personal and health care needs[8]. COVID-19 has accelerated the growth of the Ayurvedic segment, not only for edible categories but also home and personal care items. India’s Health and Welfare Ministry even issued guidelines for recovering COVID-19 patients that included the consumption of Ayurvedic products.
Ayurvedic FMCG Products
Colgate is one of the many multinational brands that have capitalized on the growth in Indian alternative medicine market
In Indonesia, a market where we are invested, we have witnessed a similar trend. Increasingly consumers are allocating their marginal dollars to modern and branded versions of traditional remedies as well as products that more closely align with their religious and cultural identities.
Much like Ayurveda in India, Jamu is an ancient and indigenous form of care. It predicates that if ailments come from nature, their cure should too. Jamu comprises of a blend of tonics, ointments, oils and pills made from ginger, turmeric, tamarind, honey and other local spices found on the 17,000 island archipelago. Indonesians believe that these concoctions strengthen the immune system and serve as both a preventative and remedial solution to common illnesses. Historically, it was sold in traditional outlets, mainly by elder women (Jamu Gendong), sometimes in unhygienic conditions. According to the Ministry of Health, the Jamu industry is worth $2.7 billion and is consumed regularly by 49% of the 260 million population[9]. In contrast to Ayurveda however, Jamu has yet to benefit from the same global exposure, without a dedicated evangelist (see Baba Ramdev of Patanjali[10]) or full integration into mass market FMCG.
Conventional wisdom stipulates that Jamu is primarily consumed by elder generations, with younger, cosmopolitan consumers generally aspiring to international lifestyle products and wellness solutions[11]. What we have seen recently however, is a renewed interest in these traditional and herbal products as part of a longer-term trend. Jamu Cafes and Bars have emerged in Jakarta and there are dozens of companies that incorporate Jamu into both their edible and inedible products. The pandemic has also supported Jamu’s revived popularity amongst Indonesians[12]. President Joko ‘Jokowi’ Widodo publicised his morning Jamu routine and Dr. Chairul Anwar Nidom, Airlangga University, suggested drinking Jamu could boost immune systems. It seems as though global trends coupled with strong inherited tradition is leading to the growth of this budding industry.
Capitalising on the opportunity
One beneficiary of this herbal renaissance is our portfolio company, Sido Muncul (SIDO), a leading producer of herbal supplements in Indonesia. SIDO has built a business in modernizing a family recipe dating back to 1941; building a brand that now captures over 70% of its market. The company’s flagship product Tolak Angin is mainly used to treat ‘Masuk Angin’, a local ailment, but it is also taken to boost immunity[13]. Masuk Angin is not a medical term, but instead a colloquial term for the collective feeling of fever, chills, muscle ache and discomfort associated with the onset of what Westerners would call a cold. Its general applicability implies Tolak Angin is not limited to solving a single symptom, therefore use cases are plentiful.
The company is run by a professional team of third generation family members (who own 60%), complemented by seasoned executives in sales, distribution and finance. Regional Private Equity (PE) firm Affinity Partners took a stake in January 2018, and now hold 21% in the listed business. Affinity have supported management, whose natural strengths are in sourcing and production, by adding expertise in finance and logistics.
Sido Muncul Flagship Product – Tolak Angin
Source: Company
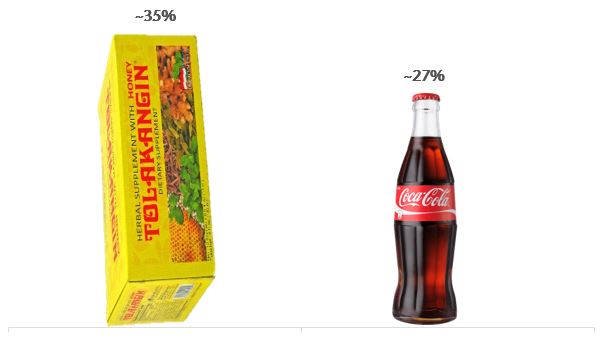
What is most striking (and attractive) about SIDO is the phenomenal margins it generates on Tolak Angin (+75% gross profit margins) which leads to a company level profitability profile that is far superior to even that of Coca Cola. Just like Coke, Tolak Angin has ultimate pricing power in its category and that is reflected in an approximate 20% premium on a per unit basis compared to its competitors. Unlike Coke, Tolak Angin does not have a strong second competitor and enjoys the benefits of being in a category that multinationals have found difficult to crack.
Operating Margin Comparison
Source: Bloomberg and Vergent analysis
Return on invested capital more than doubled in the last six years as a result of SIDO scaling up manufacturing, optimising distribution, and making good capital allocation decisions. This has led to substantial free cash flow generation which management has been progressively paying out in dividends.
Return on Invested Capital (%)
Source: Vergent analysis
Despite the impressive revenue and profit margin performance to date, we see more growth for SIDO ahead. The company is now building on demand in the East of the country where per capita consumption is one quarter of that in Greater Jakarta. In addition, management have outlined an export strategy focused on the Philippines, Nigeria, Malaysia and Saudi Arabia where its products have an existing following. Building on the strength of the brand, the company is launching new higher value-added products through new formulations, formats and flavours. On the margins side, we see scope for further efficiency gains as factory utilisation improves, raw material pricing is standardised and the as innovation pipeline of high value products comes to market.
These materials (“Presentation”) are presented by Vergent Asset Management LLP <(“Vergent”)>. This Presentation is furnished on a confidential basis for informational and illustration purposes only. This Presentation is intended for the use of the recipient only and may not be reproduced or distributed to any other person, in whole or in part, without the prior written consent of Vergent.
Vergent Asset Management LLP is registered in England and Wales with its registered office address at 8th Floor, 1 Knightsbridge Green, London SW1X 7QA, United Kingdom (Companies House number OC418829) and is authorized and regulated by the Financial Conduct Authority (FRN: 791909).
This financial promotion is issued by Vergent Asset Management which is authorized and regulated by the Financial Conduct Authority (‘FCA’). Past performance is not indicative of future results. The value of your investment may go down as well as up and you may not receive upon redemption the full amount of your original investment.
THE PERFORMANCE PRESENTED HEREIN IS NOT INDICATIVE OF FUTURE RESULTS. The performance results contained herein are for informational purposes only, and are not meant to imply that Vergent’s trading programs will produce results similar to the performance results contained herein. There can be no assurance that Vergent or any account or product advised thereby will or is likely to achieve any results shown. There can be no assurance that such trading programs will make any profit at all or will be able to avoid incurring substantial losses. No representation is made that Vergent’s investment processes or investment objectives will or are likely to be successful or achieved.
Certain information contained in this Presentation is based on information obtained from third-party sources that Vergent considers to be reliable. However, Vergent makes no representation as to, and accepts no responsibility for, the accuracy, fairness or completeness of the information contained herein. The information is as of the date indicated and reflects present intention only. This information is subject to change at any time, and Vergent is under no obligation to provide you with any updates or amendments to this Presentation. The information contained in this Presentation is not complete and does not contain certain material information about the trading programs described herein, including important risk disclosures. Accordingly, this Presentation must be read in conjunction with, and is qualified in its entirety by, such other disclosure documentation as may be provided by Vergent from time to time in connection with a prospective investment. An investment in the strategy described herein may not be suitable for all clients, and before allocating any assets to the strategy or strategies, you should thoroughly review the terms and disclosures the strategy and consult with your professional advisor(s) to determine whether an investment in the strategy is suitable for you in light of your investment objectives and financial situation.
This Presentation may contain opinions pertaining to securities, financial products, transactions and investment strategies, and such opinions may differ from one to another. Any opinions, assumptions, assessments, statements, market commentary or the like (collectively, “Statements”) regarding past, current and/or future market conditions, themes, trends or events or which are forward-looking, including regarding portfolio characteristics and limits, constitute only subjective views, beliefs, outlooks, estimations or intentions of Vergent, should not be relied on, are subject to change due to a variety of factors, including fluctuating market conditions and economic factors, and involve inherent risks and uncertainties, both general and specific, many of which cannot be predicted or quantified and are beyond Vergent’s control. Future evidence and actual results could differ materially from those set forth in, contemplated by, or underlying these Statements, which are subject to change without notice. In light of these risks and uncertainties, there can be no assurance and no representation is given that these Statements are now, or will prove to be, accurate or complete in any way. Vergent undertakes no responsibility or obligation to revise or update such Statements. Statements expressed herein may not necessarily be shared by all personnel of Vergent. You acknowledge that you are capable of independently analyzing such Statements and the other information presented herein using your own expertise, due diligence and decision making, and you are solely responsible for any investment decisions made through your use of such Statements or other information and for any and all trading results achieved thereby, whether for your own account or on behalf of your clients.
This Presentation is not an offer to buy or sell, nor a solicitation of an offer to buy or sell any security or other financial instrument, or to invest assets in any account, advised by Vergent. An investment in any account advised by Vergent may be made only by qualified clients after receipt of formal investment management documentation and disclosures from Vergent, and only in those jurisdictions where permitted by law. Vergent’s investment strategies have management fees and operating expenses that would reduce returns to a client. Operating expenses include items such as custodial fees for segregated accounts and for pooled vehicles would also include charges for valuation, audit, tax and legal expenses. Such additional operating
expenses would reduce the actual returns experienced by investors in segregated accounts and pooled vehicles. Any client must be able to bear the risks involved in any potential investment and must meet the suitability requirements relating to its participation in the Trading Programs.
Financial indices are shown for illustrative purposes only, may not be available for direct investment, are unmanaged, assume reinvestment of income, do not reflect the impact of any management or incentive fees and have limitations when used for comparison or other purposes because they may have different volatility or other material characteristics (such as number and types of instruments) than the investment strategies described herein. Vergent’s investment strategies are not restricted to the instruments comprising any one index.
Vergent is not and does not purport to be an advisor as to legal, taxation, accounting, financial or regulatory matters in any jurisdiction. The recipient should independently evaluate and judge the matters referred to in this Presentation.
Net performance figures are stated after estimated management fees and transaction costs but before operating expenses. Operating expenses include items such as custodial fees for segregated accounts and for pooled vehicles would also include charges for valuation, audit, tax and legal expenses.
Third-party data providers
This report may contain information obtained from third parties including: Merrill Lynch, Pierce, Fenner & Smith Incorporated (BofAML), S&P Global Ratings, and MSCI.
Source: Merrill Lynch, Pierce, Fenner & Smith Incorporated (BofAML), used with permission. BofAML permits use of the BofAML indices related data on an “As Is” basis, makes no warranties regarding same, does not guarantee the suitability, quality, accuracy, timeliness, and/or completeness of the BofAML indices or any data included in, related to, or derived therefrom, assumes no liability in connection with the use of the foregoing, and does not sponsor, endorse, or recommend Vergent, or any of its products.
This may contain information obtained from third parties, including ratings from credit ratings agencies such as S&P Global Ratings. Reproduction and distribution of third party content in any form is prohibited except with the prior written permission of the related third party. Third party content providers do not guarantee the accuracy, completeness, timeliness or availability of any information, including ratings, and are not responsible for any errors or omissions (negligent orotherwise), regardless of the cause, or for the results obtained from the use of such content. THIRD PARTY CONTENT PROVIDERS GIVE NO EXPRESS OR IMPLIED WARRANTIES, INCLUDING, BUT NOT LIMITED TO, ANY WARRANTIES OF MERCHANTABILITY OR FITNESS FOR A PARTICULAR PURPOSE OR USE. THIRD PARTY CONTENT PROVIDERS SHALL NOT BE LIABLE FOR ANY DIRECT, INDIRECT, INCIDENTAL, EXEMPLARY, COMPENSATORY, PUNITIVE, SPECIAL OR CONSEQUENTIAL DAMAGES, COSTS, EXPENSES, LEGAL FEES, OR LOSSES (INCLUDING LOST INCOME OR PROFITS AND OPPORTUNITY COSTS OR LOSSES CAUSED BY NEGLIGENCE) IN CONNECTION WITH ANY USE OF THEIR CONTENT, INCLUDING RATINGS. Credit ratings are statements of opinions and are not statements of fact or recommendations to purchase, hold or sell securities. They do not address the suitability of securities or the suitability of securities for investment purposes, and should not be relied on as investment advice.
Source: MSCI. The MSCI information may only be used for your internal use, may not be reproduced or re-disseminated in any form and may not be used as a basis for or a component of any financial instruments or products or indices. MSCI makes no express or implied warranties or implied warranties or representations and shall have no liability whatsoever with respect to any MSCI data contained herein. This report is not approved, reviewed or produced by MSCI.
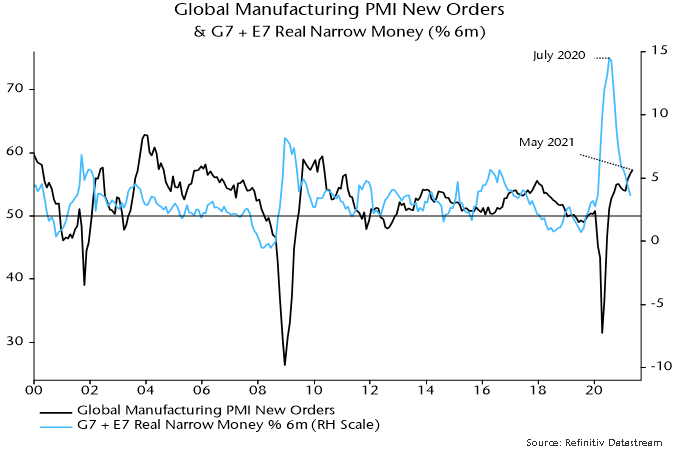
Additional country releases in recent days confirm that global six-month real narrow money growth fell further in April, to its slowest pace since January 2020 – see chart 1. The decline from a peak in July 2020 is the basis for the forecast here of a significant cooling of global industrial momentum during H2 2021.
Chart 1
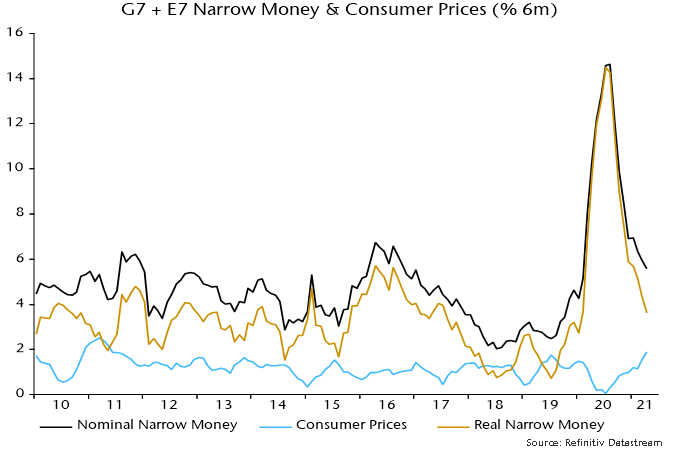
The April fall reflected both slower nominal money growth and a further pick-up in six-month consumer price momentum – chart 2. The latter is probably at or close to a short-term peak and the central scenario here remains that real money growth will stabilise and recover into Q3. The risk is that nominal money trends continue to soften – the boost to US numbers from disbursement of stimulus payments may be over and this year’s rise in longer-term yields may act as a drag.
Chart 2
Six-month growth of real broad money and bank lending also moved down in April, with the former close to its post-GFC average and the latter considerably weaker – chart 3. Forecasts last year that government guarantee programmes would lead to a lending boom have so far proved wide of the mark; monetary financing of budget deficits, mainly by central banks, remains the key driver of broad money expansion.
Chart 3
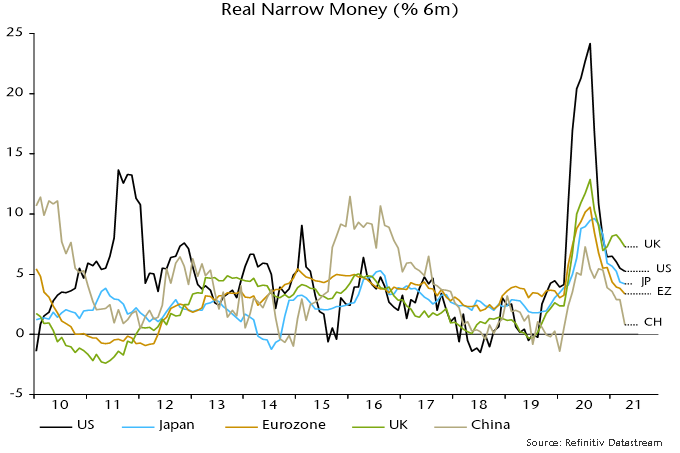
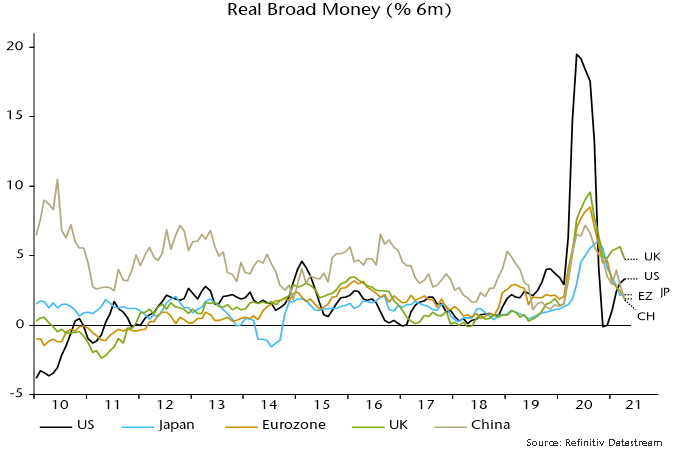
Charts 4 and 5 shows six-month growth rates of real narrow and broad money in selected major economies. The UK remains at the top of the range on both measures, supporting optimism about near-term relative economic prospects, although slowing QE and a sharp rise in inflation promise to erode the current lead.
Chart 4
Chart 5
Eurozone real money growth, by contrast, is relatively weak: monetary deficit financing has been on a smaller scale than in the US / UK, while six-month inflation is higher than in the UK / Japan. Bank lending has been expanding at a similar pace in the Eurozone and UK. The recent step-up in ECB PEPP purchases could lift Eurozone broad money growth although the change is modest and could be offset by an increased capital outflow – see previous post.
China remains at the bottom of the ranges and monetary weakness was expected here to trigger PBoC easing by mid-year. Policy shifts usually proceed “under the radar” via money market operations and directions to state-run banks. The managed decline in three-month SHIBOR continued this week, while the corporate financing index in the Cheung Kong Graduate School of Business survey stabilised in April / May after falling over October-March, which could be a sign that banks have been instructed to increase loan supply.
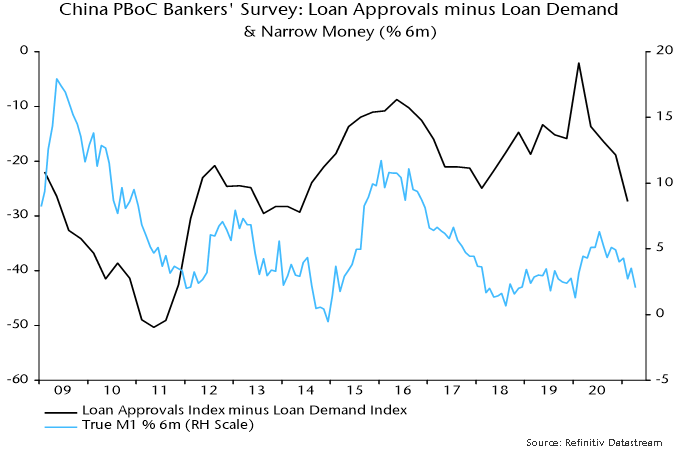
The PBOC’s quarterly bankers’ survey, due for release later this month, could provide further corroboration of a policy shift: the differential between loan approval and loan demand indices leads money growth swings – chart 6. Monetary reacceleration in China remains the most likely driver of a rebound in global six-month real narrow money growth – required to support a forecast that H2 industrial cooling will represent a pause in an ongoing upswing rather than a foretaste of more significant weakness in 2022.
Chart 6
Travel and tourism has been one of the hardest hit sectors during the COVID-19 pandemic. Prior to the pandemic, this sector accounted for a quarter of all new jobs created globally, and contributed 10.4% to global GDP in 2019. In 2020, 62 million people working across the travel and tourism sector lost their jobs, and many are still supported by government wage subsidies. Domestic visitor spending decreased by 45% and international visitor spending declined by 69%. As a result, the sector lost US$4.5 trillion, or 49% compared to 2019, and only accounted for 5.5% of global GDP last year.
With the help of rapid vaccine rollouts in several economies, we are beginning to see some light at the end of the tunnel. In the United States (US), more than half of all adults have now been fully vaccinated. States are easing restrictions; some are aiming to fully reopen in July. Although business trips are unlikely to match pre-pandemic levels until 2023 or 2024, demand for leisure travels rebounded strongly. About 1.9 million travellers passed through airport security checkpoints on May 27, 2021 – that is six times the volume on the same day a year earlier, and about three quarters of the 2019 level. US domestic air travel has also returned to 75% of pre-pandemic levels.
A similar trend has been observed in the restaurant industry. According to OpenTable, restaurant bookings in the US were almost back to normal in the last week of May. Data released by the Bureau of Economic Analysis shows consumer spending on services in April 2021 had reached US$10.1 trillion, surpassing the US$9.95 trillion in April 2019, and approaching the previous peak of US$10.3 trillion in Feb 2020.
The European Union is also gradually reopening, and is working on the plans to welcome fully vaccinated travellers from abroad, including Americans, as soon as this summer. Most people have been staying within their local areas for over a year, and cannot wait to take that long awaited trip. A recent survey shows nearly 9 in 10 American travellers have plans to travel in the next six months.
Many names in our portfolios are set to capture the pent-up demand in the leisure and tourism industry, and we would like to highlight a few in this commentary.
Autogrill (AGL IM)
While we do not invest directly in airline operators, we own Autogrill, the largest food and beverage provider at airports and motorways. Autogrill operates in 142 airports around the world, and manages 548 service stations along motorways and in railway stations. North America accounts for over 50% of the company’s total revenue, and the faster vaccination progress in this region will help the business to recover as passengers resume domestic travels.
Melia Hotels International (MEL SQ)
Headquartered in Spain, Melia operates more than 367 hotels in 41 countries. It is the third largest hotel group in Europe. First quarter results were still weak, but the company has seen a ramp-up in bookings for several key markets. Bookings of its resort destinations from domestic tourists in Spain have shown favourable recovery. US customers’ bookings for the Caribbean, particularly Mexico, have reached 2019 levels. With many quality assets, Melia should be able to benefit from the return of leisure travellers this summer.
Samsonite International (1910 HK)
Founded in 1910, Samsonite is the world’s largest lifestyle bag and travel luggage company. It owns many brands including Samsonite, Tumi, and American Tourister, and the products are sold in over 100 countries. The US and China accounted for 46% of total sales in 2019, and domestic travels have begun to pick up in both countries. The worst should be behind and the company targets to break even in the second quarter and return to profit from the third quarter onwards.
Ariake Japan (2815 JP)
Based in Japan, Ariake is a leading producer of natural seasoning concentrates based on animal bones. It has over 3,000 products used in soup, bouillon, broth and sauce bases. Customers are all commercial users that include hotels, restaurants, and makers of instant noodles, frozen foods, and prepared meals. Convenience store and food manufacturer channels remained resilient last year. Ariake continues to launch new products and gain market share. Yet the restaurant and hotel channel, which takes about 30% to 40% of total revenue, was hit due to dining restrictions and ordered closures of operators by the government. The restaurant related business is expected to catch up, with easing restrictions.
Limoneira (LMNR US)
Based in Santa Paula, California, the 127-year-old company is a leading producer of lemons, avocados, and oranges, with lemon being the largest revenue contributor. In the US, more than half of lemon production goes to food services, so the company was inevitably hurt by COVID-19. However, starting from the first quarter of fiscal year 2021, demand for lemon has recovered and pricing is performing well in comparison to 2020. The company also expects strong results for avocado and oranges sales in fiscal year 2021.
It is encouraging to see countries and cities coming back to life following a year of restrictions and confinement. However, caution is warranted as it takes time for the economies to fully recover due to uncertainties with vaccine rollouts, new COVID-19 variants, labour shortages, and supply chain challenges. Our portfolio remains balanced across regions and sectors. Companies in our portfolios are in great financial positions, and continue to deliver strong results.
Recent US dollar weakness against the euro, like the rally earlier in 2021 and a May-December 2020 slide, may reflect differential growth in net lending to government by the Fed and ECB. Fed net lending has been rising faster recently, possibly contributing to an excess supply of dollars, but the ECB may move back into the lead in H2, suggesting support for the US currency.
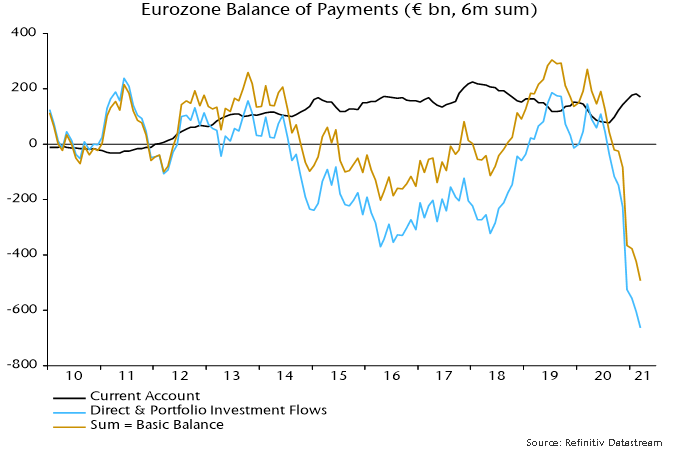
Eurozone balance of payments figures, available through March, show a record net outflow of direct and portfolio capital in late 2020 / early 2021. The outflow swamped the current account surplus, resulting in a record “basic balance” deficit, which may have driven a Q1 decline in EUR / USD – see chart 1.
Chart 1
Basic balance positions of currency areas, according to monetary theory, are influenced by the relative pace of domestic credit expansion (DCE), defined as bank lending to government net of government deposits plus lending to the private sector. Central banks have been a key driver of DCE in recent quarters via their QE operations and changes in their government deposit liabilities.
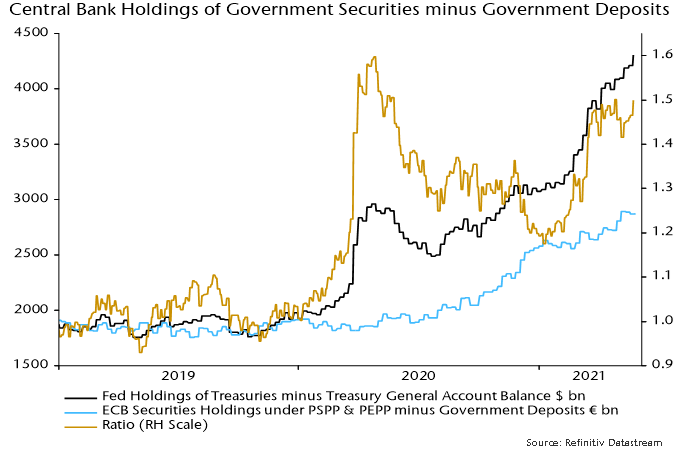
Chart 2 shows stocks of net government lending by the Fed and ECB, together with their ratio. A rise in the ratio implies faster “liquidity creation” by the Fed than the ECB, which – other things being equal – would be expected to imply upward pressure on EUR / USD.
Chart 2
There have been three distinct phases since covid struck:
The Fed launched additional QE earlier and on a much larger scale than the ECB, resulting in a surge in the ratio in spring 2020. The dollar moved into excess supply, reflected in a sharp rise in EUR / USD into August, with a further move higher into year-end.
The Fed’s stock of net government lending went into reverse in mid-2020 as a slowdown in QE coincided with a Treasury build-up of cash in its general account at the central bank. PEPP buying, meanwhile, boosted growth of ECB net lending. The rise in relative euro supply resulted in an outflow of Eurozone capital in late 2020 / early 2021, with associated EUR / USD weakness in Q1.
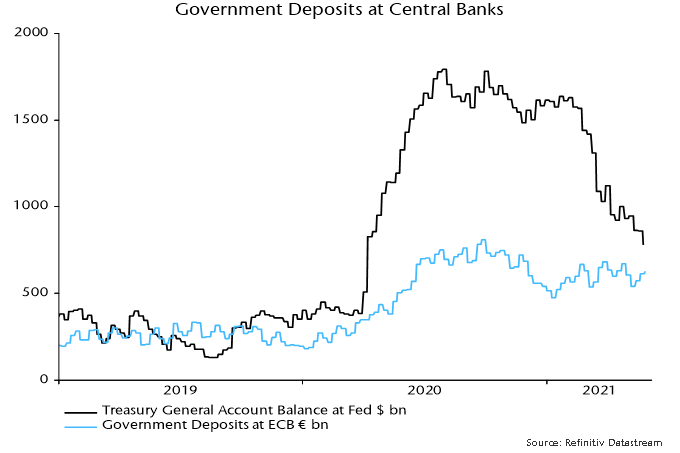
The Fed / ECB net lending ratio rose again from January as the Treasury ran down its general account balance from more than $1.6 trn to below $800 bn currently, partly to finance $380 bn of stimulus payments over March-May. This has been reflected in a Q2 rebound in EUR / USD towards a December high of 1.23.
What next?
ECB purchases of government securities are currently running at about €110 bn per month versus Fed buying of Treasuries of $80 bn. The Treasury’s latest financing estimates assume a further fall in its balance at the Fed to $450 bn by end-July but a recovery to $750 bn by end-September. The suggestion, therefore, is that the ECB’s stock of net government lending will grow faster than the Fed’s between now and end-September.
Eurozone governments, moreover, could choose, like the Treasury, to reduce their current large cash balance with the ECB, giving an additional boost to net lending and euro supply – chart 3.
Chart 3
The Fed / ECB net lending ratio could rise further in June / July before turning down and the last three EUR / USD moves began only after a new trend had been established. H2 is looking more promising for the dollar but confirmation of a shift in relative liquidity creation is required.
Occasionally we are reminded that cybersecurity decisions have real-world impacts. In early 2021, news of a cyber attack at a water treatment plant in Florida was made public, in which one of the employees lost control of his mouse and watched as the hacker increased the level of sodium hydroxide 111 times from its intended level, making it dangerous to even touch the water. Luckily, the computer’s owner was proactive in rectifying the situation and escalating the case to the FBI. Even though many security checks were in place, making it unlikely that the contaminated water would reach the population, this case illustrates how ill equipped modern infrastructure is to deal with cybersecurity threats.
On May 7, Colonial Pipeline announced that it became the victim of a ransomware cyber attack that forced the company to halt all pipeline operations for a full week, making it the largest successful cyberattack on an oil infrastructure target to date. As the largest refined oil pipeline system in the eastern United States (US), the consequences were felt immediately. An estimated 12,000 gas stations faced shortages, fuel prices rose to more than $3/gallon, and panic buying surged to levels not seen since the toilet paper mania at the onset of the pandemic last year. As is usually the case with ransomware attacks, management did not know exactly how severe the breach was or how long it would take to have the systems work again on their own. As such, the company went ahead and paid the full ransom of 75 bitcoins, worth roughly US$4.4 million, and its operations were able to resume several days later.
Ransomware and other forms of cyber attacks are much more frequent than one would expect. In its annual “State of Email Security” report, Mimecast Ltd. found that 61% of organizations surveyed had been impacted by ransomware in 2020, an increase of 20% over 2019. On average, these companies lost six working days of system downtime and for 37%, the downtime lasted a week or more. One of the worst parts is that more than half of the victims paid the ransom demand but only 66% of them were able to retrieve their data afterward. This means one third never saw their data again despite paying the ransom.
In past commentaries we discussed how email is the most frequent and vulnerable attack vector, even more so since work from home became the norm. Since the beginning of the pandemic, it has been found that employees are three times more likely to click on malicious emails than they had before, while the number of email threats rose 64% year over year. This implies that working from home is also leading to employees being less vigilant about potential threats. Meanwhile, companies have been slow to adapt. Cybersecurity training is provided by only one out of five companies, despite almost half of technology chiefs believing that their biggest weakness stems from their employees’ lack of cybersecurity knowledge. Furthermore, one in ten companies do not even have an email security system.
With this in mind, it is not difficult to understand why Global Alpha has maintained continuous exposure to the cybersecurity sector over the years. In the past, we owned names such as Sophos, Nice Systems, and we currently own Mimecast Ltd. (MIME US).
Business Overview
Mimecast is a cloud-based platform that offers email security solutions. They provide a range of services, including targeted threat protection, encryption, large file sending services, and data leak prevention. Peter Bauer is one of the co-founders of the firm and has been CEO since its inception in 2003. Insiders own about 7% of the shares outstanding.
Competitive Advantages
Given the sticky nature of the business, Mimecast enjoys very high retention rates. They also have the fastest search service-level agreement in the industry because their service architecture was designed for the cloud from the beginning.
Mimecast processes over 400 million emails every day, and has more than 300 billion emails under management. They are the only email security provider to guarantee 100% continuity on Office 365.
Growth Strategy
Cross sell opportunities as the average customer owns around 3.5 products (up from 3.2 in 2019)
New product launches (6 products at its IPO in 2015, currently 11)
Increased penetration in the enterprise business
We are always on the lookout for new investment opportunities with secular growth opportunities. Our ability to be highly selective and nimble in our portfolio holdings leaves us well positioned to add some exposure to the online security industry at attractive valuations.