Archives:
When it comes to vaccination campaigns, the United States (US), United Kingdom (UK), and Israel continue to lead the way. Following the vaccination of some of the most vulnerable populations, the rate of hospitalizations are decreasing. Efficient vaccination campaigns in the US and UK have increased confidence that economic activity will continue to grow in the coming months. Many indications show strong pent-up demand from both consumers and corporates starting to increase.
In other parts of the world where vaccinations are taking longer, reopening will be slightly delayed. Despite the slow start in Europe, governments are intensifying their campaigns as the supply of vaccines increases. This should enable the economy to reopen and activity to rebound. As restrictions ease, we continue to expect the economy to recover rapidly beyond Q2.
There are some interesting data points that suggest a stronger economic activity as restrictions ease:
- Resilience: Similar to what we experienced in the second COVID-19 wave, economies are showing signs of resilience in this third COVID wave.
- Business optimism: Strong survey data for the industrial sector suggests that businesses are more optimistic.[1] This could lead to better business activity for Q2. We noticed some businesses commenting on better than expected business trends. After huge cost cutting efforts during 2020, businesses are gradually returning to capex and IT spending.
- Manufacturing momentum: Although the service component of the economy could still be impacted by government restrictions, the manufacturing side shows a strong business sentiment. Excluding some supply constraints, like the shortage of semi-conductors, or the disruption in Texas, global manufacturing shows positive momentum.
- Pent-up demand: Global personal savings have soared rapidly over the past months, as expensive holidays were impossible. A portion of that extra money has been redeployed on near-term recreational goods, gardening and home spending. We believe that these product categories will remain strong even after the pandemic starts to retreat.
Some recreational and sports goods have become more popular in this pandemic as leisure options narrowed. Bicycle sales are enjoying phenomenal demand. Suppliers have indicated that stock levels in the supply chain are much too low and that the return to a more normal inventory level would already lead to a high double-digit market growth. RV manufacturers and RV rental marketplaces is another segment that cannot keep up with demand. Thanks to a tight supply chain, strong demand and low inventories, this segment should enjoy good order visibility for 2021 and beyond.
Regarding travel, US domestic and international flights are at the highest levels since the end of March 2020. Europe, which relies more on intercontinental traffic, has not improved much yet, but there are positive signs starting to emerge. The European Commission presented a proposal to create a digital Green Certificate to facilitate the safe free movement of citizens within the EU. Another example is Iceland, which will open its borders this week to visitors who have received the vaccine without the need for testing or quarantine. Australia and New Zealand will also have a similar arrangement starting next week.
Restaurant bookings are soaring in some parts of the US, but also in the UK, as outdoor bars and restaurants opened earlier this week.[2] With a reduced supply of pubs and restaurants, the ones that operate should enjoy strong consumer traffic. Apparently, outdoor tables booked out several weeks in advance after the UK government announced its reopening framework this winter.
These observations and data points are no surprise, as people look forward to leisure activities and travel after months of restrictions. The important variables now are how fast populations are being vaccinated and how efficient vaccines are in terms of preventing a person from carrying or passing on the virus.
[1] Bloomberg – EMEA WEEK AHEAD: ECB to Hold, Russia Hike, U.K. Jobs
[2] https://www.opentable.com/state-of-industry
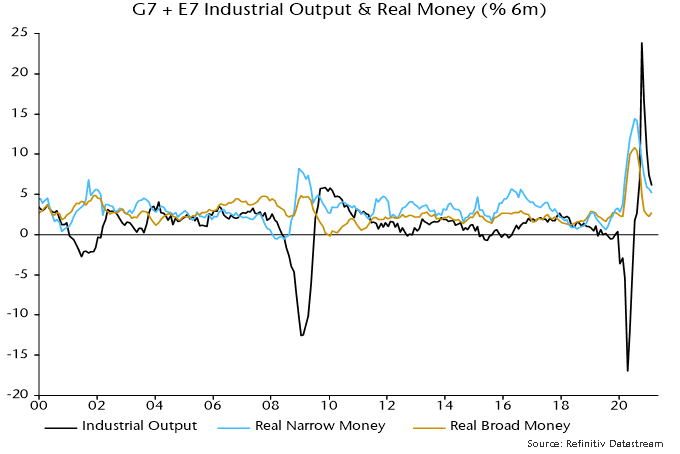
Global six-month real narrow money growth appears to have edged lower in March, continuing a downtrend since last summer. This suggests that an expected relapse in global industrial momentum will extend through late Q3 / early Q4.
The global manufacturing PMI new orders index reached a new recovery high in March, consistent with a surge in six-month real narrow money growth into July / August 2020, allowing for the historical average 6-7 month lead time. More recent national surveys hint that March will mark a top – see chart 1.
Chart 1
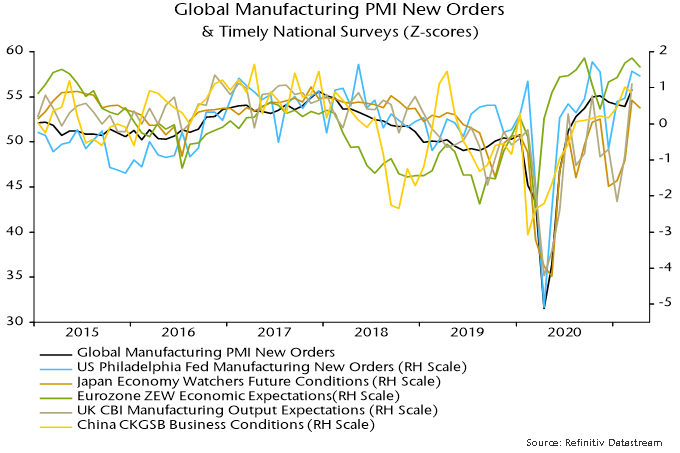
The March real money growth estimate is based on information for the US, China, Japan, India and Brazil, together accounting for 70% of the G7 plus E7 aggregate tracked here. The US component is estimated from weekly data on currency in circulation and commercial bank deposits – official March money numbers are released next week and the Fed no longer provides weekly updates.
Global six-month real narrow money growth appears to have eased further to its lowest level since February 2020, reflecting stable nominal growth and another rise in six-month CPI inflation – charts 2 and 3.
Chart 2
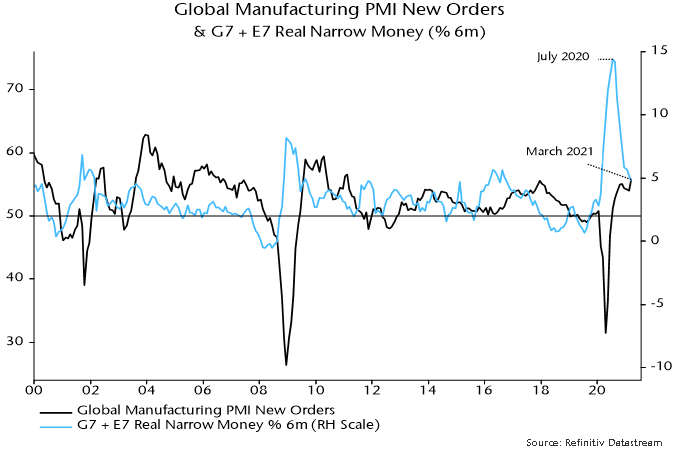
Chart 3
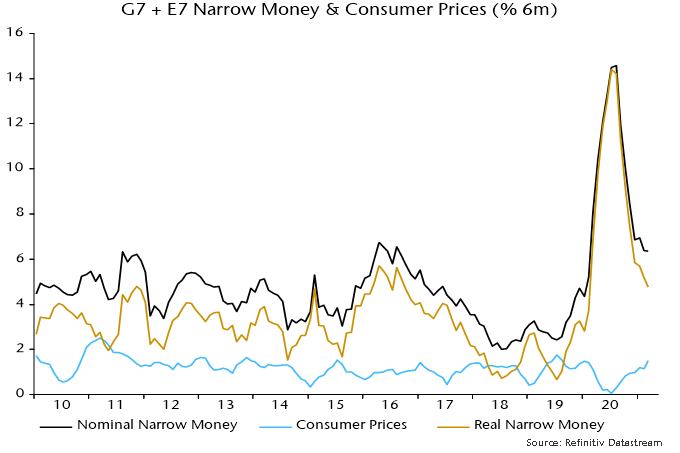
Chart 4 shows the early reporting countries individually. US six-month real narrow money growth is estimated to have edged lower despite disbursement of $318 bn of stimulus payments to households – these were made in the second half of the month and may have a larger impact in April (the money numbers are month averages).
Chart 4
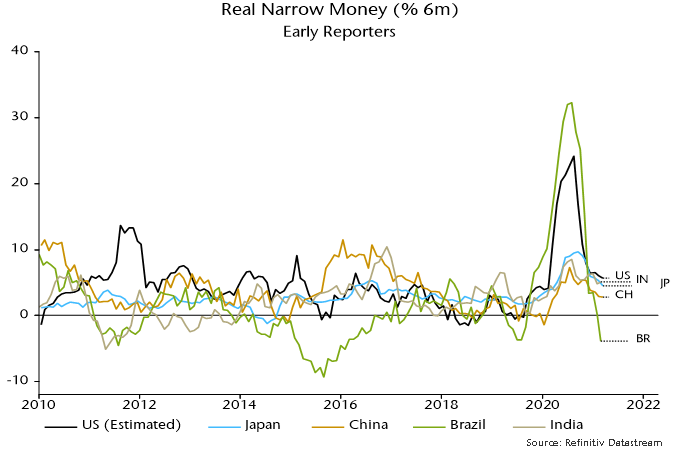
Six-month growth also eased slightly further in Japan and China, with a small rise in India. Brazil moved into contraction although this needs to be placed in the context of an extraordinary surge last summer – 12-month growth is still strong.
Markets could be starting to offer corroboration of the scenario of a global manufacturing PMI new orders peak and pull-back, with Treasury yields stalling and equity market cyclical sectors no longer outperforming – chart 5.
Chart 5
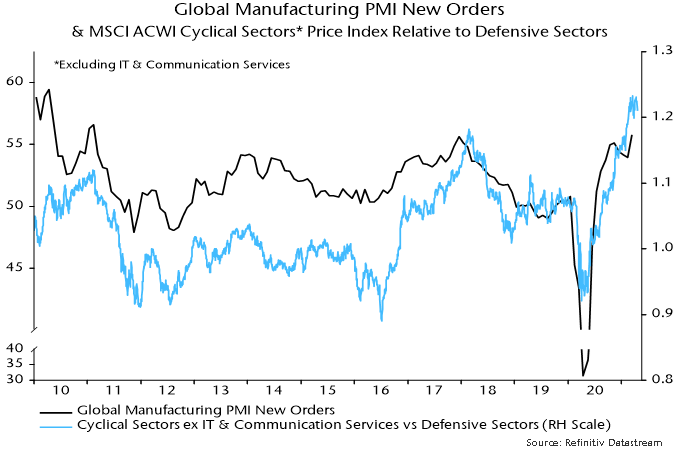
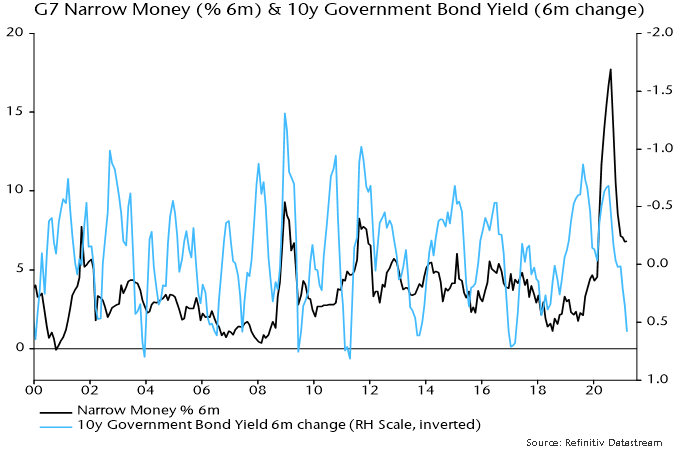
Will global six-month real narrow money growth recover? Six-month CPI inflation is likely to rise slightly further in April / May but could fall back in H2 as commodity prices move sideways or correct.
Fiscal stimulus is acting to push up US nominal money growth but there may be an offsetting drag across the G7 from recent bond yield rises – chart 6.
Chart 6
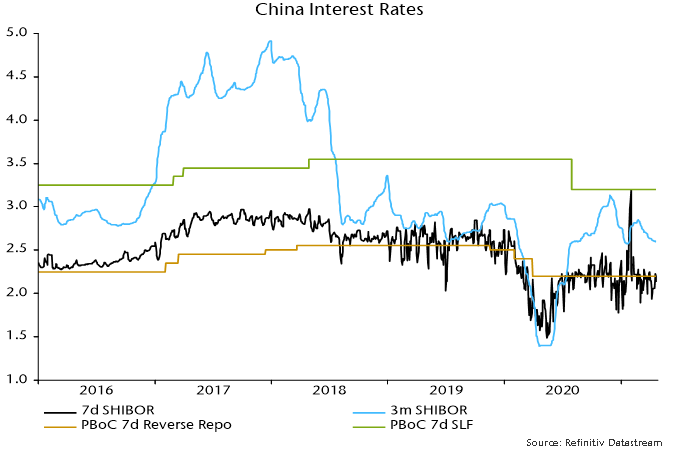
A revival in Chinese narrow money growth probably requires a PBoC policy shift. The view here has been that policy was overtightened in H2 2020 and the economy would slow in H1 2021. This scenario appears to be playing out, with Q1 GDP disappointing and industrial output falling in March. Core CPI inflation (i.e. ex. food and energy) is at 0.3% and a surge in PPI inflation reflects input cost rises that are squeezing downstream margins. The PBoC has allowed three-month SHIBOR to drift back to its January low, consistent with a switch to an easing bias – chart 7.
Chart 7
Global industrial output has flatlined since early 2021, reflecting supply disruptions but also a loss of demand momentum. Output may recover into 2022 as supply problems ease but money trends signal a further weakening of underlying momentum. Second-round inflation effects, meanwhile, may force central banks to bring forward plans for stimulus withdrawal – unless markets weaken sharply. This backdrop suggests retaining a cautious investment strategy unless money trends rebound in late 2021 – possible but not a central scenario.
The ”monetarist” forecasting approach used here relies on the rules of thumb that 1) real narrow money growth directionally leads demand / output growth by 6-12 months (average 9 months) and 2) nominal broad money growth directionally leads inflation by 1-3 years (average 2+ years). Global narrow / broad money growth surged in 2020 but has slowed this year. This slowdown is being reflected in a loss of economic momentum but the inflationary impact of the 2020 bulge will continue well into 2022. Current “stagflation” concerns, therefore, are likely to persist.
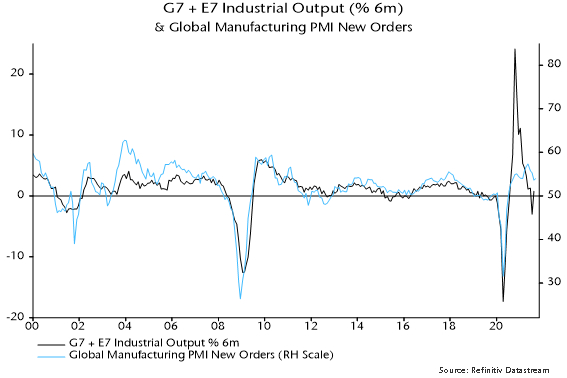
Supply chain disruption is distorting economic data, complicating analysis. The presumption here is that the global manufacturing PMI new orders index is a reasonable guide to underlying industrial demand momentum. The index has fallen since May, mirroring an earlier decline in global (i.e. G7 plus E7) six-month real narrow money growth from a July 2020 peak – see chart 1. With real money growth sliding further into July / August 2021, the suggestion is that the PMI new orders index is unlikely to reach a bottom before early 2022.
Chart 1
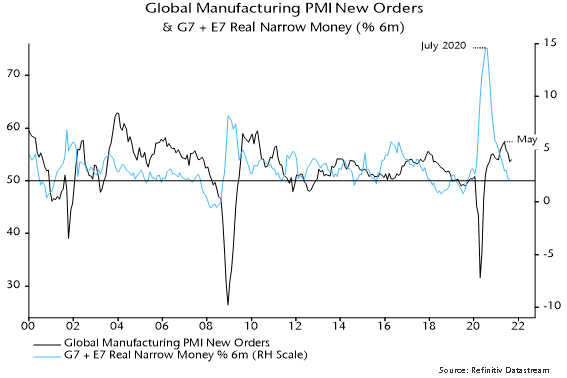
Supply chain disruption, however, has resulted in a substantial undershoot of industrial output relative to the growth rate suggested by the PMI new orders index, implying scope for a short-term catch-up – chart 2. Market participants could wrongly interpret such a pick-up as a reversal in trend momentum. Confusing signals could lead to greater market volatility but any revival in the cyclical / reflation trade is likely to be short-lived unless monetary trends – and hence PMI prospects – improve.
Chart 2
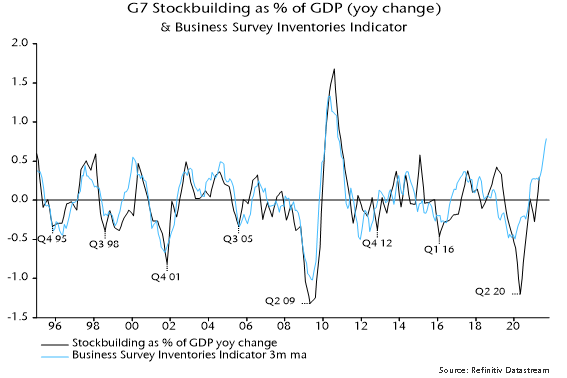
The approach here uses cycle analysis to cross-check monetary signals and provide longer-term context. The 3-5 year stockbuilding and 7-11 year business investment cycles are judged to have bottomed in Q2 2020 and are currently providing a tailwind to the global economy, cushioning the impact of less expansionary monetary conditions.
The next cyclical “event” will be a peak and downswing in the stockbuilding cycle. Based on its average historical length of 3 1/3 years, the next cycle low could occur in H2 2023, implying a peak by H2 2022 at the latest. The business survey inventories indicator calculated here, however, suggests that the cycle upswing is already well-advanced, hinting at an early peak – chart 3.
Chart 3
The upshot is that monetary trends suggest a slowdown in global economic momentum through early 2022 while the stockbuilding cycle is likely to act as a drag from H2 2022. This leaves open the possibility of a resumption of strong economic growth in a 2-3 quarter window around mid-2022. An immediate rebound in global real narrow money growth, however, is needed to validate this scenario.
Such a rebound is possible despite the Fed and other central banks moving to wind down stimulus. It could be driven, for example, by Chinese policy easing to support a weak economy, a sharp reversal in commodity prices as industrial momentum softens (boosting real money growth via a near-term inflation slowdown) or a pick-up in bank lending (normal at this stage of stockbuilding / business investment cycle upswings). It is, however, unnecessary to speculate – it is usually sufficient for forecasting purposes to respond to monetary signals rather than try to anticipate them.
Chart 4 shows a breakdown of G7 plus E7 six-month real narrow money growth. Earlier US relative strength / Chinese weakness has been reflected in divergent year-to-date equity market performance, with DM ex. US and EM ex. China indices charting a middle course. A recent cross-over of US real money growth below the G7 ex. US average suggests reducing US exposure in favour of other developed markets.
Chart 4
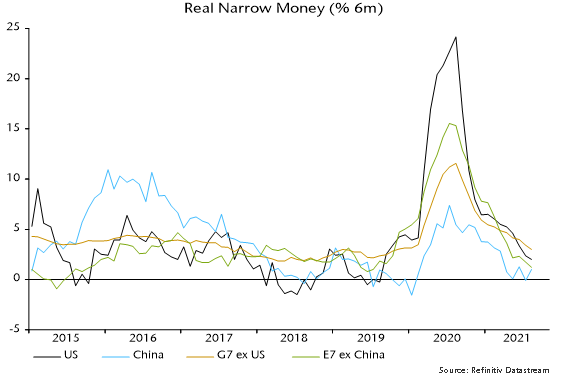
Chinese real money growth, meanwhile, was showing signs of bottoming before the recent escalation of financial difficulties at property developer Evergrande. This could result in faster policy easing, an “endogenous” tightening of credit conditions, or both. The net monetary impact is uncertain but a recovery in money growth in late 2021 would argue for adding Chinese exposure in global and EM portfolios despite likely further weakness in economic data.
Investors continue to debate whether high inflation is “transitory” as central bankers naturally assert. The monetarist view is straightforward: the roughly 2-year transmission of money to prices implies no significant inflation relief before H2 2022, while a return to pre-covid levels requires a further slowdown in global broad money growth.
Inflation drivers are likely to shift, with energy and other industrial commodity prices cooling as the global economy slows but offsetting upward impulses from food, rents and accelerating unit wage costs as labour shortages and mismatches force pay rises above productivity growth.
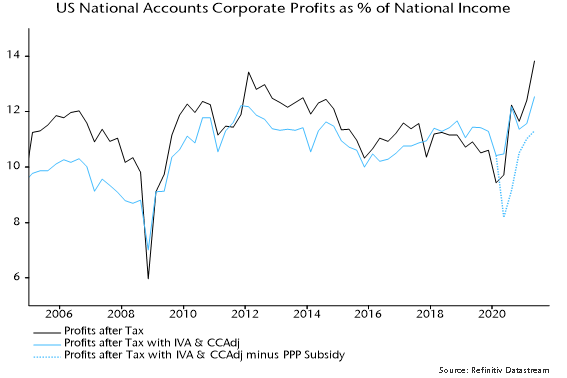
Rising labour costs could, in theory, be absorbed by a reduction in profit margins rather than being passed on in prices. Recent profits numbers, however, overstate underlying health because of stock appreciation and pandemic-related government support. The share in US national income of an “economic” measure of corporate profits (i.e. adjusted for inventory valuation effects and Paycheck Protection Program subsidies, and to reflect “true” depreciation) is in line with its average over 2010-19, in contrast to inflated book profits – chart 5.
Chart 5
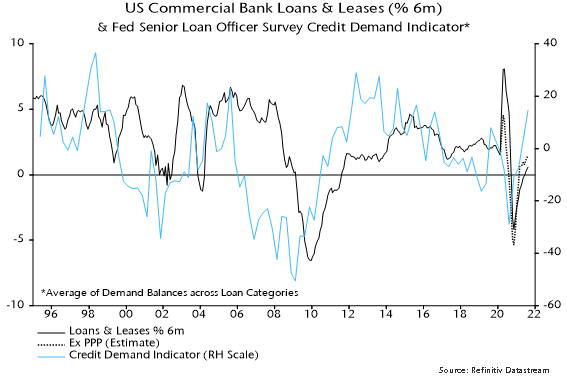
G7 annual broad money growth has fallen from a peak of 17.3% in February 2021 to 8.3% in August, with 3-month annualised growth at 6.2%. This is still high by pre-covid standards: annual growth averaged 4.5% over 2015-19. Reduced support to money growth from QE could be offset by faster expansion of bank balance sheets, reflecting strong capital / liquidity positions and rising credit demand. US commercial bank loans and leases have recently resumed growth, with the Fed’s senior loan officer survey suggesting a further pick-up – chart 6. The ECB’s lending survey is similarly upbeat.
Chart 6
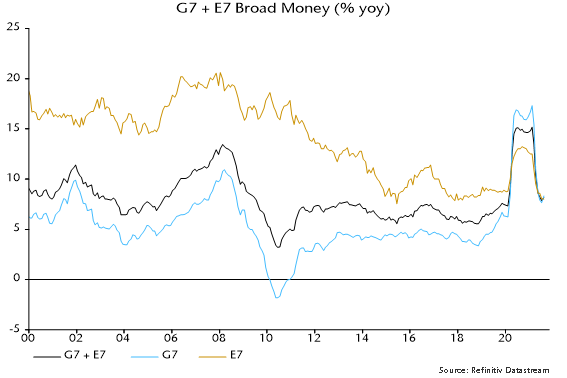
Adding in the E7, annual broad money growth is closer to the pre-covid level, at 8.2% in August versus a 2015-19 average of 6.4% – chart 7. Growth is below average in China, Mexico and Russia and in line in India. Inflationary pressures are more likely to prove “transitory” in these economies, suggesting support for local bond markets.
Chart 7
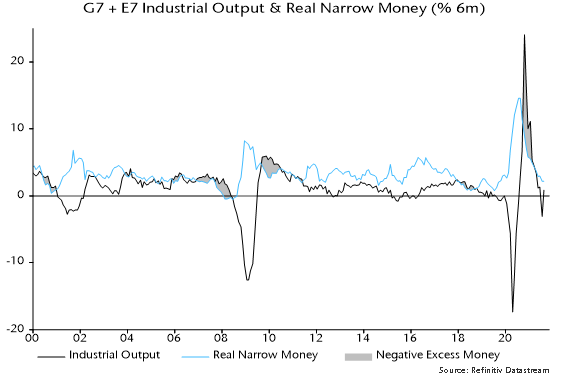
Global equities held up over the summer despite weaker activity news and upside inflation surprises. A monetarist explanation is that markets were supported by “excess” money, as supply disruptions contributed to global six-month industrial output growth falling below real narrow money growth – chart 8. A temporary output catch-up as supply problems ease could reverse this crossover – a further argument for maintaining a cautious investment stance emphasising defensive sectors and quality.
Chart 8
This year has started on strong footing for global mergers and acquisitions (M&A). According to Refinitiv, global M&A hit a new record of $1.3 trillion as of March 31st, 2021.[1] What is driving this boom? On the news we have seen many big deals take shape, from GE divesting its business to Canadian Pacific expanding its footprint. But behind the headlines, something else is accelerating M&A activities, especially in the Unites States (US). We are talking about SPAC, which alone represent about 25% of the total deal volume in the US.
The first quarter of this year was also one of the busiest for IPOs, of which, once again, SPACs took the limelight. There were 296 SPACs raising $87 billion, a 20-fold increase over the same period last year.
What is a SPAC?
A SPAC or “Special Purpose Acquisition Corporation” is a vehicle used to acquire a private company and make it public without going through the traditional IPO process. Back in the 1980s, there was something called a “blank check offering”. These were companies focused on finding promising operating enterprises — prospects that sounded great on brokers’ cold call pitches (typical “pump and dump” schemes). Fraud and manipulation was so rampant among these blank check companies, the SEC adopted Rule 419 under the Securities Act of 1933 , “requiring investors’ funds to be held in escrow, filing of a post-effective amendment upon execution of an acquisition agreement, and the return of the escrowed funds if an acquisition has not occurred within 18 months of the effective date of the initial registration statement.”.
David Nussbaum, a Long Island based lawyer and CEO of GKN Securities, understood the new rules would reduce interest from investors. So he reinvented the blank check concept in 1992, and SPACs were born. The SPAC structure allowed for trading, but included many provisions to protect investors — like allowing investors to opt out of the merged company and get their money back once a deal is done.
How do SPACs work?
First, a sponsor raises capital and incurs the cost of an IPO in a new shell company. To make the deal attractive to investors, the units are usually priced at $10 each and provide a warrant to buy more shares. The sponsor then has 12 to 24 months to find the target. If no target is found, or if the investors decide to vote “no” on the deal, the holders can redeem their investments.
We have seen this movie before
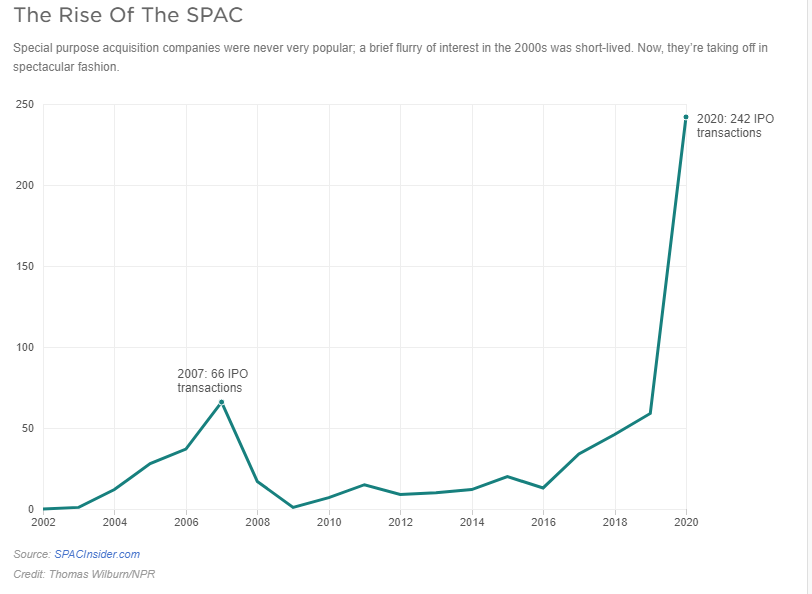
SPACs are in their third decade of existence. In the early 1990s, they were marketed as vehicles that helped small companies go public, while offering outsized favourable terms to their sponsors. In the late 90s, SPACs took a back seat. After all, why would a company do a reverse merger when you could easily raise money during the tech bubble? SPACs enjoyed a renaissance in late 2002, peaking at 66 IPOs just before the great financial crisis. They reappeared in early 2016, and have been going strong ever since. According to SPAC Analytics, in 2020, SPACs were 55% of IPOs, compared to 4% in 2013. So far this year, SPACs represent 79% of total IPOs.
SPACs versus a traditional IPO
SPACs are a pure genius way of going public. Since there is no identified target, a sponsor’s prospectus has no information about the business or the strategy. On the other hand, an IPO roadshow raises a lot of questions and invites a lot of scrutiny from investors.
In an IPO, there is no guarantee on the final valuation of the company. With a SPAC, the IPO has been done, and you have negotiated the valuation of your company with the sponsor. Plus the due diligence required for a merger is much less than SEC requirements for a regular IPO.
Cost could be another key factor. An IPO can cost anywhere between one to seven percent in fees for investment banks. With a SPAC, the underwriter may charge about five to six percent. However, there are other fees associated with the merger, which can end up being almost 20-25 percent of the total money the sponsor may raise.
Why are SPACs so popular?
A recent Wall Street Journal article counted 61 sports-related SPACs formed this year alone, compared to just five in 2019.[2] Athletes from Serena Williams, Stephen Curry, Naomi Osaka, Tony Hawk, Colin Kaepernick, and even Shaquille O’Neal, have shown interest in SPACs.
Everyone loves money, especially free money. SPAC founders and sponsors generally get about 20% of the shares of the SPAC as a fee for raising capital, finding the target, and, of course, giving it their brand name. Hedge Funds like it because they can use leverage to buy SPACs and also get preferential access to SPAC deals at the $10 share price. Everyone else has to wait and likely pay a higher price.
Most investors don’t read the annual reports of the companies they own, so they miss out on the fine print in the SPAC prospectus. For example, many are unaware of the lock-up period, which can be anywhere from six months to a year. Once the lock-up period is over, the floodgates open and add pressure to the stock price.
The clock is ticking?
SPACs don’t have time on their side because there is a limited window to close a deal. Targets are well aware of this restriction. They also know that a SPAC is required to spend at least 80% of its assets on a single deal. So the target always has the advantage. SPACs are paying a median price-to-sales ratio of 12.9, compared to 4.1 paid by other companies, according to 451 Research.[3]
SPAC-mania has been going on for a few years now, which means there is a lot of capital chasing deals, combined with ticking clock syndrome, which signals an inevitable decline in deal quality. We could easily see the SPAC bubble go bust once again.
How have SPACs performed historically?
A team of researchers analyzed completed mergers from January 2019 and June 2020, and found that SPACs lost 12% within the first six months, and dropped 35% on average after the first year. Bain & Co looked at 121 SPAC mergers from 2016 to 2020 and concluded that “more than 60% have lagged the S&P 500 since their merger dates, and 50% are trading down post-merger”. The other 40% are trading below the $10 IPO price.
Portfolio Impact
Regulators like the SEC are beginning to take a closer look at SPACs. SEC recently issued an investor alert pointing out that just because celebrities are backing SPACs doesn’t mean retail investors should follow suit.
At Global Alpha, we do not invest in SPACs. Our focus is on finding high-quality companies with defensible business models and strong balance sheets that should outperform the small-cap benchmark.
[1] https://news.yahoo.com/deal-making-smashed-records-q1-141243172.html
[2] https://www.wsj.com/articles/the-celebrities-from-serena-williams-to-a-rod-fueling-the-spac-boom-11615973578
[3] https://usa-latestnews.com/technology/with-valuations-on-us-startups-skyrocketing-spacs-are-starting-to-shop-overseas/
The assessment in the previous quarterly commentary was that the monetary backdrop for markets had deteriorated at end-2020. This was arguably reflected in weak bond market performance during Q1 but global equities rose further as earnings expectations were revised higher. The monetary indicators followed here continue to give a cautionary message for markets while suggesting that global industrial momentum will slow into late Q3. A summer growth “scare” could trigger a correction in equities and a recovery in defensive sectors.
The market assessment relies on two indicators of “excess” money, which, according to the “monetarist” view, is a key influence on demand for financial assets: the difference between global six-month real narrow money and industrial output growth, and the deviation of 12-month real money growth from a long-term moving average. The entire outperformance of global equities relative to US dollar cash since 1970 occurred during periods when both indicators were positive. Equities underperformed cash on average when either or both were negative.
Allowing for data publication lags, the indicators gave a joint positive signal at end-April 2020. The MSCI All Country World Index (ACWI) returned 33.9% in US dollar terms between then and end-2020, reflecting both a recovery in earnings expectations and a rerating of markets. The “buy” signal, however, was rescinded at end-December following a cross-over of real narrow money growth beneath industrial output growth – see chart 1.
Chart 1
Global equities derated during Q1 – the ACWI 12-month-forward PE ratio fell by 4.2% – but the index nevertheless returned 4.7% as forecast earnings rose by a further 8.6%. Earnings optimism was boosted by confirmation of additional large-scale US fiscal stimulus, which also contributed to continued outperformance of cyclical sectors. The view here, however, is that global industrial momentum is peaking and will slow through late 2021. This would be a shock to the consensus and could trigger an unravelling of recent market trends.
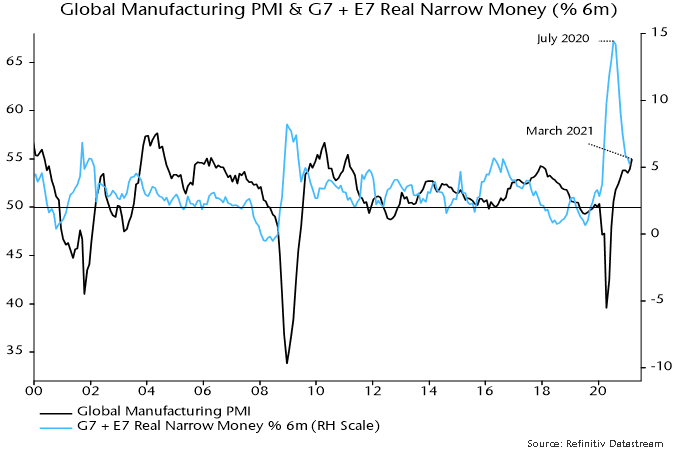
The slowdown forecast rests on the relapse of global six-month real narrow money growth from its July-August 2020 peak – turning points have led those in industrial output growth by nine months on average historically. The lead time on the global manufacturing purchasing managers’ index (PMI) is slightly shorter, suggesting that a new high in the index reached in March will mark the peak of the current upswing – chart 2.
Chart 2
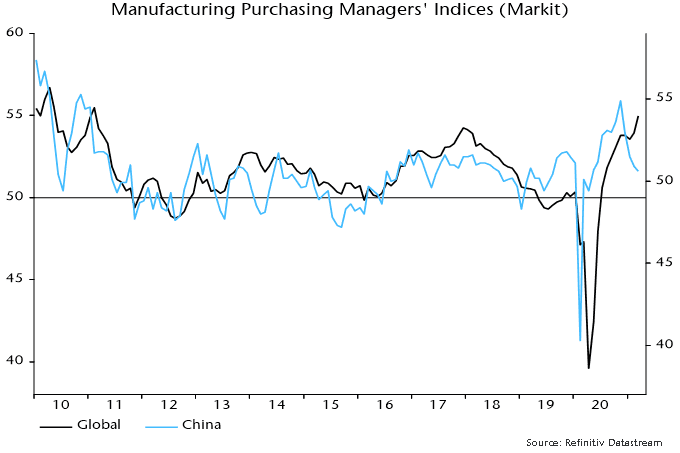
China’s industrial recovery has already decelerated, with the Markit / Caixin manufacturing PMI falling to an 11-month low in March. Chinese monetary policy was less stimulative than elsewhere in H1 2020 and retightened in H2, explaining relatively weak money trends – chart 3. China’s PMI has led the global measure since the GFC – chart 4.
Chart 3
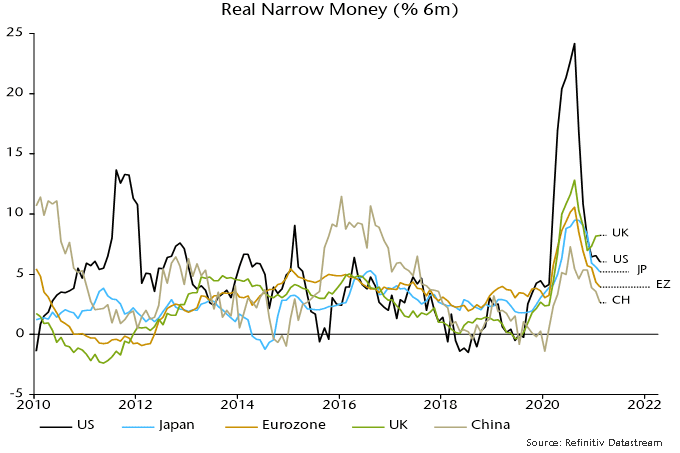
Chart 4
Global six-month real narrow money growth continued to subside in February. A recovery could unfold into the summer as US money numbers are boosted by disbursement of fiscal stimulus and if the PBoC relaxes policy in response to softer economic data. Such a scenario could result in another “excess” money buy signal by mid-year while suggesting industrial reacceleration from late 2021. A money growth rebound, however, is likely rather than guaranteed and the judgement here is that the focus for now should be on downside economic / market risks.
An industrial slowdown could be offset in GDP terms by services strength if covid developments allow economic reopening. This could, however, contribute to industrial deceleration by reversing last year’s substitution by consumers of goods for services spending. Industrial trends are likely to be more important for markets, partly reflecting a stronger correlation with equity earnings. Services-driven GDP strength could make central banks less inclined to offer support in the event of industrial / market weakness.
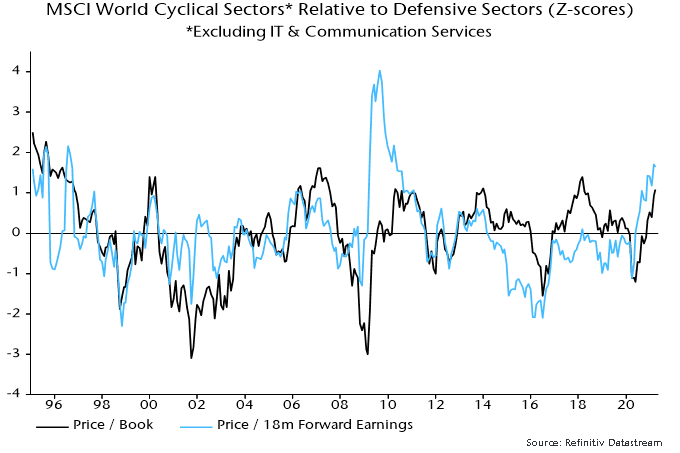
Global CPI inflation rates are spiking higher in reflection of recent commodity price moves and base effects but inflation worries could be near a short-term peak if the above industrial scenario unfolds – another reason for doubting that the cyclical / value rally will extend in Q2. Input price components of business surveys will fall away into the summer barring another surge in oil and other industrial commodities – chart 5. Cyclical sectors may be fully discounting “reflation”, judging by valuation relative to defensive sectors – chart 6.
Chart 5
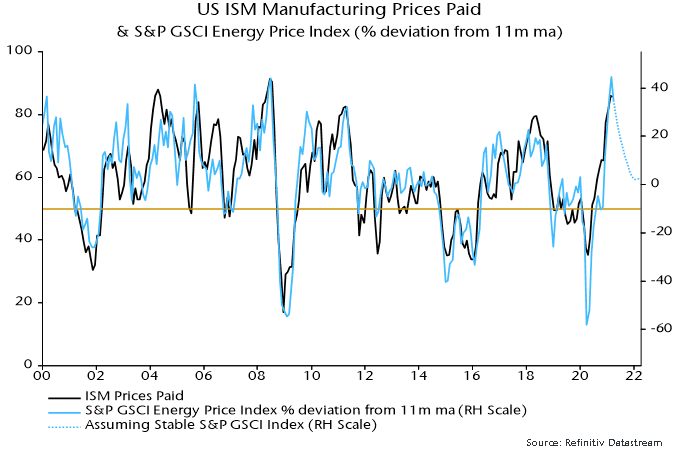
Chart 6
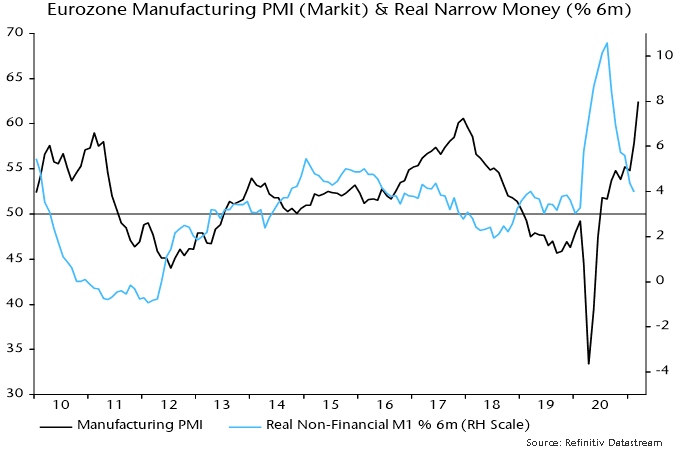
The March rise in the global manufacturing PMI was driven by European components, with the US PMI little changed and China’s – as noted – easing further. Eurozone strength is consistent with a real money growth spike last summer but a subsequent slowdown argues against current levels being sustained – chart 7.
Chart 7
UK money trends, by contrast, are diverging positively from other majors, signalling a relatively bright economic outlook and possible support for UK equities – chart 3. Money growth strength reflects larger-scale monetary deficit financing than in other countries, which may continue given PM Johnson’s big spender bias and a supine Bank of England. “Excess” money could partly flow overseas, suggesting downside risk for sterling, in which speculators appear to have accumulated a significant long position.
The forecasting approach here uses cycle analysis as a cross-check of the monetary analysis and to provide longer-term perspective. The previous assessment, which is maintained, was that the stockbuilding and business investment cycles bottomed in Q2 2020, while the long-term housing cycle remains in an upswing. The suggestion that all three cycles were turning supportive for the global economy and markets reinforced the positive message from monetary trends in mid-2020.
The next scheduled low is in the short-term stockbuilding cycle. Based on an average historical cycle length of 3.5 years, this could occur in late 2023, with the downswing into the low starting 12-18 months earlier, i.e. in mid- to late 2022. Risk markets tend to weaken in the 18 months leading up to a cycle trough – major equity bear markets have usually occurred during this time window.
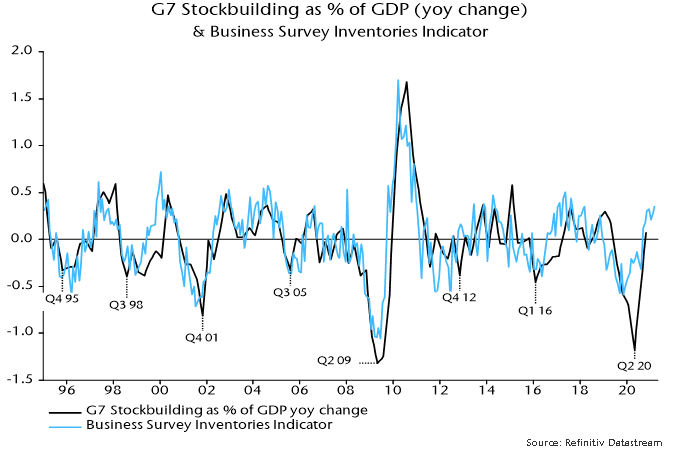
The suggestion is that the primary trend in the global economy and markets will remain up through H1 2022. Stockbuilding cycle upswings, however, typically unfold in a zig-zag pattern, with an initial upthrust followed by a corrective phase before a final move higher into the peak. The judgement here is that the initial phase is ending and cycle momentum will diminish into H2, consistent with the monetary forecast of an industrial slowdown. The view that the initial phase is mature is supported by the business survey inventories indicator in chart 8.
Chart 8
Market moves since Q2 last year, moreover, have in most cases matched or exceeded averages during 18-month periods following previous stockbuilding cycle lows – see table 1. Developed market equities, cyclical sectors and commodity prices, in particular, have performed strongly, suggesting limited further upside even though a stockbuilding cycle downswing may be a year or more away.
Table 1
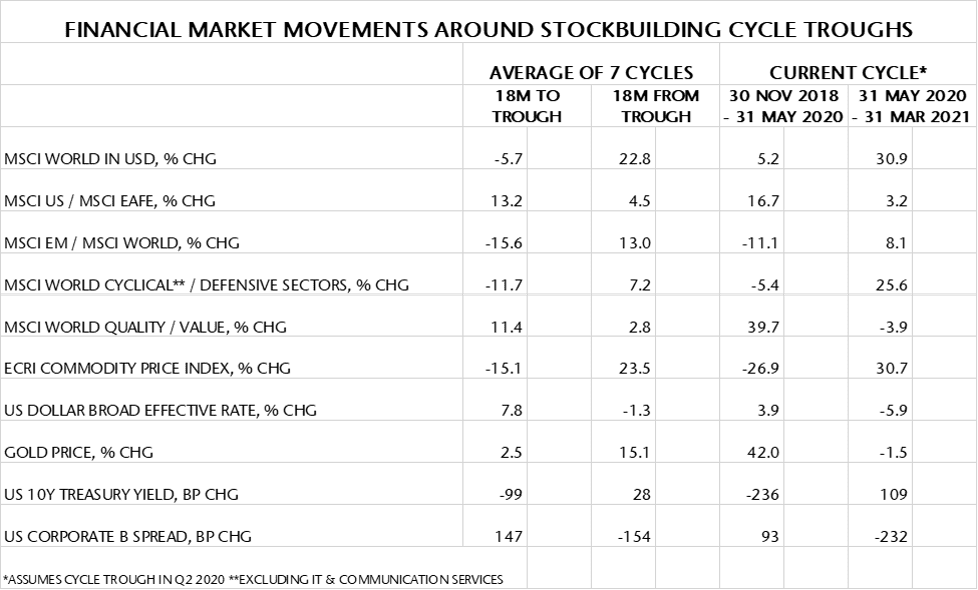
A further consideration is that the current stockbuilding cycle could be shorter than average. The covid shock appears to have extended the previous cycle to 4.25 years. If the current cycle were to display an offsetting deviation from the average 3.5 years, the next low would occur in early rather than late 2023 (i.e. 2.75 years from the Q2 2020 trough). This, in turn, would imply that the 18-month negative period for markets ahead of the low would start in H2 2021.
The latter possibility, it should be emphasised, is not the central case here and would require confirmation from a further fall in global six-month real narrow money growth during H1 2021 rather than the US-led rebound suggested earlier.
The comparison of recent returns with stockbuilding upswing averages, as well as supporting the case for reducing cyclical sector exposure in favour of defensive sectors, suggests relative value in emerging market equities, quality and gold, and scope for a further rally in the US dollar. Stronger EM equity performance, however, may be conditional on a recovery in Chinese money growth, probably requiring a prior PBoC policy shift.
These are the views of the author at the time of publication and may differ from the views of other individuals/teams at Janus Henderson Investors. Any securities, funds, sectors and indices mentioned within this article do not constitute or form part of any offer or solicitation to buy or sell them.
Past performance does not predict future returns. The value of an investment and the income from it can fall as well as rise and you may not get back the amount originally invested.
The information in this article does not qualify as an investment recommendation.
Marketing Communication.
OUT WITH THE OLD AND IN WITH THE NEW
‘Utility: the state of being useful, profitable or beneficial’
Ask any respectable scientist or engineer how they achieved distinction, and they will likely tell you that they stood on the shoulders of giants. Such is the nature of their fields – you build upon the work of your predecessors. However, it would be a mistake to think that this is the only approach to development. Sometimes the best solutions come from scrapping the previous script, redefining the problem and standing on your own two feet.
Take the modern banking system as an example. While it has been tweaked and nudged into the digital age, the system is still – at its core – an iteration of a centuries old industry. If you look closely enough, not a lot has changed from the principles set out in the 15th century (and still employed to this day) by the Banca Monte dei Paschi di Siena. It is a rather extraordinary idea when you think about it, and one that stokes an interesting discussion internally when we ask ourselves what if we had the luxury of redesigning the system from scratch? Would we arrive at the same modern day setup? Would we see a need for a network of bank branches, for instance? Would utility bills and signatures be our preferred means of identity authorization?
In our view, it is a resounding no. But such is the consequence of an iterative process and a series of shortsighted ‘quick fixes’ that seldom appear shortsighted at the time (e.g. replacing cheques with debit cards); they assume a very different perspective when we take a step back. If we deconstruct ‘banking’ into the core utility on which it was designed – the store of wealth and the transfer of money – then it becomes apparent that the major providers of utility in most markets are no longer the banks. The value proposition is shifting from ‘where is the safest place to store my money’ to also include ‘what is the most seamless and cost effective way to transfer and manage my money’. The once dominant financial institutions are seeing their power eroded by technologically enabled disrupters, leveraging off mobile solutions, data and APIs.
Somewhat surprisingly, one of the best examples of this trend can be found in Kenya. It is rare that the markets in which we invest harbor a best in class operator – particularly in disruptive sectors, and in a global context – but mobile network operator, Safaricom, is one exception. Through their mobile money network, M-PESA, they have almost single handedly brought more than 30 million Kenyans into the digital payments age, in what has been one of the world’s greatest advances in financial inclusion1.
M-PESA, as the name suggests (M = ‘mobile’; PESA = ‘money’ in Swahili) was one of the earliest mobile money products in an industry that has since ballooned to include more than 1 billion people globally, of which more than 50% are located in Sub-Saharan Africa2. The idea is simple – a digital wallet that is linked to a mobile phone. There are no banks involved. No account numbers. No etching your name onto the back of a card. An individual’s e-wallet links directly to their SIM, meaning a phone number is all that is needed to send and receive money.
If you lived in Kenya in 2005 there was a 70% chance you didn’t have a bank account3. Today, as an adult in Kenya, there is almost 100% chance that you have an M-PESA account and have transferred money digitally to somebody else in Kenya. In 2019, the total value of transactions that ran through M-PESA was almost 15% higher than Kenya’s entire $96 billion GDP. That is a whopping 8 billion unique transactions, or more than 150 transactions per person. For context, in the same year Germany recorded less than 60 cashless transactions per person4. Money enters and exists the M-PESA ecosystem through a network of ‘agents’, which mainly comprises authorized dealers, but also includes retailers such as petrol stations, supermarkets and registered SMEs. There are over 200,000 of these agents – that is more than every bank branch, ATM, currency exchange and microfinance institution in Kenya combined5.
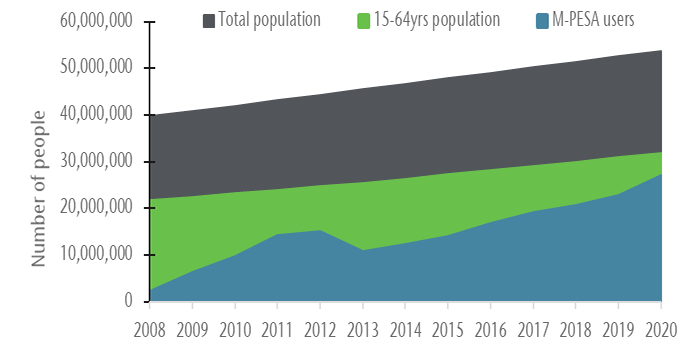
Note that Safaricom changed the definition of M-PESA users in 2013 from ‘Total Number of Users’ to ‘Users that have used M-PESA at least once in the last 30 days’. Under the former definition, there are over 30m M-PESA users today.
The early signs of M-PESA’s infiltration – and to some extent, redefinition – of the banking system are clear. Consider M-Shwari, an application built on M-PESA through which consumers can apply for up to KES 50,000 (roughly USD $450) in short-term loans. When M-Shwari launched in November 2012, approximately 700,000 Kenyans had an outstanding personal loan. Just three months later, M-Shwari had signed up a staggering 2.9 million customers, which rose to 5 million by the end of the year and almost 10 million a year later6. For the bank that underwrites the loans – NCBA Bank – just under 50% of all loans disbursed in 2019 were through M-Shwari 7.
KCB Bank has enjoyed similar success. Just one year after launching KCB M-PESA, an almost identical short-term loan product, their customer base had more than doubled to 9 million people. That is one of the largest banks in East Africa, having taken 115 years to amass its first 4 million customers, taking just 12 months to add 5 million more8. It is quite remarkable to witness even the most established, multi-centurial banks such as KCB sliding down the value chain of their own industry.
As fundamental investors, we assess the strength of our companies through an array of qualitative and quantitative methods. Sometimes, however, it can be just as useful analysis to employ a far simpler framework. History has consistently proven (across both capitalist and socialist systems) the old adage that money is power. Less discussed, albeit a slight subtlety, is the opposite. Power is money – the idea that those with influence and control can lever their advantage in order to benefit financially. For some companies, we can gauge this power quantitatively by analyzing the take rate – the percentage commission charged per transaction. There are a number of factors that go into the take rate, but generally those with a stronger grip on their respective industries are able to demand a higher rate.
In this context, it is worth remembering that fundamentally, M-PESA is nothing more than a digital distributor. Consumers pay a small fee in return for the ability to distribute money to any other M-PESA user in Kenya. For financial products such as M-Shwari and KCB M-PESA, the underwriting banks pay for the privilege of distributing their products through M-PESA. The chart below compares the take rate that M-PESA earns on these financial products with some of the largest physical and digital distributors in the world. It is a surprising data point, but one which undeniably evidences the power that M-PESA holds over the Kenyan banking sector.
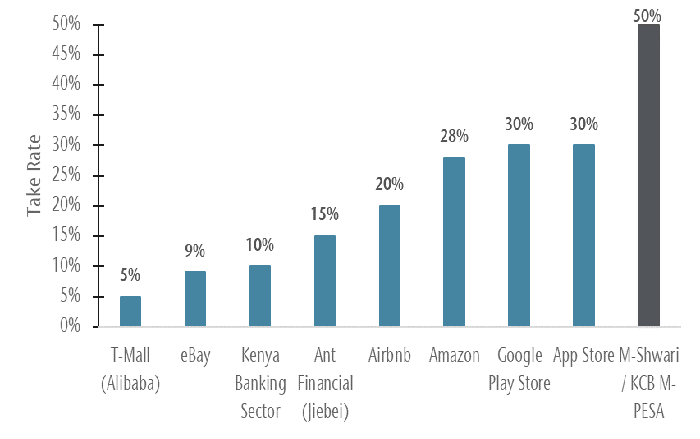
T-Mall includes fees for paying through AliPay. e-Bay is the blended rate for the US and international businesses. Kenya Banking Sector is calculated as the average yield for the last three years, adjusted for provisions for bad loans. Jiebei is an unsecured, consumer loan product. The rate given is on an annualized basis. Amazon is inclusive of 3P commissions, logistics fees and advertising fees.
What M-PESA has done for the financial development of Kenya has been nothing short of extraordinary. And what is most exciting is that we see this as just the start, the prelude to what is shaping up to be the most profound chapter of M-PESA’s story so far. As Ol’ Blue Eyes, Frank Sinatra, would say – “the best is yet to come”. M-PESA 2.0 will grow into its role as the core financial ecosystem in Kenya, and the global poster child for how technology and connectivity can expose the frailties of the modern banking system. We expect it will become much more than a convenient way to transfer money. Consumers will be able to pay for almost any good or service, settle bills and seamlessly send money from abroad; the government will collect taxes and pay public sector employees; banks will use it as their preferred channel to distribute credit, insurance and other financial products. Put another way, we believe M-PESA is on track to become the core provider of financial utility in Kenya.
We hasten to add that the next leg of M-PESA’s journey will not be all blue skies and rainbows. There will of course be storms ahead, as regulators and policy makers play catch up, and as the retail banking sector fights to stay relevant. Nevertheless, we are confident that M-PESA has what it takes to navigate these challenges successfully. Safaricom is, and has always been, our biggest bet. A company that from a small corner of Africa is spearheading one of the most powerful digital revolutions on the planet.
Vergent Asset Management
April 8, 2021
1. Source: Safaricom, company accounts
2. Understanding why mobile money has been so disproportionately successful in Africa could be the subject of another paper entirely, and we will refrain from doing it an injustice by skimming over the details here. For the curious reader, we highlight what we think have been the three key ingredients: i) markets that have low banking penetration; ii) economies that are heavily reliant on cash; iii) populations that exhibit high rural density.
3. Source: GSMA Report, 2015
4. Source: Deutsche Bundesbank data
5. Source: CBK data
6. Source: FSD Kenya
7. Source: NCBA company accounts; Safaricom company accounts
8. Source: KCB company accounts
DISCLAIMER
These materials (“Presentation”) are presented by Vergent Asset Management LLP <(“Vergent”)>. This Presentation is furnished on a confidential basis for informational and illustration purposes only. This Presentation is intended for the use of the recipient only and may not be reproduced or distributed to any other person, in whole or in part, without the prior written consent of Vergent.
Vergent Asset Management LLP is registered in England and Wales with its registered office address at 8th Floor, 1 Knightsbridge Green, London SW1X 7QA, United Kingdom (Companies House number OC418829) and is authorized and regulated by the Financial Conduct Authority (FRN: 791909).
This financial promotion is issued by Vergent Asset Management which is authorized and regulated by the Financial Conduct Authority (‘FCA’). Past performance is not indicative of future results. The value of your investment may go down as well as up and you may not receive upon redemption the full amount of your original investment.
THE PERFORMANCE PRESENTED HEREIN IS NOT INDICATIVE OF FUTURE RESULTS. The performance results contained herein are for informational purposes only, and are not meant to imply that Vergent’s trading programs will produce results similar to the performance results contained herein. There can be no assurance that Vergent or any account or product advised thereby will or is likely to achieve any results shown. There can be no assurance that such trading programs will make any profit at all or will be able to avoid incurring substantial losses. No representation is made that Vergent’s investment processes or investment objectives will or are likely to be successful or achieved.
Certain information contained in this Presentation is based on information obtained from third-party sources that Vergent considers to be reliable. However, Vergent makes no representation as to, and accepts no responsibility for, the accuracy, fairness or completeness of the information contained herein. The information is as of the date indicated and reflects present intention only. This information is subject to change at any time, and Vergent is under no obligation to provide you with any updates or amendments to this Presentation. The information contained in this Presentation is not complete and does not contain certain material information about the trading programs described herein, including important risk disclosures. Accordingly, this Presentation must be read in conjunction with, and is qualified in its entirety by, such other disclosure documentation as may be provided by Vergent from time to time in connection with a prospective investment. An investment in the strategy described herein may not be suitable for all clients, and before allocating any assets to the strategy or strategies, you should thoroughly review the terms and disclosures the strategy and consult with your professional advisor(s) to determine whether an investment in the strategy is suitable for you in light of your investment objectives and financial situation.
This Presentation may contain opinions pertaining to securities, financial products, transactions and investment strategies, and such opinions may differ from one to another. Any opinions, assumptions, assessments, statements, market commentary or the like (collectively, “Statements”) regarding past, current and/or future market conditions, themes, trends or events or which are forward-looking, including regarding portfolio characteristics and limits, constitute only subjective views, beliefs, outlooks, estimations or intentions of Vergent, should not be relied on, are subject to change due to a variety of factors, including fluctuating market conditions and economic factors, and involve inherent risks and uncertainties, both general and specific, many of which cannot be predicted or quantified and are beyond Vergent’s control. Future evidence and actual results could differ materially from those set forth in, contemplated by, or underlying these Statements, which are subject to change without notice. In light of these risks and uncertainties, there can be no assurance and no representation is given that these Statements are now, or will prove to be, accurate or complete in any way. Vergent undertakes no responsibility or obligation to revise or update such Statements. Statements expressed herein may not necessarily be shared by all personnel of Vergent. You acknowledge that you are capable of independently analyzing such Statements and the other information presented herein using your own expertise, due diligence and decision making, and you are solely responsible for any investment decisions made through your use of such Statements or other information and for any and all trading results achieved thereby, whether for your own account or on behalf of your clients.
This Presentation is not an offer to buy or sell, nor a solicitation of an offer to buy or sell any security or other financial instrument, or to invest assets in any account, advised by Vergent. An investment in any account advised by Vergent may be made only by qualified clients after receipt of formal investment management documentation and disclosures from Vergent, and only in those jurisdictions where permitted by law. Vergent’s investment strategies have management fees and operating expenses that would reduce returns to a client. Operating expenses include items such as custodial fees for segregated accounts and for pooled vehicles would also include charges for valuation, audit, tax and legal expenses. Such additional operating expenses would reduce the actual returns experienced by investors in segregated accounts and pooled vehicles. Any client must be able to bear the risks involved in any potential investment and must meet the suitability requirements relating to its participation in the Trading Programs.
Financial indices are shown for illustrative purposes only, may not be available for direct investment, are unmanaged, assume reinvestment of income, do not reflect the impact of any management or incentive fees and have limitations when used for comparison or other purposes because they may have different volatility or other material characteristics (such as number and types of instruments) than the investment strategies described herein. Vergent’s investment strategies are not restricted to the instruments comprising any one index.
Vergent is not and does not purport to be an advisor as to legal, taxation, accounting, financial or regulatory matters in any jurisdiction. The recipient should independently evaluate and judge the matters referred to in this Presentation. Net performance figures are stated after estimated management fees and transaction costs but before operating expenses. Operating expenses include items such as custodial fees for segregated accounts and for pooled vehicles would also include charges for valuation, audit, tax and legal expenses.
Third-party data providers
This report may contain information obtained from third parties including: Merrill Lynch, Pierce, Fenner & Smith Incorporated (BofAML), S&P Global Ratings, and MSCI.
Source: Merrill Lynch, Pierce, Fenner & Smith Incorporated (BofAML), used with permission. BofAML permits use of the BofAML indices related data on an “As Is” basis, makes no warranties regarding same, does not guarantee the suitability, quality, accuracy, timeliness, and/or completeness of the BofAML indices or any data included in, related to, or derived therefrom, assumes no liability in connection with the use of the foregoing, and does not sponsor, endorse, or recommend Vergent, or any of its products.
This may contain information obtained from third parties, including ratings from credit ratings agencies such as S&P Global Ratings. Reproduction and distribution of third party content in any form is prohibited except with the prior written permission of the related third party. Third party content providers do not guarantee the accuracy, completeness, timeliness or availability of any information, including ratings, and are not responsible for any errors or omissions (negligent orotherwise), regardless of the cause, or for the results obtained from the use of such content. THIRD PARTY CONTENT PROVIDERS GIVE NO EXPRESS OR IMPLIED WARRANTIES, INCLUDING, BUT NOT LIMITED TO, ANY WARRANTIES OF MERCHANTABILITY OR FITNESS FOR A PARTICULAR PURPOSE OR USE. THIRD PARTY CONTENT PROVIDERS SHALL NOT BE LIABLE FOR ANY DIRECT, INDIRECT, INCIDENTAL, EXEMPLARY, COMPENSATORY, PUNITIVE, SPECIAL OR CONSEQUENTIAL DAMAGES, COSTS, EXPENSES, LEGAL FEES, OR LOSSES (INCLUDING LOST INCOME OR PROFITS AND OPPORTUNITY COSTS OR LOSSES CAUSED BY NEGLIGENCE) IN CONNECTION WITH ANY USE OF THEIR CONTENT, INCLUDING RATINGS. Credit ratings are statements of opinions and are not statements of fact or recommendations to purchase, hold or sell securities. They do not address the suitability of securities or the suitability of securities for investment purposes, and should not be relied on as investment advice.
Source: MSCI. The MSCI information may only be used for your internal use, may not be reproduced or re-disseminated in any form and may not be used as a basis for or a component of any financial instruments or products or indices. MSCI makes no express or implied warranties or implied warranties or representations and shall have no liability whatsoever with respect to any MSCI data contained herein. This report is not approved, reviewed or produced by MSCI.
This week, Global Alpha is taking a look at one of the more remarkable consequences of the COVID-19 pandemic – the impact on the pet industry. Pets4Homes, the United Kingdom’s (UK) leading free pet classifieds and information site, produced a report on the UK pet trade. At the peak of the first lockdown last May, demand for puppies more than doubled. This is unsurprising given that 94% of pet owners said having the companion animal helped their mental health. Further, 86% said owning a pet improved their mental health, and 84% said having a pet made them less lonely. It is likely that prospective owners wanted to experience the benefits of owning a pet as well.
There were 420 prospective buyers for each puppy offered for sale in the Pets4Homes classifieds, and the average price of puppies for sale in 2020 was £1,875, an increase of 131% from the prior year. And we thought the residential housing market was hot! The demand for cats and kittens also rose during the pandemic, but the average price increased a more moderate 42% from 2019. However, this price dynamic also resulted in more unsavory aspects – the rise of online scams and thefts. Dog thefts increased 170% in the UK compared to 2019.
The supply and demand disconnect has eased somewhat since the peak in May 2020. Increased activity from breeders has helped the supply side of the equation, while gradually easing lockdowns and increased pet ownership has helped slow demand. COVID-19 has undoubtedly given a positive tailwind to a market that was already undergoing structural growth. In 2020, the population of cats and dogs reach 21 million, an increase of 1.4 million from 2017, which in turn increased the estimated market size to £7 billion. The trend of humanizing pets can be seen in the increase in average spending. Dog owners, for example, spend £80 a month on medical treatment, food and insurance. Also, 59% of dogs have some form of insurance, while cats sit slightly lower at 41%.
CVS Group (CVSG:LN), a core holding in the Global Alpha portfolios, is a leading vertically integrated vet services provider in the UK. As well as a large UK presence, CVS Group also operates practices in the Republic of Ireland and the Netherlands. The integrated nature of the business allows CVS group to provide services throughout the life cycle of a pet. The typical life expectancy of a dog is 12 years, while for a cat the life expectancy is between 14 and 17 years. This translates into a lifetime cost of pet ownership for a dog of £16,800, while for a cat, it is estimated at £8,800[1]. CVS Group offers first opinion practices, laboratory tests, specialist referral interventions, online food sales via Animed Direct, and compassionate end of life care and cremation services.
Consolidation of UK veterinary practices has been a significant feature of the market, yet the market is still fragmented. CVS Group is the second largest player by number of premises with over 450 in the UK. IVC Evidensia, a private company is Europe’s largest veterinary care provider, operating over 800 premises in the UK. CVS Group has completed eight acquisitions thus far in the financial year, which ends in June. The focus continues to be on small animals and the company states that the pipeline of acquisition opportunities is strengthening. With a strong balance sheet, CVS Group possesses the funds to continue this strategy.
Despite the strong share price performance over the past two years, valuation for CVS remains reasonable. According to Bloomberg, CVS Group is trading at 16.2 times 2021 EV/EBITDA. Meanwhile, according to press reports, a new round of financing for IVC Evidensia values the company at over €12 billion and at almost 30x forward EBITDA.
In a recent trading update, CVS Group continued to exhibit strong growth, driven by the core practices business, but also supplemented by very high growth from the online Animed Direct division. Vacancy rates for veterinary surgeons, the largest determinant of profitability, remain stable, meaning excellent growth at this level also. Around 40% of active small animal customers (430,000 customers), are signed up to the Healthy Pet Club. This service offers discounted products and services for a monthly fee.
To conclude, a rising number of pets, the continued humanization of companion animals and the increased value placed on their care, advancements in treatment and resulting in an extended average life, make the long-term dynamics of the pet market very appealing and Global Alpha continues to see CVS Group as well positioned to benefit.
[1] Pet Care – A Dog is For Life Charles Hall (Peel Hunt), March 22, 2021

Markets overview
Equity markets reached new highs this quarter as virus cases declined and market signals suggest that the global economic recovery remains strong (despite lockdowns). Support for the recovery has come in the form of monetary and fiscal stimulus and in March the US passed another significant fiscal package. This quarter the S&P/TSX Composite Index was up 8.1% and the MSCI World ex Canada (C$) advanced 3.5%. Stronger performance from the Canadian market reflects a higher weighting to cyclical sectors like energy, financials and industrials which have benefited from an acceleration in global growth expectations. Within equity markets value and small-cap stocks have outperformed which is a rotation away from areas that performed well for most of 2020.
Stocks led by economically sensitive segments
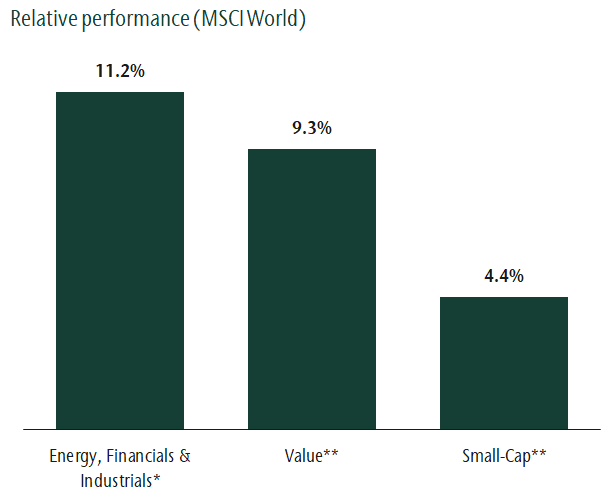
*Energy, financial and industrial sector average return less the average return of the remaining sectors. **Returns are relative to the growth and large-cap benchmarks, respectively, using corresponding MSCI World benchmarks. Quarterly return ending March 31, 2021. Source: MSCI, Refinitiv
Bond yields rise
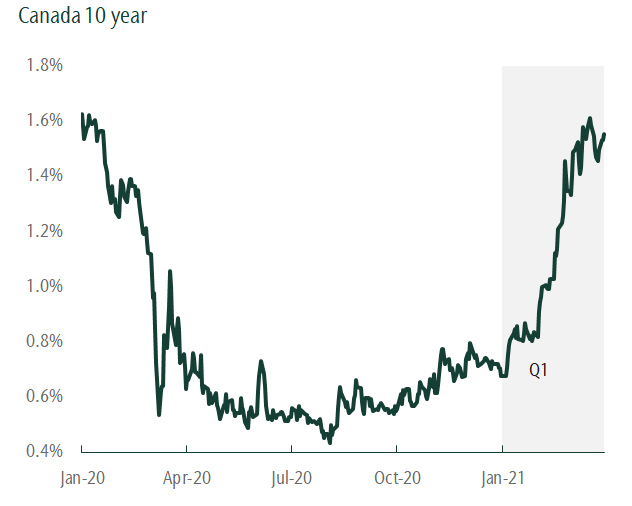
Stronger economic growth and accommodative policy led to a selloff in bonds and a spike in yields across maturities. The result of increased yields was a negative return for the FTSE Canada Universe Bond Index of -5.0%, the worst quarterly performance since the first quarter of 1994. Government and provincial bonds were most affected while declines in corporate were more muted.
Our thoughts
We believe the global economy and corporate earnings will continue to recover as more businesses gradually resume normal operations and government stimulus provides continued support. Portfolios are positioned to benefit from this improving outlook. As such, our asset mix positioning remains overweight equities. However, strong performance from equities relative to bonds led us to rebalance this quarter to maintain our desired exposure. Within equities we have an overweight to small-cap stocks and maintain an allocation to value stocks. This quarter we also increased our emerging markets position. Within bonds, allocations to short bonds and high yield have protected portfolios in a period of rising yields. This asset mix positioning has served us well this quarter and remains attractive in the current environment.
Our portfolio management teams have selectively positioned portfolios to more cyclical assets that are expected to benefit from continued improvements in the economy. Our equity teams have taken gains in some businesses that have benefited from COVID-19 and bought companies that can outperform in a more positive investment environment. This includes companies within the financial sector as well as the travel and leisure industry. Within bond portfolios we are overweight credit, inflation-protected debt and have lower sensitivity in the portfolio to changes in yield. Although our overall positioning in portfolios reflects a positive outlook we remained well diversified.
From the desk of Jeff Guise, Managing Director, Chief Investment Officer, CC&L Private Capital.
This post is for information only and is not intended as investment advice. The views expressed are those of the author at the time of publication and are subject to change at any time.
The strategy continues to be focused on identifying transformational growth companies in the Frontier and smaller Emerging markets. Africa and Asia today represent ~90% of invested capital and the strategy owns or has previously owned companies in CEE, CIS, and the Middle East. Thematically, we’re primarily invested in the three following areas:
- Financial inclusion and the development of the digital payments eco-system (i.e.: disruption of cash) via companies operating across a variety of sectors including in banks/microfinance, communications/media/mobile money, and software
- Rising health and wellness awareness which we express through consumer health companies selling niche FMCG and healthcare providers offering medical services to their customers
- The formalization of offline retail with a focus on the grocery and DIY category where our retailers have a large Omni-channel advantage over pure online competition as well as a scale and cost advantage over unorganized/traditional competition
Underpinning our confidence in these themes are the large addressable markets wherein our companies operate, the fragmented and weaker level of competition, and the quality of the management teams which run them (many of whom are also owners).
We highlight two such companies in this quarter’s letter.
MTN Ghana (MTNG) – the $1.8bn market cap company embodies the frontier equity story as well as any in our portfolio. MTNG is the leading telecom service provider in the West African nation of Ghana with over 24 million subscribers and a leading market share in voice (55%) and data (72%). However, what gets us excited about MTNG is “Momo”, the company’s mobile money business which is at the forefront of the digitalization of cash in the country. Similar to Mpesa in Kenya, Momo is already the winner in its market with a 98% share of all mobile money transactions and an active base of 10.2 million wallets in the country. Momo’s contribution to MTNG’s revenue has increased by ~350bps in the last two years to reach 21% in 2020. We see Momo’s growth coming from several areas including structural adoption of mobile money for peer-to-peer transfers as well as growth in value added use cases in the areas of remittances, loans and savings, and merchant services. Despite it being a $1bn+ revenue business with returns on invested capital of ~25% and an exciting fast growing fintech business, MTNG is not covered by the sell side community. This is perhaps because Ghana as a market is unclassified by MSCI and so is neither a frontier nor an emerging market by the index provider’s standards. On the buy side, many institutional investors will access MTNG via its parent company MTN Group out of South Africa, a sub-optimal way considering the multi-country operation of the parent co. This has presented us with a unique opportunity to directly own MTNG at ~5x price to earnings over the last two years. Even after a strong re-rating year-to-date, the stock is still trading below 7.5x trail 12m earnings with a dividend yield of +8%.
Unicharm Indonesia (UCID) – the $480m market cap company is the leading baby diaper and female sanitary brand in the country of ~250m people. Indonesia has one of the lowest penetration rates of baby diaper products in the world yet is expected to generate the second biggest growth in value terms in Asia Pacific after China. This is driven by demographics (over 4 million babies are born every year in Indonesia) and higher penetration rates driven by investments in innovation and distribution (UCID sells single diapers in certain retail channels to make the product affordable). UCID has nearly 47% of the baby diapers market in Indonesia which makes it almost 2x larger than its nearest competitor which puts it in a strong position to capture the growth in the market over the long term. UCID is also the market leader in sanitary female products and adult diapers which are high margin categories given competitive intensity is lower and premiumization opportunities larger (relative to baby diapers). While the top down opportunity is attractive, UCID has low operating margins compared to global peers. We attribute this mainly to the baby diaper category where consumers prioritize price over quality; consumers in Indonesia are predominantly price driven in their choices across most FMCG products and a high percentage of the target market (parents) still view baby diapers as a discretionary product. We do not foresee a change in consumer preferences in the near term in light of the impact that Covid-19 has inflicted on purchasing power. That being said, we are still expecting margins to trend upwards as the recent entry of Kimberly Clark via the acquisition of UCID’s main competitor Sofitex is likely to bring more pricing discipline to the market by way of lower promotional activity (note: the acquisition of Sofitex was done at 3x EV/Sales compared to 0.5x EV/Sales for UCID which on its own is an indication of the undervaluation present in the shares of UCID today). As the Indonesian economy reopens, we expect UCID’s general trade channel to also open up and offer another tailwind to margins over the next two years as the company earns a higher net price compared to the modern channel which is dominated by established mini market chains. We also see the development of the e-commerce channel as potentially positive for UCID’s margins as that targets a more affluent consumer base that buys more (volume) and better (quality). We’ve increased exposure to UCID over the last month having been encouraged by latest commentary from management on the competitive dynamics in the market following the entry of Kimberly Clark which we believe is a key catalyst for the thesis.
In conclusion:
The opportunity set for the strategy continues to be attractive despite the visible underperformance relative to emerging markets. A recent FT column by Simon Edelsten brought to light a phenomenon we’ve been talking about for some time: almost 2/3rd of the MSCI EM is in three countries (China, South Korea, and Taiwan) that have “emerged” if one judges by income levels, demographics, and market efficiency to paraphrase the article. In that light, we continue to see the frontier and emerging markets in which we specialize as a truer reflection of the classic emerging market story. Translating that opportunity to returns is still about selecting the right stocks for the long term and we believe our portfolio reflects that in its current composition.
Vergent Asset Management LLP
DISCLOSURES