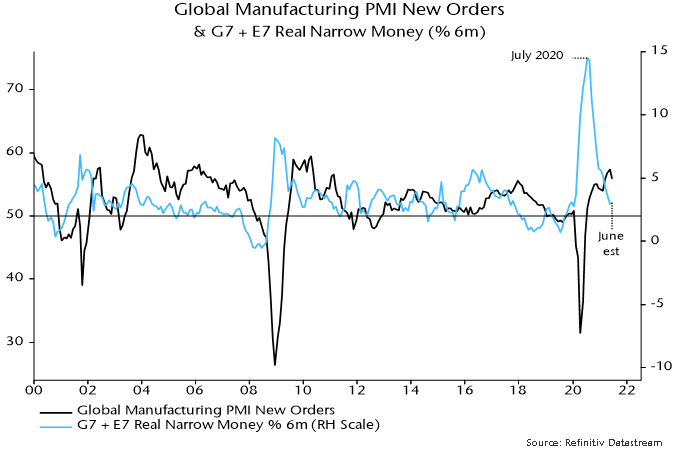
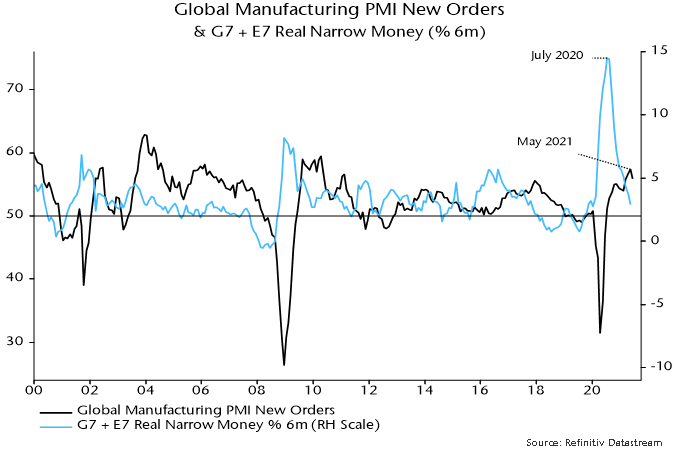
Global six-month real narrow money growth appears to have moved sideways in June and could be bottoming after a 10-month slide. If confirmed, and allowing for the usual lead time, this would suggest a stabilisation of industrial momentum in early 2022 following a H2 2021 slowdown.
The June real narrow money growth estimate is based on monetary data covering 70% of the G7 plus E7 aggregate tracked here and near-complete inflation numbers. The prior fall in real money growth is expected to be reflected in “surprising” weakness in global PMI manufacturing new orders and other coincident indicators of industrial momentum during H2 2021 – see chart 1.
Chart 1
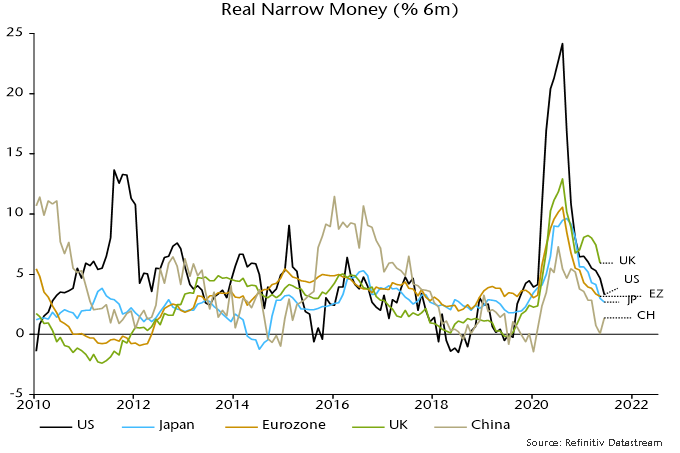
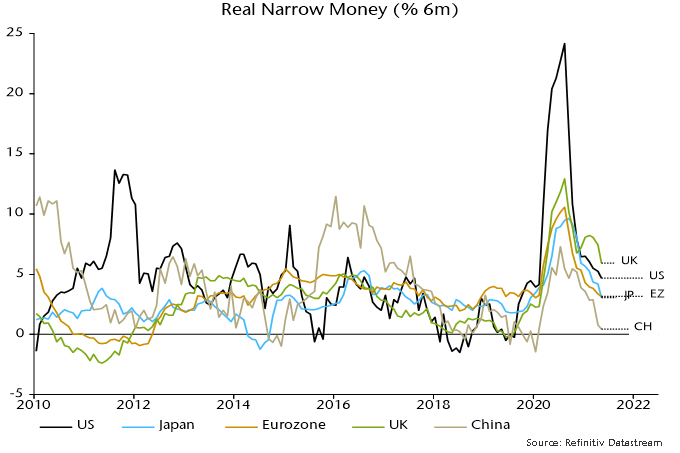
Global stabilisation conceals a June recovery in Chinese six-month real narrow money growth offset by further slowdowns in the US and Japan, with European data yet to be released – chart 2.
Chart 2
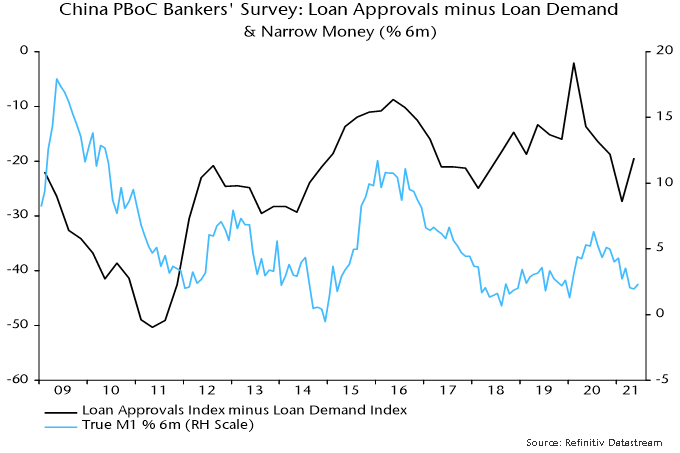
The recent cut in reserve requirements is judged here to confirm a trend shift in Chinese monetary policy, probably heralding a sustained rebound in money growth. Another indication of a policy turn is a rise in the differential between the loan approvals and loan demand indices in the PBoC Q2 bankers’ survey, suggesting that banks have been instructed to loosen credit – chart 3.
Chart 3
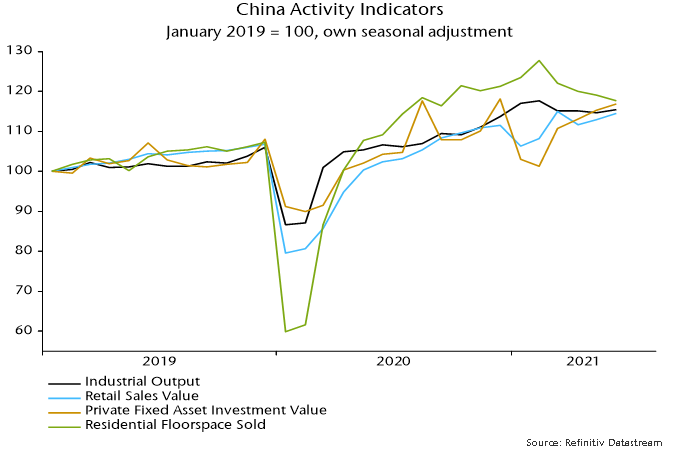
Street claims that last week’s Chinese activity data were solid, implying no need to adjust policy settings, are puzzling. GDP grew by only 3.4% annualised between Q4 and Q2. Monthly indicators are stagnant in real seasonally adjusted level terms – chart 4.
Chart 4
The view here is that the economy faced a “hard landing” without a policy change but the authorities have recognised the risk and will act to avert it.
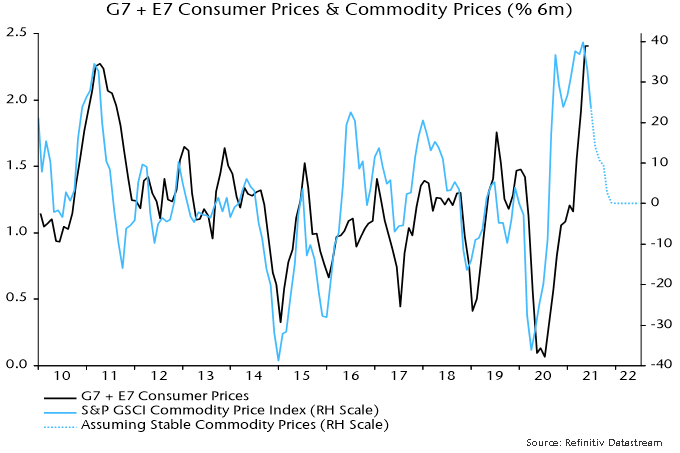
Support to global real money growth from Chinese easing should be supplemented by a slowdown in global six-month CPI inflation in H2, assuming stable commodity prices – chart 5. Commodity prices could weaken as industrial activity decelerates.
Chart 5
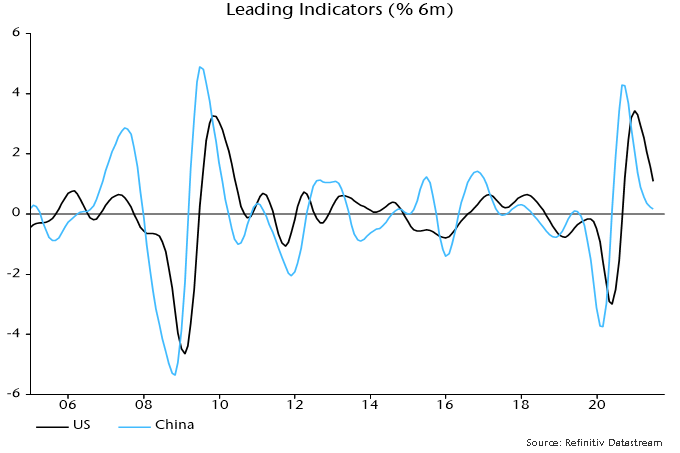
China continues to lead US / global economic momentum. The six-month rate of change of the OECD’s US leading indicator peaked four months after that of a Chinese indicator – chart 6*. This fits with a four-month interval between peaks in 10-year government bond yields – November in China, March in the US.
Chart 6
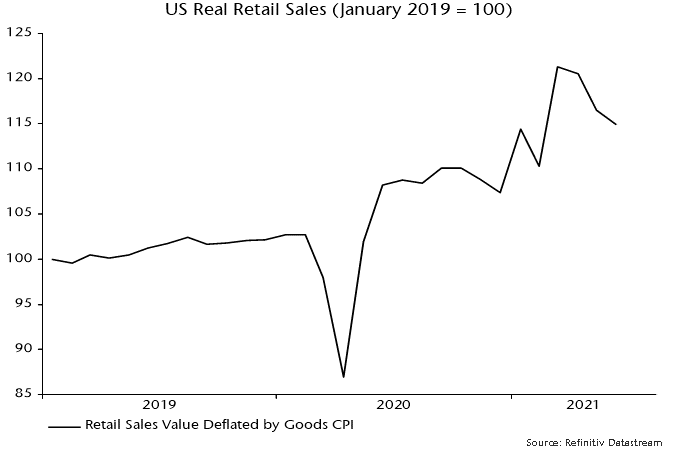
Street descriptions of US June retail sales as “robust” are also questionable. With prices surging, sales fell for a third month in real terms, consisent with a fading boost from March / April stimulus payments – chart 7.
Chart 7
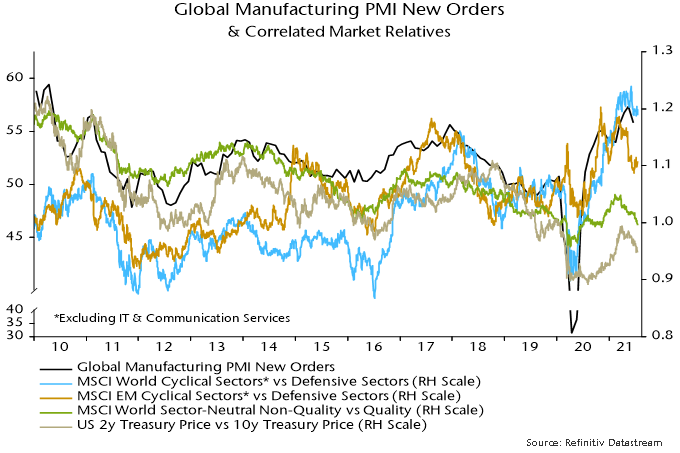
Markets have already partially discounted a H2 economic slowdown, with quality stocks outperforming and bullish flattening of yield curves. Non-tech cyclical sectors of developed equity markets have so far held up against defensive sectors and could be the next shoe to drop – chart 8.
Chart 8
*The indicators shown use the OECD’s methodology but are calculated independently.
This strategy and any associated investments are only available to professional investors and eligible counterparties, as defined in the rules of the UK Financial Conduct Authority. This communication is not being made to, and should not be relied upon by, persons who are retail clients for FCA regulatory purposes. Vergent Asset Management LLP is not authorised by the FCA to deal with retail clients.
The strategy continues to be rewarded for the thesis we’ve built around technology, payments, and financial inclusion in our markets. The starting point for us in that process was the mobile money opportunity in East Africa which continues to be best exemplified by Kenya’s Safaricom’s M-Pesa. Over time, we built a deeper understanding of the payments value chain which helped us identify infrastructure players like Morocco’s Hightech Payment Systems which was an early investment in the life of the strategy. We also broadened the geographical scope of the thesis by expanding our core mobile money thesis towards West Africa into Ghana with MTN’s exciting Momo business which is now starting to get the attention it deserves from the market. We also benefited from the deepening opportunity set in the sector with transformational companies like Kazakhstan’s Kaspi.Kz coming to market last year. Our financial inclusion theme extended to microfinance companies like Bank BTPN Syariah in Indonesia which provides micro loans to nearly four million women entrepreneurs in rural Indonesia. BTPN Syariah has a fantastic opportunity to go from an offline centric credit disbursement and collection model into an Omni-channel offering that will help scale the business whilst improving the level of service they provide customers. Our initial thesis has evolved and strengthened since we started investing in the sector; financial inclusion and digital transformation has become a regulatory priority and the pandemic has only helped accelerate adoption and usage among consumers. Moreover, the companies we’ve invested in are constantly evolving with Kaspi.Kz continuing to add new services to its super app that counts over half of Kazakhstan’s population as active users and M-Pesa accelerating its transformation from a peer-to-peer USSD based service into a full-fledged lifestyle and financial services platform servicing ~25 million Kenyan consumers and ~300k merchants. Another factor that we must acknowledge has changed over the last two years is the valuations have re-rated for the broader sector both in the public and private markets. What reassures us on that front are four key points:
The aforementioned companies and others we own in the sector are all profitable
Their balance sheets are unlevered and in most cases net cash
They trade at reasonable multiples relative to the sector in developed markets (albeit at a premium to the rest of the portfolio) and private markets. In fact, no one company we’ve invested in currently trades on a P/E ratio that is in excess of 30x 2022 earnings. Note our emphasis on price to earnings ratio means all of our companies are bottom line profitable
The growth profile and optionality embedded in these business models means that the multiples we see on near term earnings will burn off fairly quickly in the next five years
Away from payments and technology, the strategy also experienced strong returns in the period from our retail portfolio in Morocco and the Philippines. In Morocco, the vaccination rollout program has been very successful with over 18m doses administered as of the date of writing (Morocco’s total population is ~36 million of which 27% is under the age of 15). This has bolstered the outlook for sales at Label Vie, the operator of the largest supermarket chain in the country under license from France’s Carrefour. Label Vie also operates the largest cash & carry format stores in the country under the Atacadao brand, a Brazilian concept brand also owned by Carrefour which caters to professional buyers and households. The reason for our optimism on the company’s short term prospects comes from the potential return of the hospitality channel as Morocco reopens to European tourism. Prior to the pandemic, a quarter of Atacadao’s sales came from the hospitality channel and we expect that some of that will start to show in sales over the next few quarters. Longer term, our bullish thesis on Label Vie is underpinned by the broader modern retail sector’s development and management team’s aggressive expansion strategy which is focused on scaling several formats including supermarkets (~700sqm), minimarkets (~200sqm), and Atacadao. It is worth nothing that Label Vie’s management is also investing in building an online presence in Morocco through “Bringo”, a Romanian online grocery concept that is also owned by Carrefour. Morocco is a very nascent market for online (~1% of retail sales) and according to our channel checks has not experienced the same step change in online shopping habits that other markets have experienced since the onset of the pandemic. This gives Label Vie an opportunity to build out its online channel thoughtfully by adapting its offerings and fulfillment strategy to local tastes and dynamics. We were encouraged by management’s receptiveness to our recommendations in this area and expect to continue to engage with them as they build out their online model. In the Philippines, we are seeing early signs of a recovery as vaccinations begin to pick up pace. Encouraged by that progress, we made an investment in a leading home improvement retailer that we believe will benefit tremendously from the return in construction spending and home renovation activity. It is worth nothing that unlike in other markets in the world, construction activity has been largely suppressed in the Philippines since the pandemic started in March of last year as a result of strict social distancing measures at the local and federal level.
In our last letter, we made a case for investors to think differently about how they approach emerging markets. We argued that many of the largest constituent countries of emerging market indices have reached levels of economic development, regulatory cycle, and market efficiency that makes them comparable to developed markets. We continue to advocate that the true emerging market opportunity today lies in the next generation of emerging markets like Egypt, Indonesia, Kenya, Pakistan, and Vietnam. Today, those market offer up a unique combination of a large, young and rapidly urbanizing consumer base that is increasingly connected but still not served in the same way their counterparts in more developed countries are. Our job is to find public companies that are able to fill that gap by offering services directly to those customers (B2C) or by enabling other businesses to offer those services to customers (B2B2C). That gap represents a substantial economic and social profit opportunity for well run businesses in which the strategy is generously invested.
Vergent Asset Management LLP
DISCLOSURES
1. Unless otherwise stated, all data is at June 30, 2021 and stated in US dollars (US$). Source: Connor, Clark & Lunn Financial Group, Thomson Reuters Datastream.
2. Performance history for the Vergent Emerging Opportunities Strategy is that of the Vergent Emerging Opportunities Composite. The Composite has an inception and creation date of August 2018.
3. Net performance figures are stated after management fees, estimated performance fees, trading expenses and before operating expenses. Operating expenses include items such as custodial fees for pooled vehicles and would also include charges for valuation, audit, tax and legal expenses. Such additional operating expenses would reduce the actual returns experienced by investors. Past performance of the strategy is no guarantee of future performance; Future returns are not guaranteed and a loss of capital may occur. For illustrative purposes, performance fee of 20% on added value over the hurdle rate of 6% plus the management fee of 1.25% have been assumed. Actual management fees charged to a particular account may vary.
4. There is no benchmark for the Vergent Emerging Opportunities Strategy because it has an absolute return objective
5. Standard Deviation measures the dispersion of monthly returns since the inception of the strategy.
Benchmarks and financial indices are shown for illustrative purposes only, are not available for direct investment, are unmanaged, assume reinvestment of income, do not reflect the impact of any management or incentive fees and have limitations when used for comparison or other purposes because they may have different volatility or other material characteristics (such as number and types of instruments) than the Strategy. The Strategy’s investments are not restricted to the instruments comprising any one index and do not in all cases correspond to the investments reflected in such indices.
These materials (“Presentation”) are furnished by Vergent Asset Management (“Vergent”) on a confidential basis for informational and illustration purposes only. This Presentation is intended for the use of the recipient only and may not be reproduced or distributed to any other person, in whole or in part, without the prior written consent of Vergent. Certain information contained in this Presentation is based on information obtained from third-party sources that Vergent considers to be reliable. However, Vergent makes no representation as to, and accepts no responsibility for, the accuracy, fairness or completeness of the information contained herein. The information is as of the date indicated and reflects present intention only. This information may be subject to change at any time, and Vergent is under no obligation to provide you with any updates or amendments to this Presentation. This Presentation is not an offer to buy or sell, nor a solicitation of an offer to buy or sell any security or other financial instrument advised by Vergent. This Presentation does not contain certain material information about the strategy, including important risk disclosures. An investment in the strategy is not suitable for all investors, and before making an investment in the strategy, you should consult with your professional advisor(s) to determine whether an investment in the strategy is suitable for you in light of your investment objectives and financial situation. Vergent does not purport to be an advisor as to legal, taxation, accounting, financial or regulatory matters in any jurisdiction, and the recipient should independently evaluate and judge the matters referred to in this Presentation. Vergent Asset Management LLP is registered in England and Wales with its registered office address at 8th Floor, 1 Knightsbridge Green, London SW1X 7QA, United Kingdom (Companies House number OC418829) and is authorized and is an Exempt Reporting Adviser in the USA. It is regulated by the Financial Conduct Authority (FRN: 791909).
THIRD-PARTY DATA PROVIDERS
This report may contain information obtained from third parties including: Merrill Lynch, Pierce, Fenner & Smith Incorporated (BofAML), S&P Global Ratings, and MSCI. Source: Merrill Lynch, Pierce, Fenner & Smith Incorporated (BofAML), used with permission. BofAML permits use of the BofAML indices related data on an “As Is” basis, makes no warranties regarding same, does not guarantee the suitability, quality, accuracy, timeliness, and/or completeness of the BofAML indices or any data included in, related to, or derived therefrom, assumes no liability in connection with the use of the foregoing, and does not sponsor, endorse, or recommend CC&L Canada, or any of its products. This may contain information obtained from third parties, including ratings from credit ratings agencies such as S&P Global Ratings. Reproduction and distribution of third party content in any form is prohibited except with the prior written permission of the related third party. Third party content providers do not guarantee the accuracy, completeness, timeliness or availability of any information, including ratings, and are not responsible for any errors or omissions (negligent or otherwise), regardless of the cause, or for the results obtained from the use of such content. THIRD PARTY CONTENT PROVIDERS GIVE NO EXPRESS OR IMPLIED WARRANTIES, INCLUDING, BUT NOT LIMITED TO, ANY WARRANTIES OF MERCHANTABILITY OR FITNESS FOR A PARTICULAR PURPOSE OR USE. THIRD PARTY CONTENT PROVIDERS SHALL NOT BE LIABLE FOR ANY DIRECT, INDIRECT, INCIDENTAL, EXEMPLARY, COMPENSATORY, PUNITIVE, SPECIAL OR CONSEQUENTIAL DAMAGES, COSTS, EXPENSES, LEGAL FEES, OR LOSSES (INCLUDING LOST INCOME OR PROFITS AND OPPORTUNITY COSTS OR LOSSES CAUSED BY NEGLIGENCE) IN CONNECTION WITH ANY USE OF THEIR CONTENT, INCLUDING RATINGS. Credit ratings are statements of opinions and are not statements of fact or recommendations to purchase, hold or sell securities. They do not address the suitability of securities or the suitability of securities for investment purposes, and should not be relied on as investment advice.
Source: MSCI. The MSCI information may only be used for your internal use, may not be reproduced or re-disseminated in any form and may not be used as a basis for or a component of any financial instruments or products or indices. MSCI makes no express or implied warranties or implied warranties or representations and shall have no liability whatsoever with respect to any MSCI data obtained herein. This report is not approved, reviewed or produced by MSCI.
This strategy and any associated investments are only available to professional investors and eligible counterparties, as defined in the rules of the UK Financial Conduct Authority. This communication is not being made to, and should not be relied upon by, persons who are retail clients for FCA regulatory purposes. Vergent Asset Management LLP is not authorised by the FCA to deal with retail clients.
The strategy continues to be rewarded for the thesis we’ve built around technology, payments, and financial inclusion in our markets. The starting point for us in that process was the mobile money opportunity in East Africa which continues to be best exemplified by Kenya’s Safaricom’s M-Pesa. Over time, we built a deeper understanding of the payments value chain which helped us identify infrastructure players like Morocco’s Hightech Payment Systems which was an early investment in the life of the strategy. We also broadened the geographical scope of the thesis by expanding our core mobile money thesis towards West Africa into Ghana with MTN’s exciting Momo business which is now starting to get the attention it deserves from the market. We also benefited from the deepening opportunity set in the sector with transformational companies like Kazakhstan’s Kaspi.Kz coming to market last year. Our financial inclusion theme extended to microfinance companies like Bank BTPN Syariah in Indonesia which provides micro loans to nearly four million women entrepreneurs in rural Indonesia. BTPN Syariah has a fantastic opportunity to go from an offline centric credit disbursement and collection model into an Omni-channel offering that will help scale the business whilst improving the level of service they provide customers. Our initial thesis has evolved and strengthened since we started investing in the sector; financial inclusion and digital transformation has become a regulatory priority and the pandemic has only helped accelerate adoption and usage among consumers. Moreover, the companies we’ve invested in are constantly evolving with Kaspi.Kz continuing to add new services to its super app that counts over half of Kazakhstan’s population as active users and M-Pesa accelerating its transformation from a peer-to-peer USSD based service into a full-fledged lifestyle and financial services platform servicing ~25 million Kenyan consumers and ~300k merchants. Another factor that we must acknowledge has changed over the last two years is the valuations have re-rated for the broader sector both in the public and private markets. What reassures us on that front are four key points:
The aforementioned companies and others we own in the sector are all profitable
Their balance sheets are unlevered and in most cases net cash
They trade at reasonable multiples relative to the sector in developed markets (albeit at a premium to the rest of the portfolio) and private markets. In fact, no one company we’ve invested in currently trades on a P/E ratio that is in excess of 30x 2022 earnings. Note our emphasis on price to earnings ratio means all of our companies are bottom line profitable
The growth profile and optionality embedded in these business models means that the multiples we see on near term earnings will burn off fairly quickly in the next five years
Away from payments and technology, the strategy also experienced strong returns in the period from our retail portfolio in Morocco and the Philippines. In Morocco, the vaccination rollout program has been very successful with over 18m doses administered as of the date of writing (Morocco’s total population is ~36 million of which 27% is under the age of 15). This has bolstered the outlook for sales at Label Vie, the operator of the largest supermarket chain in the country under license from France’s Carrefour. Label Vie also operates the largest cash & carry format stores in the country under the Atacadao brand, a Brazilian concept brand also owned by Carrefour which caters to professional buyers and households. The reason for our optimism on the company’s short term prospects comes from the potential return of the hospitality channel as Morocco reopens to European tourism. Prior to the pandemic, a quarter of Atacadao’s sales came from the hospitality channel and we expect that some of that will start to show in sales over the next few quarters. Longer term, our bullish thesis on Label Vie is underpinned by the broader modern retail sector’s development and management team’s aggressive expansion strategy which is focused on scaling several formats including supermarkets (~700sqm), minimarkets (~200sqm), and Atacadao. It is worth nothing that Label Vie’s management is also investing in building an online presence in Morocco through “Bringo”, a Romanian online grocery concept that is also owned by Carrefour. Morocco is a very nascent market for online (~1% of retail sales) and according to our channel checks has not experienced the same step change in online shopping habits that other markets have experienced since the onset of the pandemic. This gives Label Vie an opportunity to build out its online channel thoughtfully by adapting its offerings and fulfillment strategy to local tastes and dynamics. We were encouraged by management’s receptiveness to our recommendations in this area and expect to continue to engage with them as they build out their online model. In the Philippines, we are seeing early signs of a recovery as vaccinations begin to pick up pace. Encouraged by that progress, we made an investment in a leading home improvement retailer that we believe will benefit tremendously from the return in construction spending and home renovation activity. It is worth nothing that unlike in other markets in the world, construction activity has been largely suppressed in the Philippines since the pandemic started in March of last year as a result of strict social distancing measures at the local and federal level.
In our last letter, we made a case for investors to think differently about how they approach emerging markets. We argued that many of the largest constituent countries of emerging market indices have reached levels of economic development, regulatory cycle, and market efficiency that makes them comparable to developed markets. We continue to advocate that the true emerging market opportunity today lies in the next generation of emerging markets like Egypt, Indonesia, Kenya, Pakistan, and Vietnam. Today, those market offer up a unique combination of a large, young and rapidly urbanizing consumer base that is increasingly connected but still not served in the same way their counterparts in more developed countries are. Our job is to find public companies that are able to fill that gap by offering services directly to those customers (B2C) or by enabling other businesses to offer those services to customers (B2B2C). That gap represents a substantial economic and social profit opportunity for well run businesses in which the strategy is generously invested.
Vergent Asset Management LLP
DISCLOSURES
1. Unless otherwise stated, all data is at June 30, 2021 and stated in US dollars (US$). Source: Connor, Clark & Lunn Financial Group, Thomson Reuters Datastream.
2. Performance history for the Vergent Emerging Opportunities Strategy is that of the Vergent Emerging Opportunities Composite. The Composite has an inception and creation date of August 2018.
3. Net performance figures are stated after management fees, estimated performance fees, trading expenses and before operating expenses. Operating expenses include items such as custodial fees for pooled vehicles and would also include charges for valuation, audit, tax and legal expenses. Such additional operating expenses would reduce the actual returns experienced by investors. Past performance of the strategy is no guarantee of future performance; Future returns are not guaranteed and a loss of capital may occur. For illustrative purposes, performance fee of 20% on added value over the hurdle rate of 6% plus the management fee of 1.25% have been assumed. Actual management fees charged to a particular account may vary.
4. There is no benchmark for the Vergent Emerging Opportunities Strategy because it has an absolute return objective
5. Standard Deviation measures the dispersion of monthly returns since the inception of the strategy.
Benchmarks and financial indices are shown for illustrative purposes only, are not available for direct investment, are unmanaged, assume reinvestment of income, do not reflect the impact of any management or incentive fees and have limitations when used for comparison or other purposes because they may have different volatility or other material characteristics (such as number and types of instruments) than the Strategy. The Strategy’s investments are not restricted to the instruments comprising any one index and do not in all cases correspond to the investments reflected in such indices.
These materials (“Presentation”) are furnished by Vergent Asset Management (“Vergent”) on a confidential basis for informational and illustration purposes only. This Presentation is intended for the use of the recipient only and may not be reproduced or distributed to any other person, in whole or in part, without the prior written consent of Vergent. Certain information contained in this Presentation is based on information obtained from third-party sources that Vergent considers to be reliable. However, Vergent makes no representation as to, and accepts no responsibility for, the accuracy, fairness or completeness of the information contained herein. The information is as of the date indicated and reflects present intention only. This information may be subject to change at any time, and Vergent is under no obligation to provide you with any updates or amendments to this Presentation. This Presentation is not an offer to buy or sell, nor a solicitation of an offer to buy or sell any security or other financial instrument advised by Vergent. This Presentation does not contain certain material information about the strategy, including important risk disclosures. An investment in the strategy is not suitable for all investors, and before making an investment in the strategy, you should consult with your professional advisor(s) to determine whether an investment in the strategy is suitable for you in light of your investment objectives and financial situation. Vergent does not purport to be an advisor as to legal, taxation, accounting, financial or regulatory matters in any jurisdiction, and the recipient should independently evaluate and judge the matters referred to in this Presentation. Vergent Asset Management LLP is registered in England and Wales with its registered office address at 8th Floor, 1 Knightsbridge Green, London SW1X 7QA, United Kingdom (Companies House number OC418829) and is authorized and is an Exempt Reporting Adviser in the USA. It is regulated by the Financial Conduct Authority (FRN: 791909).
THIRD-PARTY DATA PROVIDERS
This report may contain information obtained from third parties including: Merrill Lynch, Pierce, Fenner & Smith Incorporated (BofAML), S&P Global Ratings, and MSCI. Source: Merrill Lynch, Pierce, Fenner & Smith Incorporated (BofAML), used with permission. BofAML permits use of the BofAML indices related data on an “As Is” basis, makes no warranties regarding same, does not guarantee the suitability, quality, accuracy, timeliness, and/or completeness of the BofAML indices or any data included in, related to, or derived therefrom, assumes no liability in connection with the use of the foregoing, and does not sponsor, endorse, or recommend CC&L Canada, or any of its products. This may contain information obtained from third parties, including ratings from credit ratings agencies such as S&P Global Ratings. Reproduction and distribution of third party content in any form is prohibited except with the prior written permission of the related third party. Third party content providers do not guarantee the accuracy, completeness, timeliness or availability of any information, including ratings, and are not responsible for any errors or omissions (negligent or otherwise), regardless of the cause, or for the results obtained from the use of such content. THIRD PARTY CONTENT PROVIDERS GIVE NO EXPRESS OR IMPLIED WARRANTIES, INCLUDING, BUT NOT LIMITED TO, ANY WARRANTIES OF MERCHANTABILITY OR FITNESS FOR A PARTICULAR PURPOSE OR USE. THIRD PARTY CONTENT PROVIDERS SHALL NOT BE LIABLE FOR ANY DIRECT, INDIRECT, INCIDENTAL, EXEMPLARY, COMPENSATORY, PUNITIVE, SPECIAL OR CONSEQUENTIAL DAMAGES, COSTS, EXPENSES, LEGAL FEES, OR LOSSES (INCLUDING LOST INCOME OR PROFITS AND OPPORTUNITY COSTS OR LOSSES CAUSED BY NEGLIGENCE) IN CONNECTION WITH ANY USE OF THEIR CONTENT, INCLUDING RATINGS. Credit ratings are statements of opinions and are not statements of fact or recommendations to purchase, hold or sell securities. They do not address the suitability of securities or the suitability of securities for investment purposes, and should not be relied on as investment advice.
Source: MSCI. The MSCI information may only be used for your internal use, may not be reproduced or re-disseminated in any form and may not be used as a basis for or a component of any financial instruments or products or indices. MSCI makes no express or implied warranties or implied warranties or representations and shall have no liability whatsoever with respect to any MSCI data obtained herein. This report is not approved, reviewed or produced by MSCI.
As we write this commentary, the first half of the year is behind us and most stock indices are at all-time highs. Earlier in the year, an inflation scare drove the United States (US) 10-year Treasury yield to 1.74% with a small correction in growth assets like those listed on the Nasdaq. It seems the market has decided to follow the cues of the US Federal Reserve (Fed) that inflation will be transitory, once the effects of the pandemic, the pent-up demand and the disruptions to the supply chain are behind us. Since March 5, equity markets have been roaring back and the 10-year Treasury yield is now range-bound at around 1.5%. Inflation numbers, however, continue to rise.
What do we think at Global Alpha? Unfortunately, we do not have a crystal ball, nor have we reached a consensus amongst ourselves. However, we believe the risk that inflation will be sustainably higher than the target of 2% established the Fed and many central banks is high.
The table below shows the prices of various commodities. Many would argue that 2020 was an outlier. That is why we based our comparison on 2019, which was a normal year with a strong economy. The numbers are self-explanatory. In many cases, prices are at multi-year highs. Copper is now at its highest level since 2011, and reached an all-time record this quarter, as did lumber.
Price of (in US$)
June 28, 2019
June 30, 2020
June 30, 2021
% increase over 2019
Oil (Bbl)
58.47
39.27
73.90
26%
Natural Gas (Mcf)
2.31
1.75
3.65
58%
Gasoline (gallon)
1.77
1.26
2.26
27%
Corn (Bushel)
414
373
585
41%
Pork (lb)
0.87
0.75
1.04
20%
CRB Food Index
348
290
488
40%
Copper (MT)
5993
6015
9335
56%
Aluminium (MT)
1820
1620
2552
40%
Lumber (MBF)
379
436
718
89%
CRB Index
408
360
557
37%
Baltic Freight Sea shipping
1381
1799
3418
247%
Sources: USDA, CRB
The broadest measure of commodity prices, the CRB Index, is at its highest since 2011, when it reached an all-time high. Its component, the CRB Food Index, is also at its highest since 2011, near its record high.
Many observers will brush off commodity price inflation, arguing that it is caused by an imbalance between demand and supply that normally reverts within a few quarters. Although true, the supply response can take a lot longer than expected. Oil and gas companies are under enormous pressure and are not increasing exploration. Political uncertainty in South America may slow the supply growth for copper. The effects of weather events seem to have a more permanent effect on the inflation of agricultural commodities. For now, let’s assume that supply will come back and prices will come down. The example of lumber, which has recently retreated from above $1700/mbf to just over $700 may prove this point. In our opinion, what may drive a more sustainable inflation will be wage increases, which are driven by inflation expectations.
What we are witnessing currently, particularly in North America, is a wage inflation between 5% and 10% for the lowest earners. Inflation expectations are running close to 4%. There is a risk that the situation becomes a self-feeding mechanism, like in the 70s. Another big component of inflation is rent. The median asking rent in the US has increased almost 18% from the end of March 2020 to the end of March 2021, reaching $1,226 per month. It is up 22% since March 2019.[1]
Many have stated that a big reason for the low-inflation of the last twenty years was the emergence of China and its vast labor pool of migrant workers as the factory of the world. In May of this year, China’s producer price index reached 9%, its highest level since the summer of 2008. China will no longer be the deflationary force it has been in the last two decades. Between the aging of its population, its internal needs and increasing trade frictions, we can expect price increases from China.
Inflation numbers will continue to be very high, one might even call them scary for the next twelve months. How the Fed, politicians, unions, consumers and investors will react to these numbers will be important to watch, and our job is to forecast. We are already starting to see some divergence between central banks, like those of Norway, New Zealand and Canada, and even within the ranks of the Fed.
How will the market react to increasing signs that inflation will be more than transitory and that rates will rise?
Past episodes have shown that long-duration assets like long-term bonds and high growth stocks will be most affected. US large caps, particularly technology companies, are selling at important premiums versus other markets. They will be most vulnerable. Europe does not have the same labor inflation pressures. That said, inflation in the region may be more contained.
Smaller companies have generally outperformed in periods of inflation. From January 1979 to July 1983, the Russell 2000 Index outperformed the S&P 500 Index by 77%. During this time, inflation rose to as high as 13% and the economy suffered a double-dip recession in 1980 and 1981-82, before staging an extremely strong recovery in 1983 with growth rates as high as 8.5%.[2]
Our portfolio is well positioned for a strong recovery accompanied by higher inflation. With less debt, a rise in interest rates will have a minimal impact. With a more important exposure to the consumer and industrial sectors, economic growth will translate into earnings growth.
As mentioned in last week’s commentary, our companies have been able to maintain their margin despite rising input costs through a combination of price increases and efficiency gains.
[1] www.census.gov
[2] http://www.cmegroup.com/
Markets overview
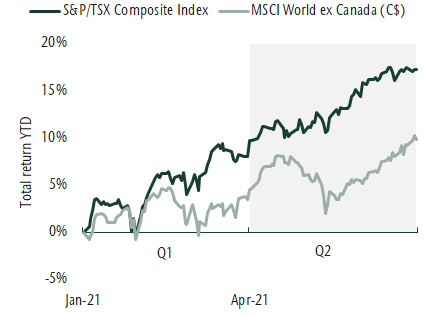
This quarter we saw the economic recovery continue to gather pace. Support for the recovery has come from easing restrictions and accommodative policy. More recently, countries have committed to expanding their spending programs to fight the remaining negative effects of the pandemic while improving longer-term growth prospects. Together this forms a positive backdrop for equities and we have seen companies significantly outpace earnings expectations. This quarter the S&P/TSX Composite Index was up 8.5% and the MSCI World ex Canada (C$) advanced 6.2%. Year to date this brings these market returns to 17.3% and 9.9%, respectively. Stronger performance from the S&P/TSX Composite reflects a strong Canadian dollar and a higher weight in the index to top performing cyclical sectors like energy and financials. Regardless, both Canadian and global results have been very strong.
Equity markets reach new highs
Source: MSCI, Refinitiv
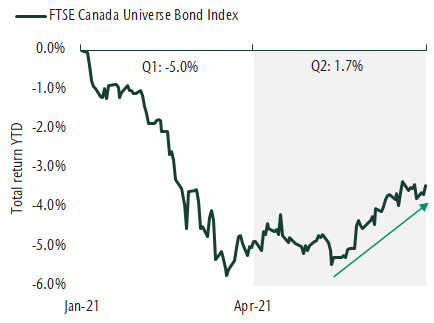
Bond returns have shown recent improvement after declining earlier in the year. This quarter the market has largely looked through a sharp increase in inflation which has been fueled by the robust economic recovery. Bond yields have declined modestly and prices have moved higher. The result was an increase of 1.7% for the FTSE Canada Universe Bond Index this quarter. The largest contributors to performance have come from provincial and corporate bonds.
Bonds begin recovery from Q1 decline
Source: FTSE, Refinitiv
Portfolio strategy
Our view is that we are in the midst of a strong economic recovery supported by pent up demand, accommodative policy and record levels of fiscal stimulus. This is a market-friendly backdrop and portfolios have been positioned to benefit from the recovery. We have been tactically overweight equities. As equity market performance has been strong, we have taken profits and rebalanced to maintain our desired exposure. Within equities, we have an overweight to small-cap stocks and maintain an allocation to value stocks. This quarter we also increased our emerging markets position. Within bonds, we have been overweight high yield, which is attractive in the early stages of a market cycle. This asset mix positioning has served us well and remains attractive in the current environment.
Our portfolio management teams generally continue to favour more cyclical companies that are levered to the economic recovery. These stocks have done well and in select cases we have reduced our exposure. This is because while the economic recovery has been strong, results have begun to moderate. At the same time, inflation has been higher than expected. While we don’t believe inflation levels will be disruptive in the long term, current conditions may lead to market volatility. Within fixed income, similar to equity portfolios, we remain overweight companies that are benefiting from the reopening of the economy.
From the desk of Jeff Guise, Managing Director, Chief Investment Officer, CC&L Private Capital.
This post is for information only and is not intended as investment advice. The views expressed are those of the author at the time of publication and are subject to change at any time.
Monetary trends continue to suggest a slowdown in global industrial momentum in H2 2021, with a rising probability that weakness will be sustained into H1 2022 – contrary to the prior central view here that near-term cooling would represent a pause in a medium-term economic upswing. Pro-cyclical trends in markets have corrected modestly but reflationary optimism remains elevated, indicating potential for a more significant setback if economic data disappoint. Chinese monetary policy easing is judged key to stabilising global prospects and reenergising the cyclical trade.
Global six-month real narrow money growth – the “best” monetary leading indicator of the economy – peaked in July 2020 and extended its fall in May, dashing a previous hope here of a Q2 stabilisation / recovery. This measure typically leads turning points in the global manufacturing PMI new orders index by 6-7 months but a PMI peak was delayed on this occasion by a combination of US fiscal stimulus and economic reopening. A June fall in new orders, however, is expected to mark the start of a sustained decline, confirming May as a significant top – see chart 1.
Chart 1
The magnitude of the fall in global real narrow money growth and its current level suggest a move in the manufacturing new orders index at least back to its long-run average of 52.5 during H2 (May peak = 57.3, June = 55.8).
China continues to lead global monetary / economic trends, as it has since the GFC. A strong recovery in activity through 2020 prompted the PBoC to withdraw stimulus in H2, resulting in a money / credit slowdown that has fed through to weaker H1 2021 economic data. The central bank, however, has been reluctant to change course, partly to avoid fuelling house and commodity price speculation, and six-month real narrow money growth has now fallen to a worryingly low level, suggesting rising risk of a “hard landing” in H1 2022 – chart 2.
Chart 2
Real narrow money growth remains above post-GFC averages in other major economies but has also fallen significantly, reflecting both slower nominal expansion and a sharp rise in consumer price inflation. Six-month inflation is likely to fall back during H2 but nominal trends could weaken further in response to higher long-term rates and as money-financed fiscal stimulus moderates.
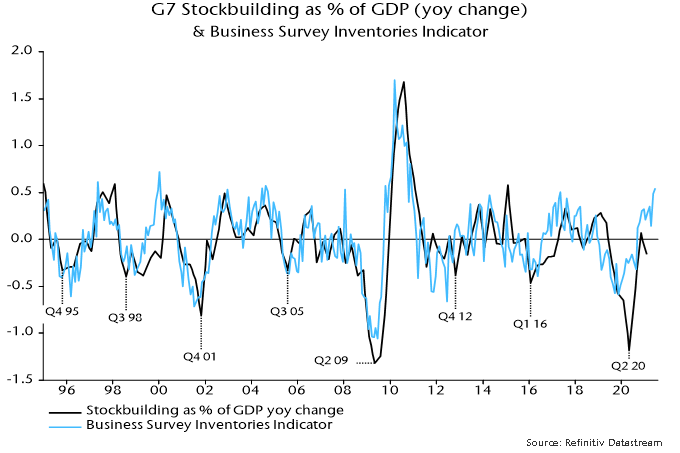
The suggestion from monetary trends of a deeper and more sustained economic slowdown could be argued to be inconsistent with cycle analysis. In particular, the global stockbuilding or inventory cycle bottomed in Q2 2020 (April) and, based on its 40-month average length, might be expected to remain in an upswing through early 2022, at least. This understanding informed the previous view here that a cooling of industrial momentum in mid-2020 would prove temporary.
A reassessment, however, may be warranted to take account of the distorting impact of the covid shock, which stretched the previous cycle to 50 months. A compensating shortening of the current cycle to 30 months would imply a cycle mid-point – and possible peak – in July 2021.
This alternative assessment is supported by a rise in the business survey inventories indicator monitored here to a level consistent with prior cycle peaks – chart 3.
Chart 3
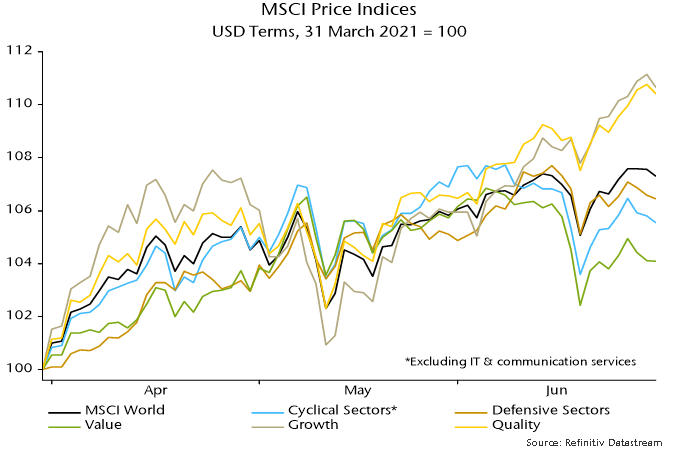
The previous quarterly commentary suggested that cyclical equity market sectors and value were less attractive in the context of an approaching PMI peak, while quality stocks had potential to rally. MSCI World non-tech cyclical sectors lagged defensive sectors during Q2, with quality and growth outperforming value – chart 4. These trends could extend if the slowdown scenario described above plays out. Chinese policy easing would support the cyclical / value trade but the impact could prove temporary unless the Chinese shift resulted in an early rebound in global real narrow money growth.
Chart 4
Counter-arguments to the relatively pessimistic economic view outlined above include the following:
1. Fiscal policy remains highly expansionary and will offset monetary weakness.
Response: Economic growth is related to the change in the fiscal position and deficits, while large, are falling in most countries. Even in the US, President Biden’s stimulus package served mainly to neutralise a potential drag as earlier measures expired. The US fiscal boost peaked with the disbursement of stimulus cheques in March / April.
2. Household saving rates and money balances are high, implying pent-up consumer demand.
Response: Savings rates have been temporarily inflated by government transfers and will normalise as these fall back and consumption recovers to its pre-covid level. High money balances probably reflect “permanent” savings. US households planned to spend only 25% of the most recent round of stimulus checks, according to the New York Fed, using the rest to increase savings and reduce debt. The implied spending boost has already been reflected in retail sales, which may fall back in Q3.
3. Services strength as economies reopen will offset any industrial slowdown.
Response: The services catch-up effect is temporary and momentum is likely to reconnect with manufacturing in H2. Industrial trends dominate economic fluctuations and equity market earnings.
4. Profits are rising strongly, with positive implications for business investment and hiring.
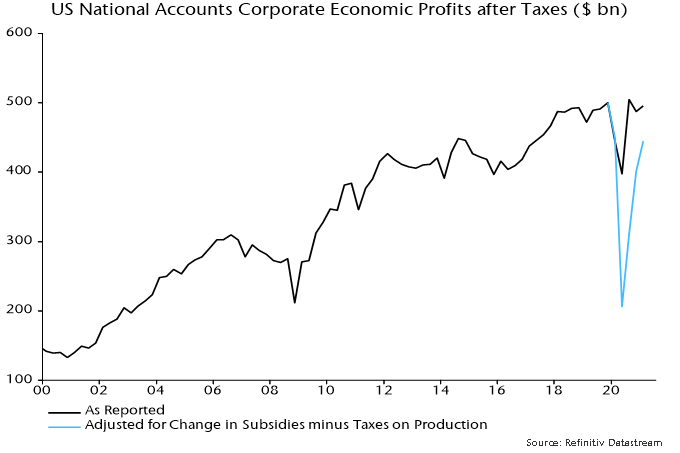
Response: Profits are still receiving substantial support from government subsidies, withdrawal of which will offset much of the additional boost from economic normalisation. An increase in net subsidies relative to their Q4 2019 level accounted for 10% of US post-tax corporate economic profits in Q1, according to national accounts data – see chart 4.
Chart 5
5. Inventories to shipments ratios remain low, implying that the stockbuilding cycle is far from peaking.
Response: Economic growth is related to the change in stockbuilding, not its level. Stockbuilding is highest when inventories are low – the subsequent fall is a drag on growth even though stockbuilding usually remains high until inventories normalise. Low inventories to shipments ratios, therefore, are consistent with a cycle peak.
6. Industry has been held back by supply constraints – output and new orders will surge as these ease.
Response: Supply difficulties have probably resulted in firms placing multiple orders for inputs, inflating PMI readings – this effect will unwind as bottlenecks ease. Historically, manufacturing PMI new orders have fallen, not risen, following a peak in supply constraints.
7. Rising inflation will boost bond yields, supporting cyclical / value outperformance.
Response: Last year’s global money surge was expected here to be reflected in high inflation in 2021-22 but six-month broad money growth has moved back towards its pre-covid average, suggesting that medium-term inflation risks are receding. Bond yields usually track industrial momentum more closely than inflation data so would probably remain capped in a slowdown scenario even if inflation news continues to surprise negatively.
Closeup side view of a mid 50’s couple going grocery shopping during coronavirus pandemic. They are in an empty aisle, wearing face masks and choosing some frozen foods.
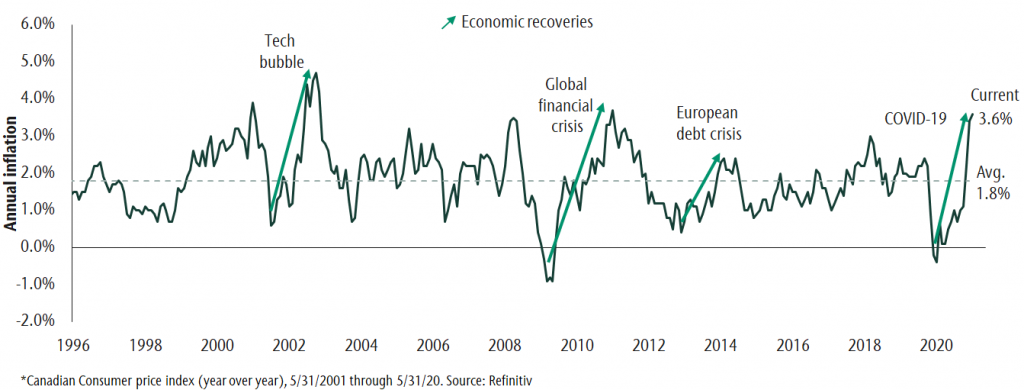
Inflation has moved to its highest level in ten years. Higher prices result from strong economic growth led by pent-up demand for goods and record levels of government spending. At the same time, strong demand is leading to supply shortages. This dynamic is normal and has occurred after every recession. Further, when we look at the components of inflation, we see that recent price increases are largest in industries hurt the most during the pandemic, e.g. energy and travel. These industries are cyclical and are pulling inflation readings higher as prices recover after a period of decline.
We don’t believe investors should be worried about longer-term secular inflation. Higher prices in the short term are expected to be tempered as supply adjusts and demand returns to more normal levels. And while policy actions such as higher spending and larger debt levels have increased short-term inflation, the same forces are deflationary long-term. This is because more money goes to paying down debt as opposed to future investment. The caveat is that higher debt levels encourage policymakers to allow inflation to move higher than it has been in recent cycles. Considering these forces, we believe inflation will be higher but not at the disruptive levels we saw in the 70s and 80s. Our long-term inflation expectation is for a 2.1% increase in prices. This is higher than the last 25 years but still moderate.
While we don’t think inflation will be disruptive in the long term, inflation is higher now and likely to be higher during the coming cycle. Now is a good time to consider the effect of inflation on different asset classes that make up your portfolio. Stocks can generally do well in a period of moderate inflation, whereas fixed income is hurt the most. Alternative asset classes also have some natural protection from inflation. Here follows our inflation perspective on each major asset class:
Equities
Moderate inflation is a double-edged sword for stocks. On the one hand it increases corporate cash flows and on the other it decreases the real value of investment returns. Companies with high valuations tend to underperform as their valuations are based on future earnings growth long into the future. In a period of higher inflation, these future earnings are now worth less today. Companies with lower valuations, companies we call value stocks, do better in a period of above-average inflation. Strategically we think it makes sense to hold both growth and value styles within your equity allocation.
In this environment we also want to own companies that can maintain their profit margins and offer specialized goods or services. These companies are more likely to be able to pass on rising business costs to consumers.
Fixed Income
The bond allocation of a portfolio is the one that is hardest hit by inflation. This is because most bond coupon payments do not increase with inflation. In addition, bond yields tend to rise when inflation is moving higher. The result is both a temporary decline in the price of bonds and lower long-term real return.
The negative effects of rising inflation and yields can be managed by holding short-term bonds and higher coupon bonds. The former are less sensitive to changes in inflation and yields. This protects capital when inflation is rising. The latter have more income to offset price declines. Having a view of the economic backdrop and managing a bond portfolio’s sensitivity to changes in yields and inflation is important to delivering risk-adjusted returns. This is particularly true when inflation is on the rise.
Alternatives
The alternative asset classes in a portfolio are attractive since they generate strong levels of income relative to traditional equities and bonds. They also tend to be the least sensitive to risks in the broader economy, including inflation. Each of our private market investments (real estate, infrastructure and private loans) have natural inflation stabilizers. For real estate, rental income tends to rise with inflation and most of our infrastructure contracts have ongoing inflation adjustments. Finally, the coupon payment on private loans are variable and income rises as yields and inflation move higher.
Hedge strategies are a liquid alternative asset class. They don’t directly hedge against inflation, but when allocating to strategy within a portfolio, we reduce bond exposure which is most negatively affected by inflation.
Planning for different investing environments
A well-diversified portfolio by its nature has many offsets to inflation. As active managers we also make investment decisions to improve portfolio returns or mitigate inflation risk. While it’s been a long time since we have had to worry about inflation, we are positioned for higher but moderate price increases. When reviewing your asset allocation, a key point to keep in mind is that inflation does not affect all portfolios equally. More conservative investors with a larger percentage of their portfolio in fixed income are more susceptible to lower returns as inflation rises. As such, it’s important to review the asset allocation on an ongoing basis to see how trends like inflation may impact the ability of a portfolio to meet your objectives. We have many tools to assess the tradeoffs you face as an investor under different market and economic conditions. While the future is uncertain, we can assist you in making informed decisions that consider risks like inflation, among others.
This post is for information only and is not intended as investment advice. The views expressed are those of the author at the time of publication and are subject to change at any time.
We recently conducted interviews with a number of holdings, including Royal Unibrew, Autogrill, and Soitec, and found it notable that most management teams we spoke with mentioned the improving pace of the recovery. European companies continue to acknowledge inflation, but many seem to argue that a combination of price increases and cost cutting can mitigate the impact. Looking the at Corporate Social Responsibility (CSR) agendas of these companies, their sustainability initiatives continue to improve. With the energy transition and digitalization as a source of growth, European companies could be beneficiaries of a new stimulus package.
The EU Recovery Fund is an important tool for the economic and political perspective in the EU. For the first time, the EU will be able to borrow large amounts for budget purposes. While the larger EU economies are likely to receive more in nominal terms, countries with lower per-capita GDPs should be the biggest recipients. The EU Recovery Fund, which will finance part of the energy transition plan, became the key financial pillar of the EU’s Green Deal. As a reminder, the objective of the EU Green Deal is to achieve climate neutrality by 2050 and to further reduce greenhouse emissions by 2030.
Some industries should benefit from that spending program, particularly the capital goods, construction, automotive, and utilities focusing on renewables. The digital transformation objective should drive some IT services and telecommunications companies, especially the ones exposed to 5G, rural connectivity, digitalization/modernization, e-heath, smart cities, and connected education.
We believe that the EU Recovery Fund will be supportive for the European equity market. This, combined with an acceleration of the vaccination campaign, could explain some of the recent catch up of EU equities. Let’s hope that the funds will be used in full and spent wisely over the next few years.
The sharp rise in UK CPI inflation to 2.1% in May supports the long-standing forecast here of a move above 3% in late 2021.
The 2.1% outturn compares with a 2.0% forecast in a post a month ago but there were bigger surprises within the detail. Core inflation – excluding food, energy, alcohol and tobacco – jumped from 1.3% in April to 2.0%. This was partly offset by unexpected further weakness in food prices, which posted a 1.2% annual fall, up from 0.5% in April.
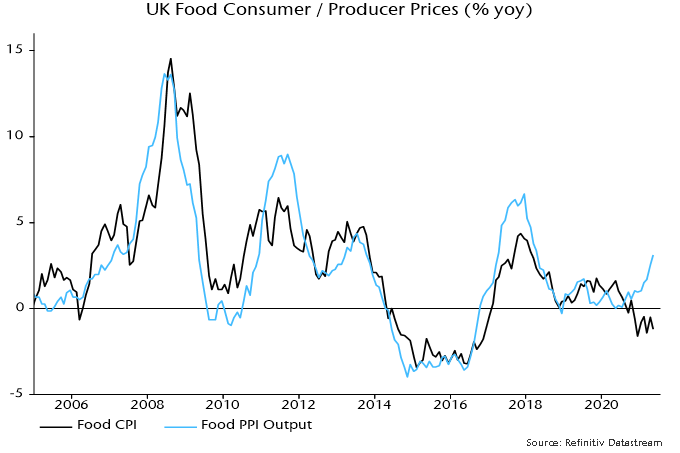
This is an unfavourable combination because the rise in core prices is more likely to stick, with food prices expected to pick up into 2022.
A food rebound is already evident in producer output price inflation for food products, which rose to 3.1% in May and correlates with / leads CPI food inflation – see chart 1,
Chart 1
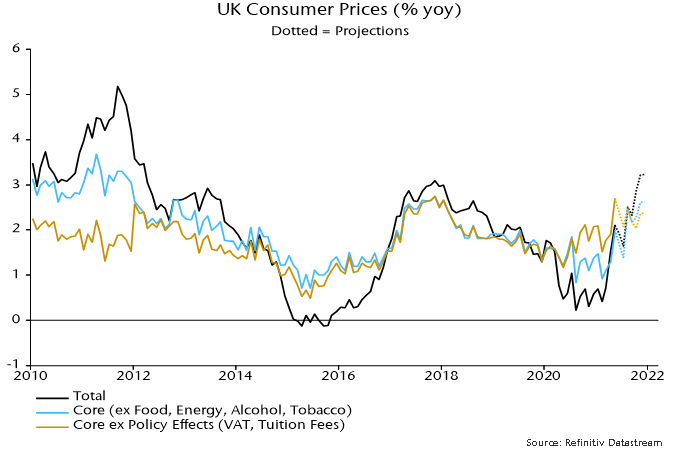
Headline / core inflation rates are still being suppressed by last year’s VAT cut for hospitality, which is due to be reversed in two stages starting in October. The guesstimate here is that core inflation would be 2.7% in the absence of the cut, based on an assumption of 35% pass-through to consumers.
The revised forecasts shown in chart 2 incorporate one-third of the upside core surprise in May, attributing the remainder to temporary “noise” – this may prove overoptimistic. As before, annual food inflation is assumed to rise to 2.0% by year-end. The previous energy price assumptions are also maintained.
Headline / core rates fall back in June / July because of base effects but rises resume thereafter, with headline inflation reaching 3.2% in November / December.
Chart 2
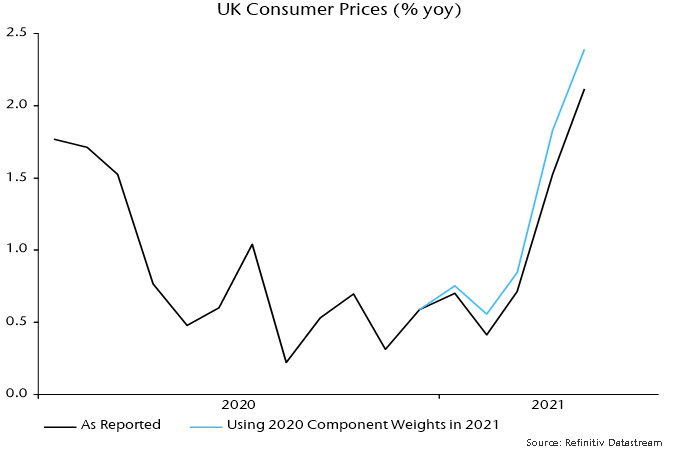
It should be noted that the end-2020 basket reweighting has had the effect of suppressing recorded inflation in 2021. The new weights reflect spending patterns during the pandemic but expenditure shares are normalising as the economy reopens, with an associated shift in relative prices.
The CPI weight of restaurants and hotels, for example, was cut from 11.9% in 2020 to 8.7% in 2021 but the price index for the sector rose by 3.4% between December 2020 and May, more than double a 1.5% rise in the overall CPI. The cut in the weight also implies that the VAT reversal will have a smaller CPI impact than last year’s reduction.
An alternative approach, which may better reflect consumer experience, is to reuse the 2020 basket weights, based on 2018 spending shares, for the 2021 index calculation. The alternative measure rose by 1.7% between December and May, with its annual increase at 2.4% versus the official 2.1% – chart 3.
Chart 3
The beauty industry is one of the oldest in the world. For centuries, we have debated the true nature and form of beauty; can it be objectively defined? Or is beauty truly “in the eye of the beholder,” as the saying goes.
Many great philosophers like Plato, David Hume, and Immanuel Kant have tried to define the term beauty, yet a universally valid definition remains elusive. There is, however, one thing most of us can agree on: appearance is the most visible aspect of beauty. Throughout the ages, men and women have striven to enhance their appearance – investing time, energy, and money in the pursuit of beauty’s closest cousin: attractiveness.
Historians can trace our use of beauty products and cosmetics back to 3100 BC, when the ancient Egyptians used kohl to create dramatic eyes. With today’s evolving technologies, we have moved from simple products such as eyeliner, to highly sophisticated serums, Botox, fillers, and laser treatments. And now, the cosmetic industry has moved far beyond the face, offering beauty-seekers a wide variety of non-invasive products and procedures for the entire body.
COVID’s unexpected impact on the beauty business
Since the start of the COVID-19 pandemic, face masks have been mandated across the globe. Over time, we’ve gotten used to wearing them and seeing them on others. But few anticipated how face masks could be a tailwind for the cosmetics industry.[1]
Cosmetic centres around the world have seen a large increase in demand for Botox injections and laser treatments, specifically around the eyes and upper portions of the face – the areas highlighted by the face mask.
Meanwhile, the massive boom in video-conferencing has generated a hyperawareness of facial “imperfections.” Confronted with endless hours of poorly-lit, unflattering reflections of ourselves on Zoom calls, many are investing in aesthetic procedures to enhance their appearance online.
The result? Soaring demand for deep-plane facelifts, resurfacing laser treatments, and other non-surgical procedures across the globe.
Everyone is looking for a beauty boost, a break from lockdown monotony, or a fresh face for the summer terrace. This week, we introduce you to InMode, a portfolio holding that should benefit from the booming beauty market.
Business Overview
InMode was founded in 2008 and is headquartered in Yokne’am, Israel. InMode is an esthetic equipment company that designs, develops, and manufactures minimally invasive (MI) and non-invasive aesthetic medical products.
InMode uses fractional radiofrequency, which allows a more precise delivery of energy to targeted areas of the body with only a small incision. Hence, it is more effective than other non-invasive procedures, offers much faster recovery, and has a lower risk profile than full plastic surgeries.
Their MI product line is used to perform procedures, such as liposuction with simultaneous skin tightening, body and face contouring, and ablative skin rejuvenation treatments. While their non-invasive products can help with procedures, like facial skin rejuvenation, wrinkle reduction, cellulite treatment, and skin appearance and texture.
Growth in the medical aesthetic industry is being driven by the following factors:
An aging population that wants to remain youthful
A flight to out-of-pocket work among doctors and clinicians
Growth of social media and video-conferencing
Growing availability of non-invasive and minimally invasive procedures
Improving efficacy
InMode’s Competitive Advantages
First mover advantage in minimally invasive aesthetic market, delivering surgical-grade results with no competitor in sight
Strong barriers to entry – patents, development timelines, global regulatory approval, and peer-reviewed published clinical data (56 articles)
Brand recognition, feedback from doctors, and a strong safety track record
Aligned management team with a proven track record and industry expertise
Growth Strategy
Product development, releasing 2 new platforms every year (ophthalmology and ENT in 2021)
Distribution in existing and new markets
Cross-selling (20% of clients purchase a second platform within 18 months)
Growth of consumables from current 10-12% to 25% in the MT
Management
InMode is led by an experienced team of entrepreneurs, who have seen a large market potential, given the treatment gap in the industry
Risks
The aesthetic laser and light-based treatment system industry is vulnerable to economic trends
Increased competition
Regulations could delay product launches
Global small cap companies like InMode are not always known by name, but they almost always touch our daily lives in important ways. As life slowly gets back to normal, you may notice a lot more flawless skin and toned bodies, as consumers take advantage of innovative medical aesthetic products delivered by market leaders like InMode.
Perhaps this gives new meaning to the saying — “beauty is skin deep”?
A case can be made that the most pressing monetary policy issue globally is the timing not of Fed tightening but rather of PBoC easing.
The mainstream view at the start of the year was that China would continue to lead a global economic recovery, resulting in a further withdrawal of monetary and fiscal policy support.
Chinese economic data have disappointed consistently – including May activity numbers this week – but the consensus has maintained a forecast of policy tightening, albeit later than originally expected.
The “monetarist” view, by contrast, is that the PBoC had already moved to a restrictive monetary stance during H2 2020. This was reflected in a money / credit slowdown late last year, which has fed through to a loss of economic momentum in H1 2021.
The PBoC was judged likely to recognise rising downside risks by easing policy by mid-year. Money market rates have been allowed to drift lower since February but May monetary data suggest that policy adjustment has been “too little, too late”.
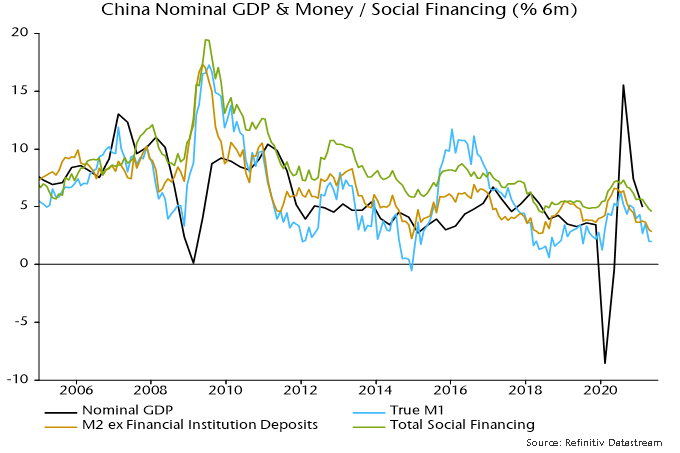
Six-month growth rates of money and credit fell further last month, signalling likely continued nominal GDP deceleration through year-end, at least – see chart 1.
Chart 1
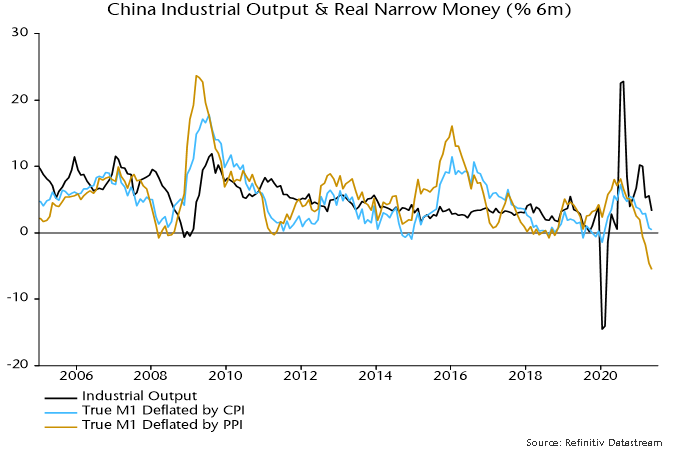
Weakness is more pronounced in real terms: narrow money has barely kept pace with consumer prices over the last six months and has fallen by 5.5% relative to producer prices – chart 2.
Chart 2
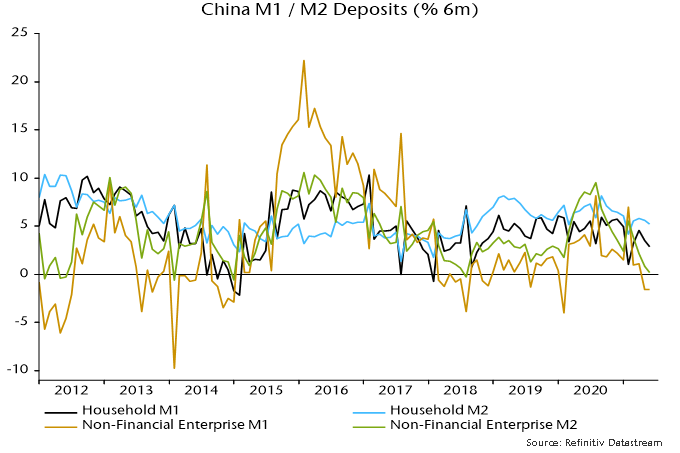
The liquidity squeeze is focused on companies. M2 deposits of non-financial enterprises have stagnated over the last six months, while M1 deposits have fallen – chart 3. Nominal weakness is comparable with 2014 and 2018 – ahead of major economic slowdowns – but real money balances are under greater pressure now, reflecting surging input costs.
Chart 3
The bias here has been to give the PBoC the benefit of the doubt and assume that easing would occur early enough to head off serious economic weakness. Increased pessimism is warranted unless action is forthcoming soon.