Detailed monetary data for July released yesterday suggest that recent policy easing is beginning to support money growth, in turn hinting at a recovery in economic momentum from end-2021.
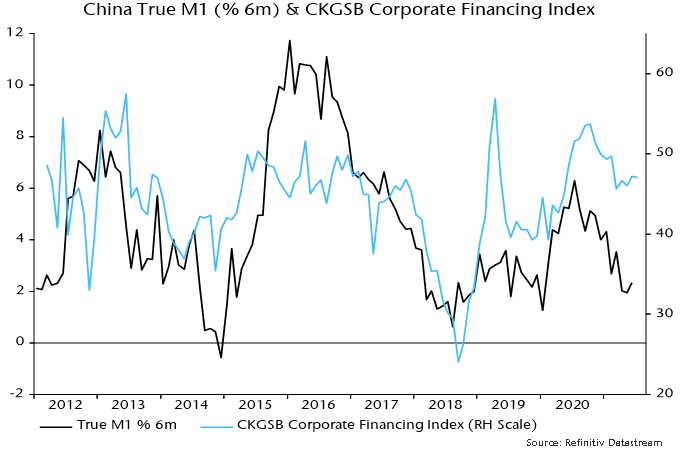
A sustained slowdown in six-month narrow money growth from July 2020 correctly signalled “surprise” Chinese economic weakness so far in 2021. The expectation here was that the PBoC would ease policy in Q2, supporting economic prospects for later in 2021. Adjustment was delayed but the reserve requirement ratio cut on 9 July appeared to mark a significant shift. The hope was that July monetary data would confirm a bottom in money growth.
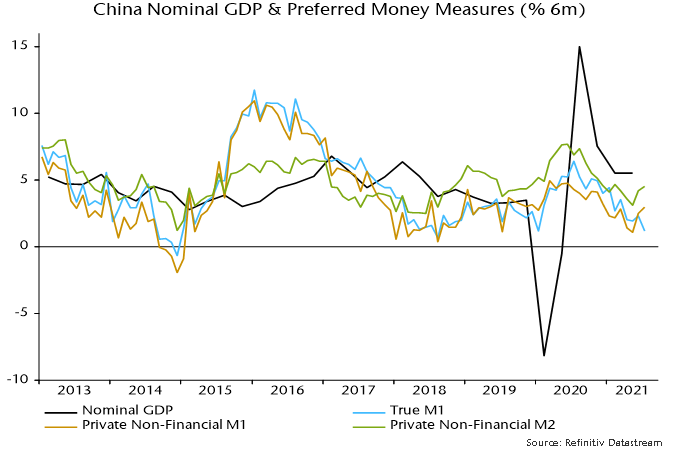
The headline July numbers released on 11 August seemed to dash this hope, with six-month of “true M1” falling to a new low – see chart 1*.
Chart 1
The additional data released yesterday allow a breakdown of the deposit component of this measure between households, non-financial enterprises and government departments / organisations. It turns out that the further fall in growth in July was due to the latter public sector element, which is volatile and arguably less important for assessing prospects for demand and output.
Six-month growth of “private non-financial M1”, i.e. currency in circulation plus demand deposits of households and non-financial enterprises, rose for a second month in July. So did the corresponding broader M2 measure – chart 1.
This improvement needs to be confirmed by a recovery in overall narrow money growth in August, ideally accompanied by a further increase in the private sector measure. One concern is that the rebound in the latter has so far been driven by the household component – enterprise money growth remains weak.
Increased bond issuance and fiscal easing could lift public sector money growth during H2.
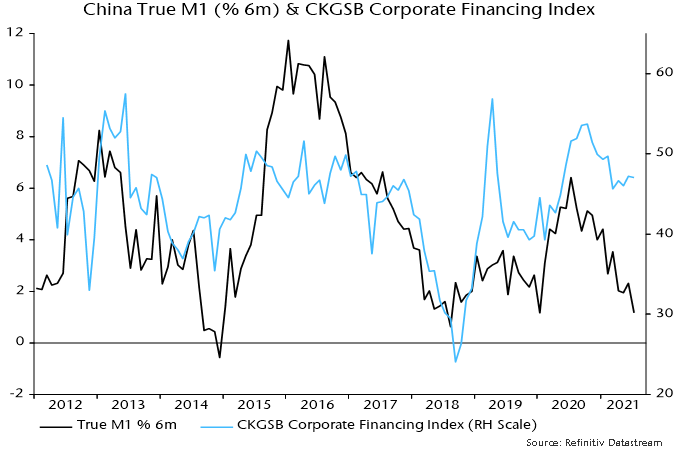
The corporate financing index in the Cheung Kong Graduate School of Business monthly survey is a useful corroborating indicator of money / credit trends – a rise signals easier conditions. The index bottomed in March but has yet to improve much – chart 2. August survey results will be released shortly.
Chart 2
*True M1 includes household demand deposits, which are omitted from the official M1 measure.
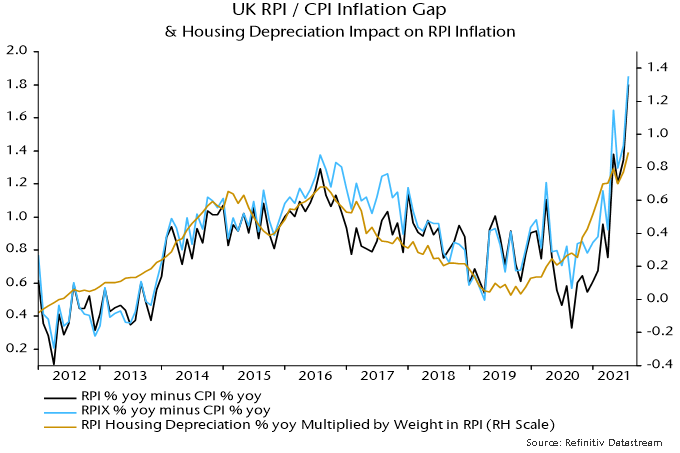
The fall in UK CPI inflation in July reported this week will be of limited comfort to policy-makers – a decline had been expected because of a large base effect and will be more than reversed in August. A bigger story was the further widening of the RPI / CPI inflation gap to an 11-year high. RPI inflation could top 5.5% in Q4 2021, boosting interest payments on index-linked gilts by a whopping £15 billion relative to the OBR’s Budget forecast.
CPI inflation fell from 2.5% in June to 2.0% in July but RPI Inflation eased by only 0.1 pp to 3.8%. RPIX inflation – excluding mortgage interest – was stable at 3.9%.
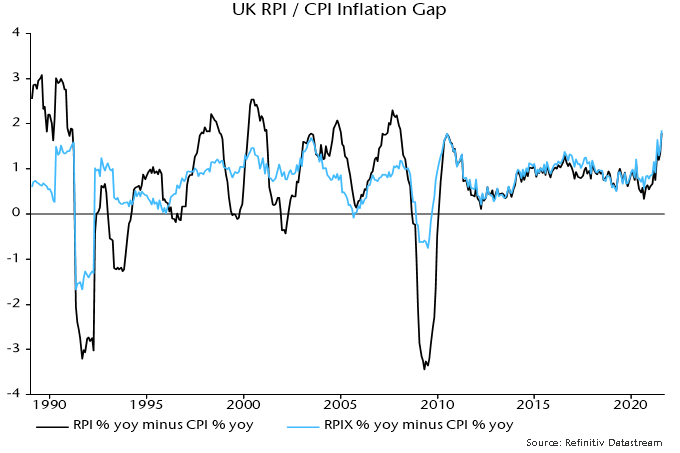
The RPI / CPI inflation gap, therefore, widened to 1.8 pp, its largest since June 2010. The RPIX / CPI inflation gap of 1.9 pp is the biggest on record since the inception of CPI inflation data in 1989 – see chart 1.
Chart 1
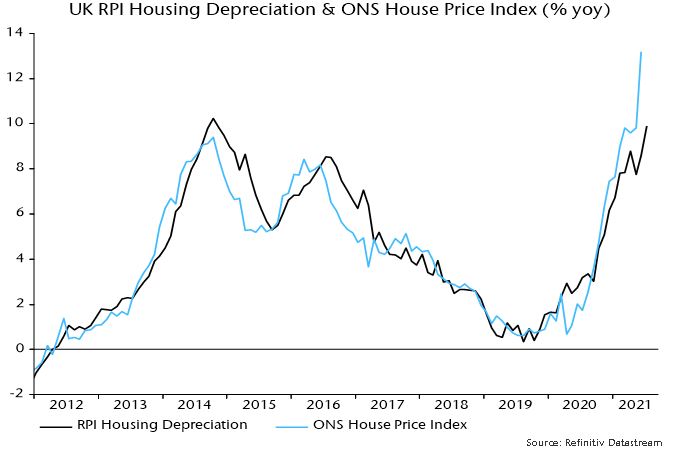
The widening gaps mainly reflect surging house prices, driven partly by Chancellor Sunak’s stamp duty holiday. House prices enter the RPI via the housing depreciation component*, which is linked to ONS house price data with a short lag – chart 2. This component has a 9.0% weight and rose by 9.9% in the year to July, contributing 0.9 pp to RPI inflation of 3.8%. The CPI omits owner-occupier housing costs.
Chart 2
Note that the housing depreciation weight has risen from 5.8% in 2014, i.e. the sensitivity of the RPI to house prices has increased by more than 50% since then.
The RPI / CPI and RPIX / CPI inflation gaps, however, have widened by more than implied by house prices alone – chart 3.
Chart 3
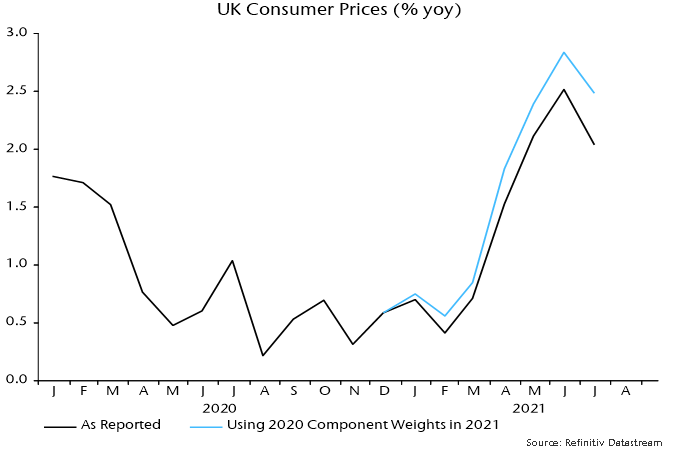
A likely additional influence has been the ONS decision to depart from its normal procedure and base 2021 CPI weights on 2020 rather than 2019 expenditure data. As previously explained, this has lowered the weight of categories hit hardest by the pandemic but now experiencing a rebound in demand and prices. An alternative calculation carrying over 2020 weights (based on 2018 expenditure data) to 2021 produces an annual inflation number for July of 2.5% rather than 2.0% – chart 4.
Chart 4
The RPI has been less affected because the normal procedure was followed of basing weights on expenditure shares in the 12 months to June of the previous year. 2021 weights, therefore, reflect spending in the year to June 2020 – the impact of the pandemic was smaller over this period than in calendar 2020.
So weighting effects are likely to have had a larger negative impact on CPI than RPI inflation.
The phase-out of the stamp duty holiday is being reflected in a slowdown in housing market activity but estate agents expect a shortage of supply to support prices, according to the RICS survey. Recent strength may not yet have fed through fully to the RPI housing depreciation component – the annual rise in the latter of 9.9% in July compares with a 13.2% increase in the ONS house price index in the year to June.
Assume, as a reasonable base case, that that the annual increase in the housing depreciation component moderates to 8.0% in Q4 2021 while other influences on the RPI / CPI inflation gap are stable. This would imply a decline in the gap from the current 1.8 pp to 1.6 pp. The Bank of England’s August forecast of CPI inflation of 4.0% in Q4 would then read across to RPI inflation of 5.6%.
The OBR’s March Economic and fiscal outlook projected a 2.4% rise in the RPI in the year to Q4 2021. According to its debt interest ready reckoner, a 1% rise in the RPI boosts interest costs on index-linked gilts by £4.8 billion in the following year. The suggested Q4 overshoot of 3.2 pp, therefore, implies a spending increase of £15.2 bn – or 0.6% of annual GDP – relative to Budget plans.
*House prices also feed into the mortgage interest component, as well as estate agents’ fees and ground rent.
Every now and then, we remind ourselves why we enjoy our work. To us, global small cap is a wonderful asset class that offers the widest array of companies in terms of style, valuations, and growth profiles. This helps us develop a philosophy and process that fits our investment background, without having to take unnecessary market-related risks and having too much of a narrowed spectrum of investment candidates. Moreover, this investment universe is comprised of many companies that are strongly impacted by secular themes, especially the technology-driven ones.
Technologically driven secular themes usually appear in our universe following a start-up phase where venture capital, serial entrepreneurs, and bankers play god with other people’s money, through conceptual and research-driven business plans. Following that phase, we start seeing the themes when more established companies decide the technology is mature enough to turn into real products.
Artificial Intelligence (AI) is a prime example. The market is already big and getting bigger. If we were to list all of the companies in our portfolio impacted by utilizing AI, the list would be long. In healthcare alone, the AI market is expected to reach USD 58.6 billion by 2028.[1]
Let’s dig deeper and look at a field that will greatly benefit – radiology. Radiology features a high degree of specialty mixed with high throughput that fits AI’s problem-solving capabilities. As a key part of medical practice and research, radiology interprets most human biological ailments. Its complexity has skyrocketed due to biomarkers that are now available to radiologists, especially in the field of oncology.
Radiology and machine learning will prosper in many markets, such as prostate cancer diagnostics, thanks to greater precision in comparison to the conventional PSA test. New AI-assisted markers are set to help radiologists read CT scans for colon cancer. In addition, AI is expected to increase radiology productivity (volume of readouts performed per hour) and the amount of new products (volumes from new diagnostic initiatives).
Speaking of new products, radiology and AI will be a key part of the new Alzheimer treatment paradigm, representing an estimated USD 10 billion market in 2026. The recently approved Alzheimer’s drug Aduhelm, from biotech company Biogen, requires a specialized CT confirmation scan, as well as monthly scans during treatment. As a market, radiology has an above-average growth rate of 5.2%, with a substantial market size of USD 20 billion.[2]
Raffles Medical (RFMD: SP)
Raffles Medical (RMG) is a private healthcare provider operating in 14 cities across Asia, including Singapore, China, Japan, Vietnam, and Cambodia. In China, RMG is present in eight cities.
Hospitals are core users of radiology in the majority of departments. Radiology productivity is linked to efficiency with most procedures, especially in the private sector where RMG operates. With EBITDA margins already at 21% versus mid-teens for its hospital peers, RMG remains a first-mover when it comes to technology driven productivity. Radiology AI will have an important impact on the sustained growth in profitability going forward. RMG operates two hospitals, the 380-bed Raffles Hospital Singapore, which opened in 2003, and the 700-bed Raffles Hospital Chongqing, which opened in 2020. RMG also just opened its third hospital, the 400-bed Raffles Hospital Shanghai. According to management, the new hospitals in Shanghai and Chongqing are starting with 100-150 operational beds.
In Singapore, RMG operates the Raffles Specialist Centre, adjoined to Raffles Hospital, and it has a total bed capacity of 380. Centers of excellence in the Chongqing hospital include gastrointestinal surgery, obstetrics & gynecology, pediatrics, cardiovascular surgery, neuroscience, and oncology, which all feature significant radiology practices.
Our next holding corroborates the kind of AI productivity gains that Raffles could be able to obtain in the near future.
Radnet (RDNT: US)
RadNet is the largest provider of outpatient imaging services in the United States, with 346 centers nationwide.
The company has an AI subsidiary called DeepHealth, which focuses on developing machine-learning applications for the radiology industry. RadNet recently announced the FDA’s approval of its AI mammography triage software. This software acts as a screening tool, enabling radiologists to more effectively manage their mammography cases using AI. DeepHealth’s powerful new AI technology automatically identifies suspicious screening exam results that may need priority attention, allowing radiologists to optimize their workflow for efficiency and effectiveness.
According to the company, RadNet’s first AI approval should translate to a 25% gain in productivity covering its two million annual mammography scans. This should therefore enable the company to expand its capacity and grow without having to hire additional staff.
[1] Market Insight Reports, July 28, 2021
[2] Grandview Research, December 2020
Wind turbines in Navarre (Spain) Renewable energy concept.
Investing in private market infrastructure assets is an effective means of generating stable cash flow and long-term capital growth. Historically, this asset class has only been available to institutional investors with deep pockets. However, in recent years investment managers have started to provide their high-net-worth clients with opportunities to invest in this asset class.
In this article, we provide an overview of infrastructure investing, how we approach it, and the opportunity for investors. For information on other alternative asset classes, please read our Portfolio Guide – Beyond Stocks and Bonds.
What is infrastructure investing?
Infrastructure investing refers to making investments in physical, or “real”, assets that provide an essential product or service that is critical to society. Infrastructure assets are varied – from roads, rail, schools, and hospitals to power generation, energy transmission and distribution, and digital infrastructure.
Typically, attractive assets share a number of key characteristics including long lives, low competition and high barriers to entry. When combined with predictable revenue streams – often from contracts with government counterparties or counterparties with high credit ratings – this makes infrastructure investing a source of portfolio stability and return.
Understanding the opportunity for investors
While institutional investors have long embraced infrastructure investing, it is a less familiar option for high-net-worth investors, given the complexity and high cost associated with access to the asset class. Three key benefits include:
Uncorrelated: Infrastructure cash flow returns have a low correlation to other asset classes. It means they do not typically rise or fall in lockstep with liquid asset classes like stocks or bonds or private asset classes like real estate, private debt or private equity.
Resilient: Infrastructure returns are relatively resilient to economic turbulence. Even in recessionary economic environments, infrastructure returns have been relatively stable, given their essential, and often contracted or regulated, nature.
Long term: Infrastructure assets typically provide steady returns over a long time. Assets usually benefit from long contract lengths of more than 20 years and the assets themselves often have even longer useful lifespans – some hydroelectric assets have reached upwards of 100 years.
These benefits make infrastructure an attractive asset class. Incorporating infrastructure into a broader portfolio can provide important diversification benefits and may also deliver increased average returns while reducing risk.
Another characteristic of investing in infrastructure and other private asset classes is restricted liquidity. This is because the holding period of infrastructure assets reflects the long-term nature of the investments. For investors that do not require their capital in the short term, infrastructure can be a relatively safe and low-risk way to generate income and long-term growth.
Our approach to infrastructure investments
At CC&L Private Capital, our infrastructure investments are primarily in Canada, the US, and Chile. We expect to add infrastructure assets in other geographies over time in a measured and disciplined way.
Our portfolio is focused mainly on small- and medium-sized traditional infrastructure projects (e.g., roads, rail, hospitals) and energy infrastructure projects (i.e., hydro, wind, and solar).
Choosing the right investment manager
We strongly believe in the benefits of infrastructure investing. That is why we invest a significant amount of our own capital in our portfolio, as with all our private market investments. It shows that we are committed to our portfolio’s performance, as we benefit alongside our clients.
When evaluating potential investment managers, whether they have ”skin in the game” is important, particularly for alternative asset classes. Other criteria investors should consider include the stability of the investment manager’s team, the manager’s proven ability to generate returns, the direct nature of the investments and the quality and diversity of the infrastructure portfolios.
If you would like to find out more about our approach to infrastructure investing or learn how we can help you grow your investment returns, please contact us.
This post is for information only and is not intended as investment advice. The views expressed are those of the author at the time of publication and are subject to change at any time.
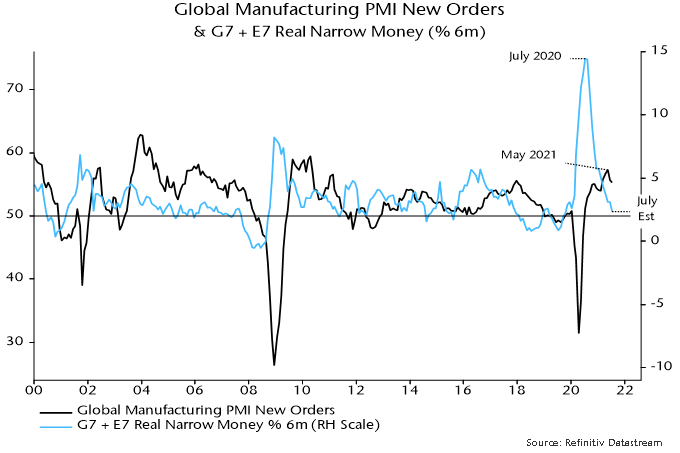
The assessment here remains that the global manufacturing PMI new orders index peaked in May and will fall through H2 2021, reflecting a decline in global six-month real narrow money growth from July 2020 through May. Real money growth, however, stabilised between May and June, raising the possibility that a turning point was at hand. A recovery in real money trends during Q3 would be a positive signal for economic prospects for H1 2022 and could support a second leg of the reflation trade.
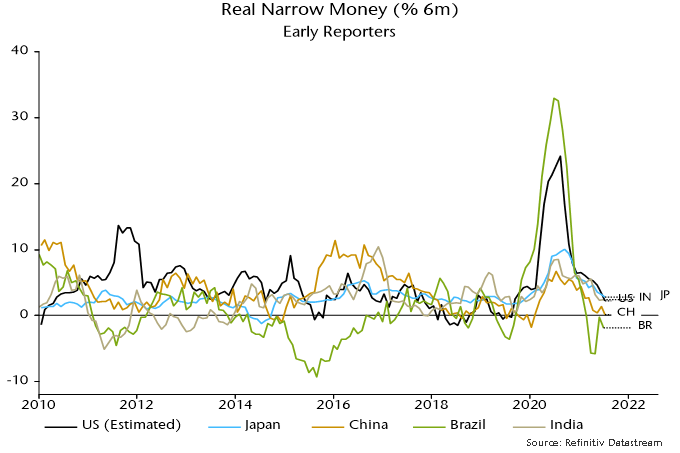
Incoming monetary news for July is unfavourable for this scenario. Global six-month real narrow money growth is estimated to have fallen further last month to its lowest since October 2019, based on monetary data covering 70% of the G7 plus E7 aggregate monitored here – see chart 1.
Chart 1
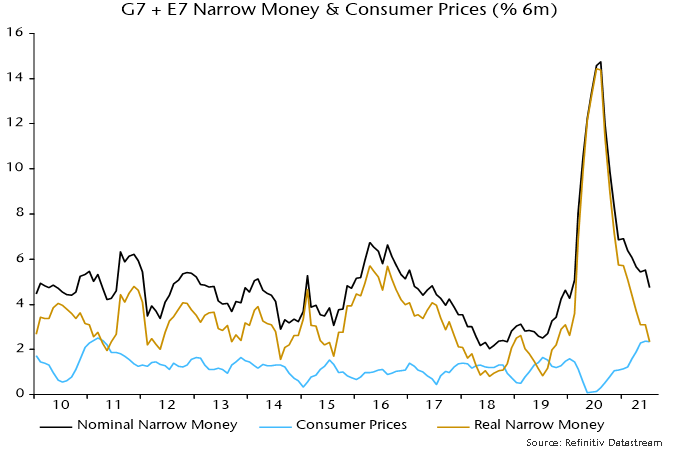
A pick-up in six-month consumer price inflation contributed to the fall in real narrow money growth into May / June. Price momentum stabilised in July but there was a further decline in nominal money expansion – chart 2.
Chart 2
Six-month real narrow money growth is estimated to have fallen in the US, China, Japan and Brazil, with India stable – chart 3. (The US July money number is estimated from weekly data on currency in circulation and commercial bank deposits.)
Chart 3
A recovery in the global measure remains plausible in August / September. Recent commodity price stabilisation suggests a decline in six-month inflation, while Chinese money growth may pick up in lagged response to policy easing.
Global six-month real narrow money growth has led turning points in manufacturing PMI new orders by 6-7 months on average historically. The further fall in real money growth in July, therefore, suggests that PMI weakness will extend into early 2022.
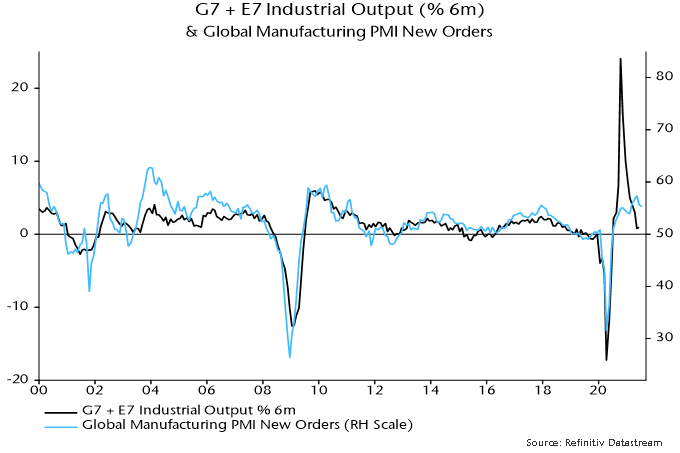
The PMI new orders index is a good indicator of underlying industrial momentum but output was held back by supply issues during H1, disrupting the normal relationship – chart 4. Output momentum could rebound temporarily in Q3 as supply constraints ease even as the PMI moderates.
Chart 4
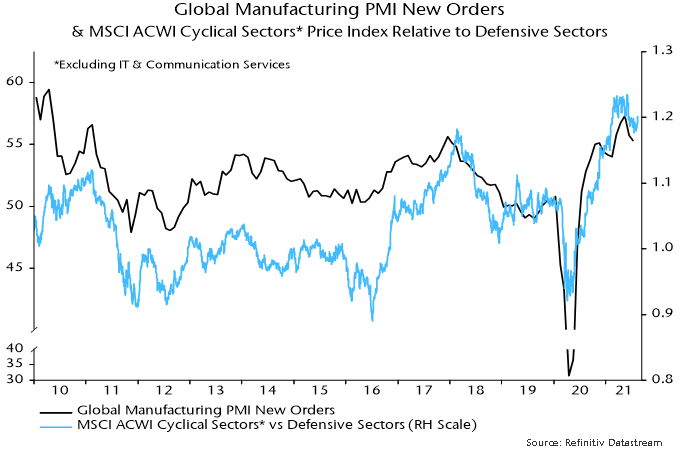
This possibility complicates market analysis. The performance of “traditional” cyclical equity market sectors (i.e. excluding IT and communication services) relative to defensive sectors has correlated better with PMI new orders than industrial output, suggesting that they will lag if the PMI slides – chart 5.
Chart 5
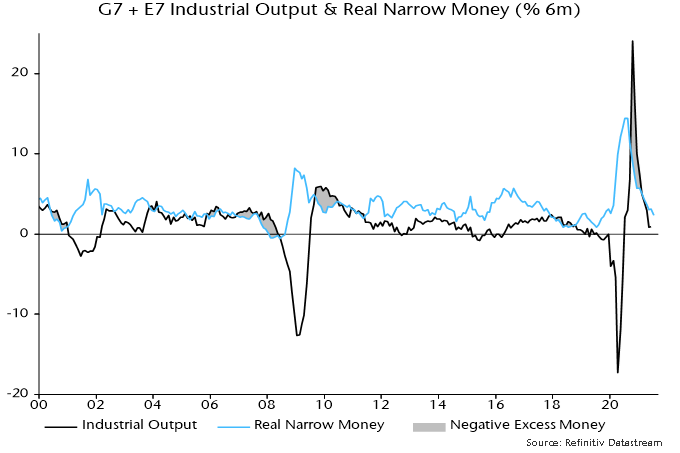
A near-term rebound in output momentum, however, could be relevant for assessing the monetary backdrop for markets. Global six-month industrial output growth fell back below real money growth in April – chart 6. The return to a positive real money / output growth gap may explain continued strength in equity market indices despite signs of economic cooling.
Chart 6
A negative cross-over, however, is possible if there is a large output catch-up effect and real money growth remains weak.
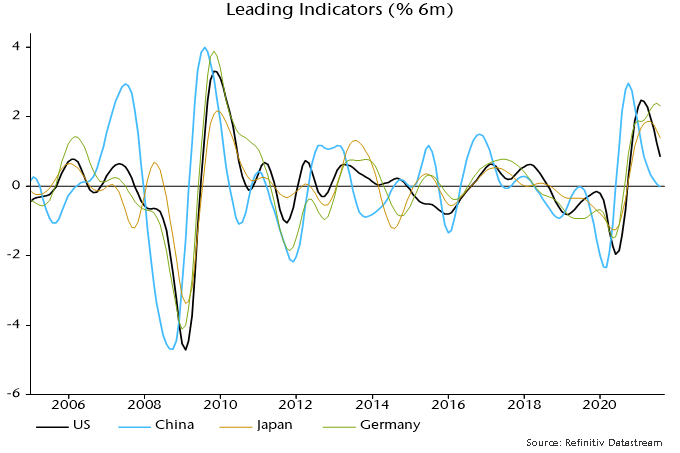
The monetary signal of an economic slowdown is starting to be confirmed by non-monetary leading indicators. Chart 7 shows six-month rates of change of composite indices based on the OECD’s methodology but calculated independently. The suggestion is that the loss of economic momentum now clearly visible in China will be mirrored in the US and the rest of the G7 in H2 2021.
Chart 7
This commentary is the first in a series in which we will profile our holdings and share high-conviction ideas in the emerging markets universe. Among the 27 countries classified as emerging by MSCI, we see a mixed bag of opportunities and challenges. Some of the constituents are candidates for an upgrade (e.g., Taiwan and South Korea), whereas a few others are on their way to being downgraded (e.g., Argentina and Pakistan). Despite facing different dynamics, the EM Small Cap universe of over 11,000 companies presents plenty of very sound investment ideas.
Indonesia is one of the countries that we overweight in our portfolio. It is the world’s fourth-most populous country, with over 270 million people spread across 17,000 islands. Indonesia enjoys strong demographic tailwinds, ongoing market-friendly reforms, massive under-penetration of multiple sectors (e.g., healthcare, real estate, consumer, and finance), a solid fiscal position, with a low debt-to-GDP ratio (36.62% in 2020), a stable current account (deficit of 0.44% in 2020), low and stable inflation, and solid FX reserves. According to the World Bank, the Indonesian economy is expected to grow by 4.4% and 5.0% in 2021 and 2022, respectively, subject to the effectiveness of the COVID-19 pandemic containment efforts, including the vaccination programs.
In early July 2021, Indonesia emerged as the new epicenter of the COVID-19 pandemic, with daily cases and deaths surpassing the levels reported by Brazil and India.[1] The country’s healthcare system is facing a horrendous challenge. The majority of its hospitals are operating at abnormally high occupancy rates due to the delta variant, as only 7% of the eligible population has been vaccinated so far. As sad as it sounds, this level is still much higher than in many other developing countries. The most recent data show encouraging progress in the infection rate, which prompted the government to begin unwinding social mobility restriction measures after a three-week implementation. Declining bed occupancy rates in some regions shows promising signs that the healthcare system is normalizing.
Private players dominate the hospital industry. In 2017, there were 2,776 hospitals in Indonesia, comprised of 1,009 public and 1,767 private hospitals. Presently, there are seven major private players: Siloam International Hospitals, Mitra Keluarga Karyasehat, Sejahteraraya Anugrahjaya Group, Sarana Meditama Metropolitan, Awal Bros Hospital Group, Hermina Hospital Group, and Ciputra Development. The sector is expected to benefit from rising disposable income in Indonesia in the long term. However, Greater Jakarta and a few other of the most populous areas are already relatively well penetrated by hospitals. However, the population living in the most underpenetrated regions do not have similar purchasing power, implying that healthcare operators should accept a different kind of economics. Another challenge for them is the shortage of doctors in regional hospitals. Specialist doctors can only graduate from government medical colleges in Indonesia. As a result, the healthcare system welcomes only 700-800 graduates annually, with half of them going to public hospitals. A brand-new hospital needs 30 to 40 specialists. The ongoing universal healthcare reform also adds uncertainty. As a result, most hospital chains are reluctant to expand outside of population centers. Therefore, we believe there is a better way to capitalize on that massive opportunity.
One of our holdings offers the key to solving that issue. Prodia Widyahusada (PRDA IJ) is the pioneer in private independent clinical laboratories in Indonesia, with the most extensive network and largest market share. It was established in 1973 by a group of idealists with a background in the pharmacy business. Prodia’s unmatched track record, strong brand, and long-term relationships with healthcare industry stakeholders provide a sustainable source of referrals and scientific breakthroughs. The company is the only independent clinical lab with the College of American Pathologists accreditation in Indonesia, which is considered to be the highest certification in the clinical lab industry worldwide.
In 2020, Prodia performed approximately 14 million tests for 3.1 million patient visits. The company has a solid operational track record, with the number of visits and revenue per visit growing at a 5.4% and 2.8% CAGR over 2016-2020, respectively. It provides the most comprehensive range of clinical lab tests catering to the needs of a broad client base. Key types of routine tests include lipid profile, hematology kidney function, liver function, thyroid panel, glucose, HbA1c, urinalysis, coagulation testing, and endocrinology panel. Since its inception, the company has focused on innovation and introduced many clinical laboratory tests and technologies in Indonesia. The main types of non-routine tests include nutrition panel, trace element testing, vitamin D testing, autoimmune panel, molecular-genetic testing, and osteoporosis panel. Non-routine tests contributed 20% of total revenue in 2020, up from 16% in 2018. Genomic testing contributes 25% of non-routine tests revenue and grows at 30-40% annually. The price of Prodia’s new genomic sequencing tests’ range from IDR 7 to 10 million or 10 to 15 times the average revenue per visit. Benefiting from its pricing power, the company was able to raise prices by 5-10% annually from 2014 to 2020. Prodia’s fixed costs account for a high proportion of expenses, underscoring its operating leverage.
Prodia leverages a scalable hub-and-spoke business model, whereby specimens are collected across multiple locations for delivery to a local clinical laboratory or the Prodia Referral Lab Services for centralized clinical laboratory testing. This way, it can ensure superior quality and reliability, as well as economies of scale. The spokes facilitate deeper penetration within regions, strengthening the brand and driving higher volumes. The efficiency of a clinical laboratory improves with increasing test volumes, making automated tests less expensive and labs more cost-efficient. Outlet expansion generally requires light capital investments, as the testing equipment is provided by vendors free of charge, as long as Prodia purchases raw materials for testing from them. Moreover, specimen collection is made by qualified nurses and not doctors.
According to IQVIA, Indonesia’s private independent lab market was worth IDR 4.5 trillion in 2019 (20% of the total diagnostic market size). It grew at an 8.3% CAGR over from 2017 to 2019 (compared to 9.1% for Prodia). The non-routine test market is expected to grow at a 9.4% CAGR from 2018 to 2024. Prodia’s market share is 39.2% in 2019 (compared to 38.8% in 2018), larger than the following five players combined, at 33.9% (Kimia Farma, Pramita, Parahita, BioMedika, and Cito). Moreover, Prodia faces almost no competition in non-routine tests.
Its growth strategy is based on introducing new tests, including next-generation diagnostic technologies, and expanding the network via both physical and digital channels. Prodia is developing an omnichannel presence. The pace of new physical lab openings will likely slow due to the focus shift on digital services via Prodia Mobile. The app is a game changer, providing clients with many functionalities. They can book and pay for tests, choose the point of collection, track results, and share them with a specific clinic or hospital. The clients’ response has exceeded management’s expectations. In 2020, Prodia acquired 30% of new patients through its Mobile App, primarily millennials. Digital revenue accounted for 0.6-0.7% of total sales in 2020, growing by 67% year-over-year, while management expects it to expand by more than 100% in 2021. The company’s pace of growth is poised to accelerate on the back of rising disposable income and increasing awareness of preventive healthcare. Prodia demonstrates high profitability and cash-flow generation; it has a pristine balance sheet, with net cash accounting for 18% of its market capitalization.
The company is run by a professional and experienced management team with a strong track record in delivering superior growth and innovation. Andi Wijaya, the Chairman and co-founder, continues preaching relentless focus on innovation and service quality. A group of co-founders maintain 75% ownership of the company.
Prodia has a very strong ESG profile, which is well presented in its comprehensive sustainability report, published annually. The CEO and chairman roles are separated. Two out of five directors are independent. The company demonstrates substantial diversity, with two out of five female directors and four out of five female executives, including the CEO. Prodia has established green infrastructure to improve efficiency and conservation of energy and water resources. It manages the medical and non-medical waste in a responsible manner. In collaboration with Indo CorAlliance, Prodia carries out a coral reef revitalization program on Nusa Penida, Bali. The company is actively involved in other projects aimed towards improving the well-being of Indonesians. It funds scholarships and grants for researchers.
Low stock liquidity has been a well known concern for investors in this story. However, because of the quality growth profile of the company, we believe that multiples will expand given its consistent quality growth profile and attractive valuation relative to global peers.
The COVID-19 pandemic has multiple effects on Prodia. In the short term, non-essential test volumes are negatively impacted by the social restriction measures. At the same time, the pandemic drives new revenue streams, including PCR testing, pre-vaccination check-ups, participation in independent vaccination programs, post-vaccination antibody testing, and blood viscosity testing for COVID-19 survivors to detect blood clot risks. This demand might be sustainable even beyond 2022, as the world adapts to a new normal.
We believe that Prodia offers attractive exposure to the secular growth in an underpenetrated healthcare market, being an industry leader, leveraging its recognized brand and most extensive network, and led by an experienced management team with a strong track record in delivering consistent growth and innovations.
The economic / market view here remains cautious based on 1) an expected slowdown in global industrial momentum through H2 (already apparent in Chinese data) and 2) recent less favourable “excess” money conditions.
Global six-month real narrow money growth, however, may have bottomed in May / June. A Q3 rebound would signal a stronger economy in H1 2022. An associated improvement in excess money could reenergise the reflation trade in late 2021.
The issue can be framed in cycle terms: does the recent top in the global manufacturing PMI new orders index mark the peak of the stockbuilding cycle (implying a shortened cycle) or will the peak be delayed until H1 2022?
Possible drivers of a real money growth rebound include Chinese policy easing, a slowdown in global consumer price momentum and a pick-up in US / Eurozone bank loan expansion.
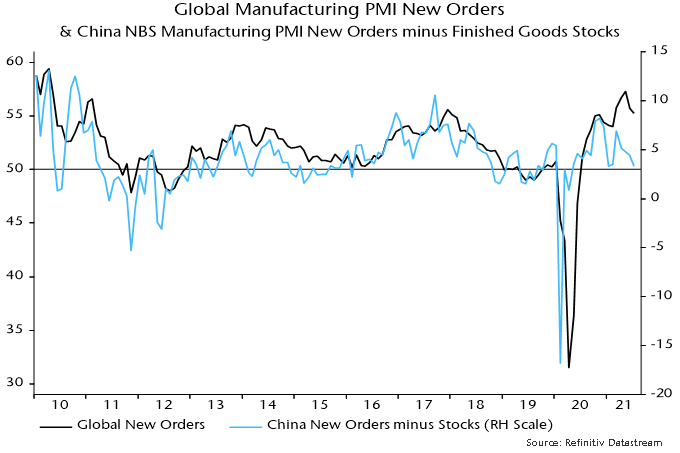
The H2 industrial slowdown view remains on track. The global manufacturing PMI new orders index fell further in July, confirming May as a top. Chinese orders were notably weak and have led the global index since the GFC – see chart 1.
Chart 1
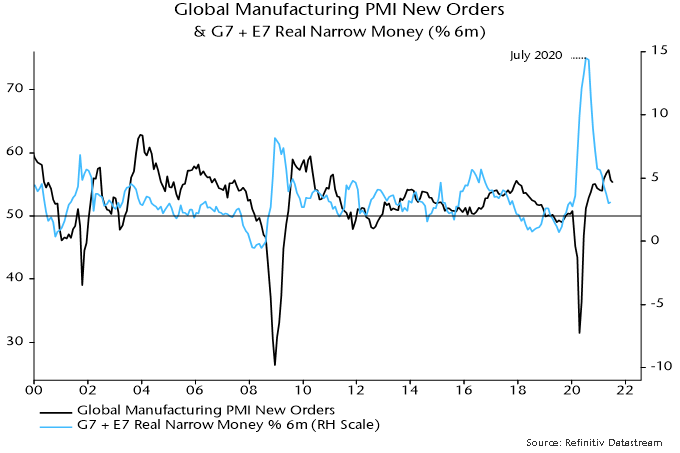
Global six-month real narrow money growth fell steadily between July 2020 and May but a stabilisation in June has been confirmed by additional monetary data released over the last week – chart 2.
Chart 2
Will PBoC policy easing drive a recovery in Chinese / global money growth? The hope here was that the 15 July cut in reserve requirements would be reflected in an early further fall in money market interest rates and easier credit conditions. Three-month SHIBOR, however, has moved sideways while corporate credit availability is little changed, judging from the July Cheung Kong Graduate School of Business survey – chart 3. July money data, therefore, could show limited improvement.
Chart 3
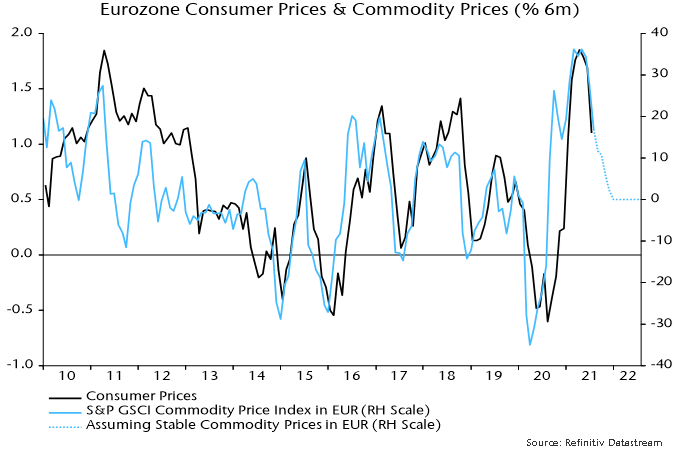
Global six-month real money growth should receive support from a slowdown in consumer price momentum as commodity price and bottleneck effects fade. Eurozone six-month CPI inflation eased on schedule in July, with further moderation suggested and the move lower likely to be mirrored in other countries (Tokyo July numbers also showed a slowdown) – chart 4.
Chart 4
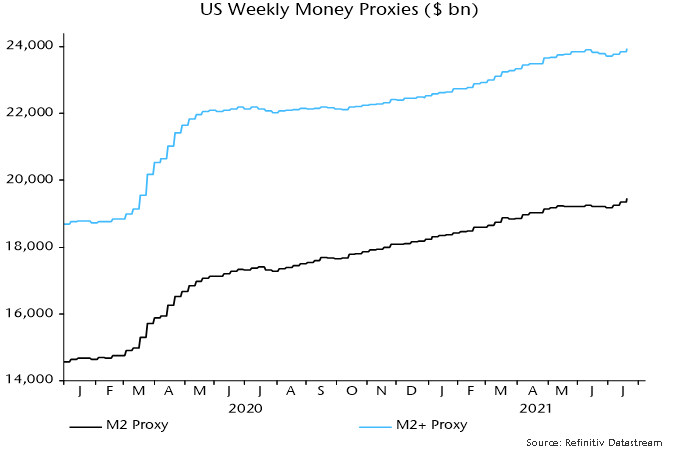
US monetary prospects are foggy. Disbursement of stimulus payments boosted nominal money growth over March-May but there was a sharp slowdown in June. Weekly data indicate a reacceleration in July as the Treasury ran down its cash balance at the Fed to comply with debt ceiling legislation – chart 5. This effect, however, will be temporary and an improving fiscal position suggests a reduced contribution from monetary financing during H2 and into 2022.
Chart 5
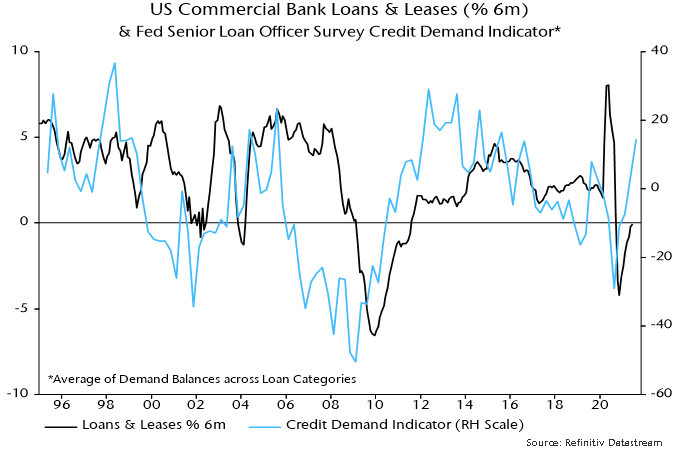
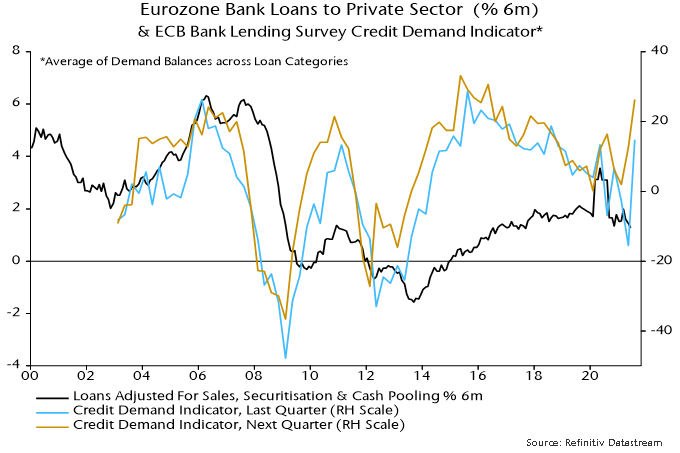
Stable or higher US money growth, therefore, may require a pick-up in bank loan expansion. The Fed’s July senior loan officer survey, released yesterday, is hopeful, showing a further improvement in demand balances across most loan categories (not residential mortgages) – chart 6. The ECB’s July lending survey gave a similar message – chart 7. The survey indicators, however, are directional and the magnitude of a likely loan growth pick-up is uncertain. Actual lending data remained soft through June.
Chart 6
Chart 7
Failure of global real money growth to recover in Q3 – and especially a further slowdown – would suggest that the stockbuilding cycle is already at or close to a peak. The cycle bottomed in Q2 2020 and – based on its average historical length of 3.33 years – might be expected to reach another low in H2 2023, in turn implying a peak no earlier than H1 2022. As previously discussed, however, the current upswing could be short to compensate for a long (4.25 years) prior cycle.
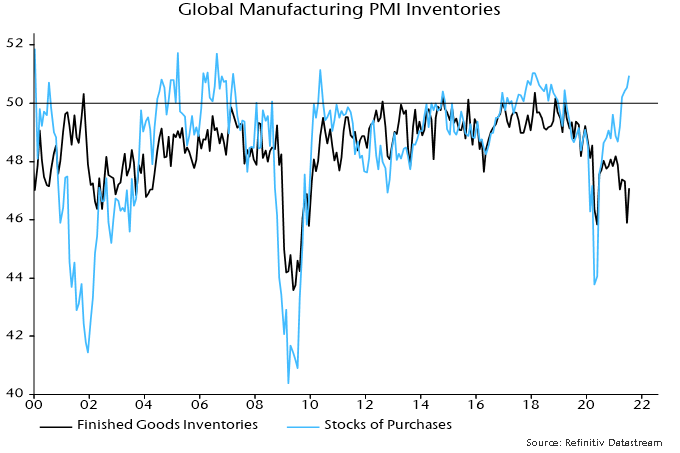
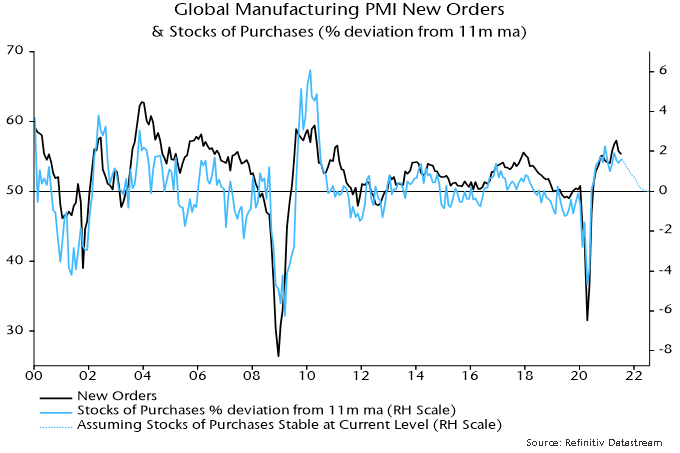
Proponents of the consensus view that replenishment of stocks will underpin solid industrial growth in H2 cite the still-low level of the global manufacturing PMI finished goods inventories index – chart 8. Research conducted here, however, indicates that the stocks of purchases index (i.e. raw materials / intermediate goods) is a better gauge of the stockbuilding cycle and tends to lead the finished goods index. The former index is already at a level consistent with a cycle top and the rate of change relationship with the new orders index is another reason for expecting orders to weaken significantly during H2 – chart 9.
Chart 8
Chart 9
Among companies globally, which country accounts for the highest percentage of companies that are over 100 years old? The answer is Japan, with about 33,000 companies at least a century old (approximately 40% of total companies). These companies tend to prioritize values such as commitment, quality, community, and tradition over financial logic.
Business longevity is one of the benefits of sustainability, a concept that is deeply rooted in Japan. Japanese culture also has a profound appreciation of nature. Corporations and individuals have a strong attachment to their community and wider society. Many companies promote lifelong employment, environmentally-friendly processes, product safety, and harmonious relationships among stakeholders.
In October 2020, Japan pledged to achieve carbon neutrality by 2050. A month later, the Japanese House of Representatives and the House of Councilors declared a climate emergency, indicating that tackling climate change is not a partisan issue. We believe such policy continuity builds a solid foundation for Japan to execute its Green Growth Strategy.
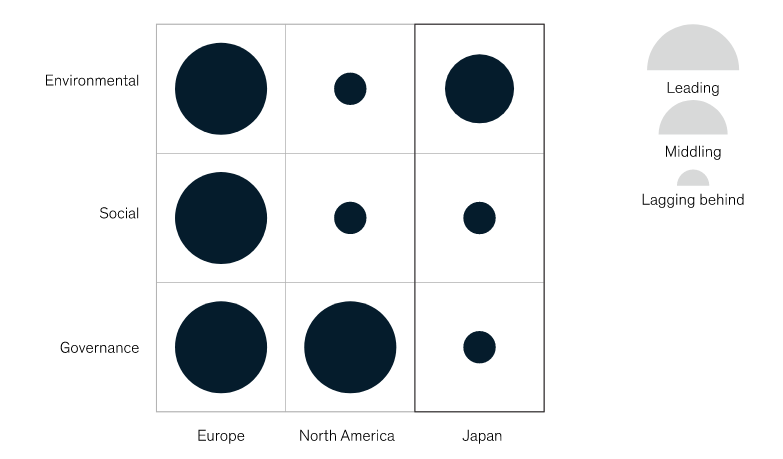
Currently, Japan’s ESG performance is lagging behind Europe and North America. McKinsey assessed the ESG performance of 621 companies in Europe, Japan, and North America from 2019 to 2020, based on 120 third-party ESG indicators, from carbon emissions to community relations to shareholders’ rights.
ESG Performance (Large and Smaller Companies Combined)
Source: McKinsey analysis 2021
We believe the above results are more or less expected, considering Japan’s late start. The good news is that from governments to corporations, the topic of ESG is now front and center.
In a recent survey conducted by the GPIF, the 6th annual survey of Japanese listed companies regarding institutional investors’ stewardship activities, the results showed continuous progress in ESG activities.
Many companies pointed out the following common issues as the major themes in their ESG activities: corporate governance (71.7%), climate change (63.6%), and diversity (43.2%).
Themes that surpassed the ratio in the previous survey include climate change (+9.7%), health and safety (+8.0%), and environmental opportunities (+3.8%).
Companies are more proactively working on information disclosure, not only through integrated reports, but also through new disclosure criteria, such as the Task Force on Climate-related Financial Disclosures (TCFD); 31% of respondents have endorsed the TCFD.
Japan has been making regular revisions to strengthen the ESG guidelines. Last April, a new proposal was published by the Council of Experts regarding the revision of Corporate Governance Code and Guidelines for Investor and Company Engagement. We are glad to see more stringent guidelines than before to enhance board independence, diversity, ESG reporting and many other areas. Japan is also expected to announce its 6th basic energy plan to lay out details towards carbon neutrality.
As a long-term investor in Japan, we’ve definitely witnessed companies improving ESG practices since 2015. With many new initiatives coming, we believe Japanese companies have great potential to improve their ESG practices and create more value.
VANCOUVER, July 21, 2021 – Connor, Clark & Lunn Investment Management (CC&L Investment Management) is pleased to announce its endorsement of the recommendations of the Task Force on Climate Related Financial Disclosures (TCFD). As stewards of the assets entrusted to the firm by clients, CC&L Investment Management recognizes its responsibility and leadership role in advocating for capital market integrity. CC&L Investment Management will actively encourage investee companies to incorporate the TCFD recommendations in their future disclosures.
“CC&L Investment Management is committed to reporting to our clients and other interested parties on our approach as we take steps to adopt these measures into our own business over time,” said Martin Gerber, President & Chief Investment Officer, CC&L Investment Management. “CC&L Investment Management has a robust Responsible Investing (RI) policy that encompasses our overall approach to the integration of environmental, social, and governance (ESG) issues into our investment processes. Fundamental to our approach is our belief that our portfolios and engagement activities must reflect the reality that the global economy is in the midst of a large-scale transition to lower carbon emissions.”
Through its endorsement of the TCFD, CC&L Investment Management commits to undertaking certain activities and reporting on these activities within the recommended TCFD framework. The four pillars of the TCFD framework include: Governance, Strategy, Risk Management, and Metrics and Targets.
CC&L Investment Management believes that the management teams of the companies it invests in have a duty to be transparent in their disclosures, and accountable to all stakeholders. Further, better disclosures will allow CC&L Investment Management’s investment teams to reflect on the risks that are inherent in companies that are slow to transition, as well as uncover opportunities related to earlier adoption of new technologies and innovation. Finally, CC&L Investment Management believes the firm has a duty to be transparent, and its TCFD report will be available to stakeholders in the near term.
About Connor, Clark & Lunn Investment Management Ltd.
Connor, Clark & Lunn Investment Management Ltd. (CC&L Investment Management) is one of the largest independent partner-owned investment management firms in Canada with $55.9 billion in assets under management. Founded in 1982, CC&L Investment Management offers a diverse array of investment services including equity, fixed income, balanced and alternative solutions including portable alpha, market neutral and absolute return strategies. CC&L Investment Management is a part of Connor, Clark & Lunn Financial Group Ltd.
Contact
Lori Satov Portfolio Manager, Client Solutions Connor, Clark & Lunn Investment Management (604) 643-5819 [email protected]