post in October gave a hopeful view of Chinese prospects, noting that “excess” money had accumulated and could flow into equities and the economy if policy-makers signalled a commitment to expansion.

The consensus is now optimistic, believing that property market support measures and the removal of pandemic control restrictions will result in strong economic acceleration through 2023. Yet the latest money / credit data signal caution.

Globally, Chinese reopening is expected to be reflationary. Reopening, however, will release supply as well as demand. The former effect could dominate, resulting in additional downward pressure on Chinese export prices.

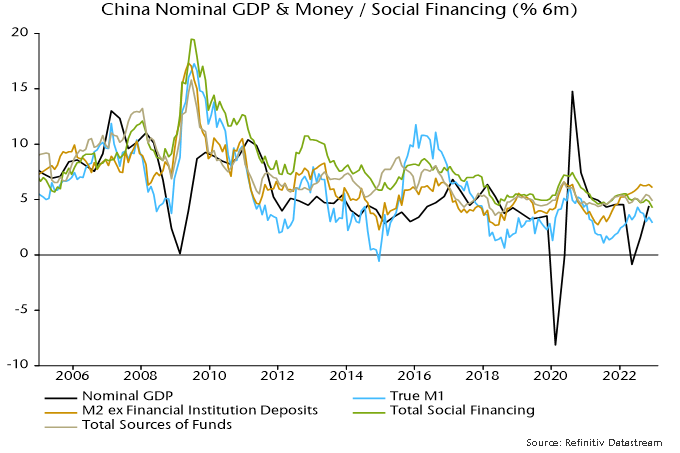
Six-month growth of true M1 peaked in July 2022, falling back to its March level in December – see chart 1. This suggests a slowing of underlying nominal GDP momentum from Q2. The levels of nominal and real narrow money growth are modest by historical standards. 

Chart 1

Chart 1 showing China Nominal GDP & Money / Social Financing (% 6m)

Broad money trends are stronger, with six-month growth of the favoured measure here – M2 excluding deposits of non-bank financial institutions – ending 2022 near the top of its range in recent years. Money, however, needs to shift from time deposits into M1 to signal rising confidence and spending intentions. 

Broad money growth may have been inflated by a switch out of wealth management products and other bank liabilities into deposits. The total stock of bank funding has been growing less strongly, with minimal acceleration since 2021 – chart 1. 

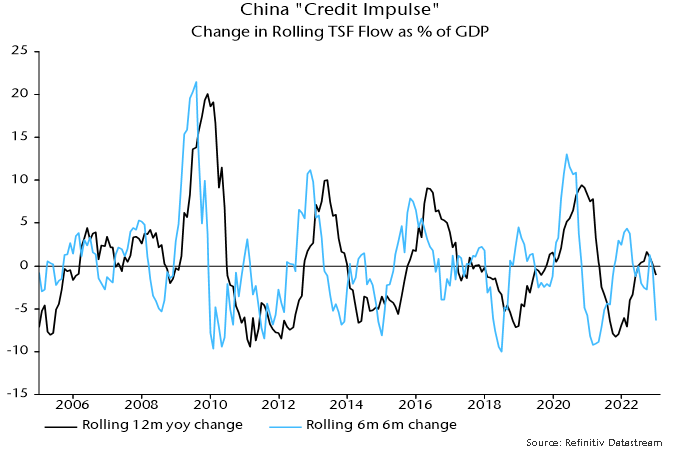
Many analysts follow the “credit impulse” – the rate of change of credit growth, usually expressed relative to GDP. This often gives the same message as narrow money trends (but is judged here to be less reliable) and also suggests a loss of economic momentum – chart 2. 

Chart 2

Chart 2 showing China “Credit Impulse” Change in Rolling TSF Flow as % of GDP

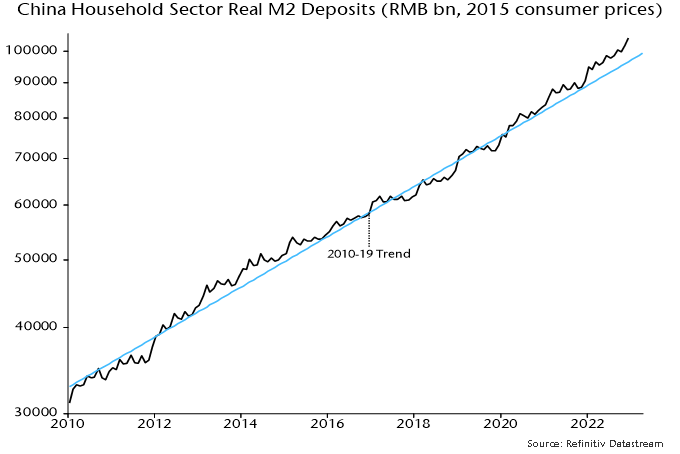
Bulls argue that excess household savings will fuel a consumption boom, drawing parallels with G7 experience following reopenings. Chinese households did not receive stimulus checks or direct wage support and the excess is likely to be considerably smaller, implying less pent-up demand. 

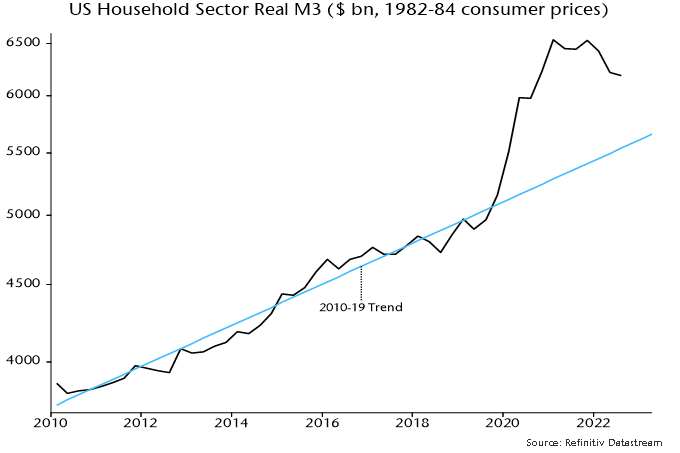
Supporting this view, household real M2 deposits in December were 8% above their pre-pandemic trend (and may have been inflated by the early timing of the Chinese New Year) – chart 3. US household real M3 holdings reached a peak 24% overshoot of the comparable trend in March 2021 – chart 4. 

Chart 3

Chart 3 showing China Household Sector Real M2 Deposits (RMB bn, 2015 consumer prices)

Chart 4

Chart 4 showing US Household Sector Real M3 ($ bn, 1982-84 consumer prices)

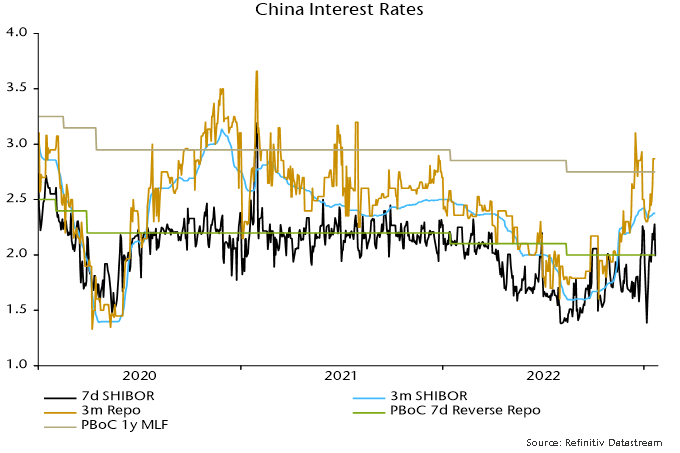
Fed policy remained expansionary as pandemic drags faded. The PBoC, by contrast, appears concerned about inflationary risks from rapid reopening and has engineered or at least tolerated a significant rise in term money rates. The increase in late 2022 was universally dismissed by China specialists as a year-end phenomenon unrelated to any policy shift but a minor fall in early January has since given way to another rise – chart 5. 

Chart 5

Chart 5 showing China Interest Rates

The view here is that the reopening boost to domestic demand will be modest and biased towards services. For goods, supply expansion due to reduced disruption may outweigh the lift to demand. 

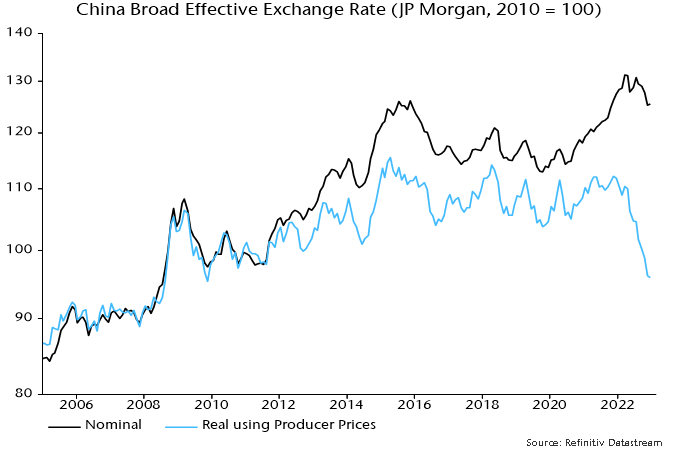
Global trade moved into contraction in late 2022, partly reflecting an accelerating downswing in the global stockbuilding cycle. With supply constraints easing, Chinese exporters are likely to cut prices to increase market share, especially given the super-competitive level of the RMB – chart 6. 

Chart 6

Chart 6 showing China Broad Effective Exchange Rate (JP Morgan, 2010 = 100)
Customer scanning QR code in coffee shop to make a cashless payment online.

The story of Little Red Riding Hood is perhaps the most implausible of all the pre-17th century European folk tales. Just how – a rational mind may presume – does a little girl mistake a ravenous wolf for her own grandmother? Like many such fables, the beauty in the Grimm brothers’ work lies in the extraction of rich metaphorical meaning from absurdity. Timeless lessons that have a habit, for those paying attention, of occasionally popping up in unexpected areas of our lives like a sagacious Whac-a-Mole. While Little Red Riding Hood is hardly a fulsome guide to investing, her ill-fated demise due to a case of mis-identity may still offer a lesson for investors.

As fundamental equity investors, it is critical that our decisions stem from objective reasoning. Spending each day striving to achieve the clarity of thought that comes with truly unbiased, matter-of-fact thinking, honed by experience and devoid of prejudice, is key not only to our long-term success but also in upholding the fiduciary duty to our clients.

It is why our philosophy centres on two simple ideas: invest with conviction and act with humility. The guiding principles behind each of our decisions that help us uncover wolves concealed amongst even our highest conviction ideas, and prevents deception from the seemingly familiar becoming – ironically – all too familiar.

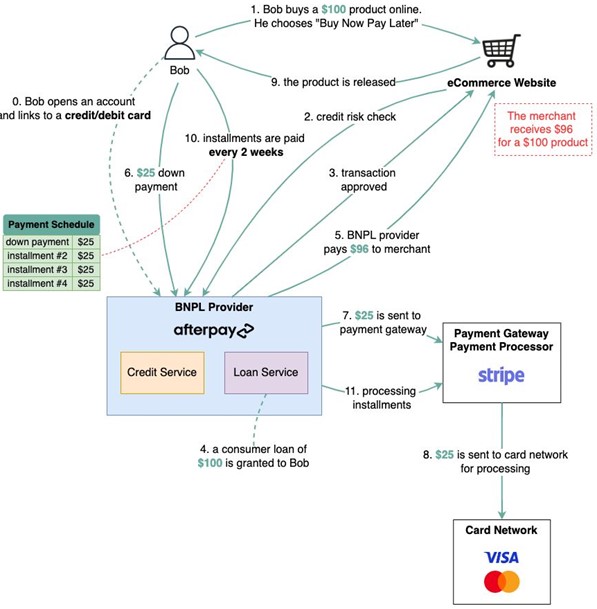
Buy-now-pay-later (BNPL) is one concept that we believe can be particularly deceptive. To the unassuming consumer, BNPL is wonderfully ingenious. Credit risk for your transaction is shouldered by the merchant from whom you purchase. It looks, smells and tastes like free money. Only alas! On closer inspection we find that BNPL is in fact just a craftily marketed, dolled up version of the same age-old credit process. Soft pastel colours and smiling millennials may have replaced images of burly debt collectors demanding pounds of flesh, but the core underlying credit agreement between consumer and lender remains unchanged. Missed payments will still result in the same letters in the post, demanding the same penalizing late fees. And opening them will still provoke the same sense of incredulity as you jump up and shout, “Oh my! I didn’t realise what big teeth you have!”

Figure 1: A typical BNPL transaction

Source: ByteByteGo Newsletter; blog.bytebytego.com

Contextualising BNPL as a branch of consumer credit is a prerequisite to appreciating its value. The ongoing arms race between technology giants Grab, GoTo and Sea Ltd over Southeast Asia’s 120 million Indonesian labour force participants who do not own a credit card is the archetype of the modern fintech battle that we see across many of our markets. There are millions of people in Egypt, Vietnam, Philippines, Nigeria, Kenya and Bangladesh without access to consumer credit, but poor pre-existing infrastructure makes it difficult for highly focused credit products such as BNPL to gain traction.[1] Here, the spoils of war will not be won on credit alone. Funding gaps of such depth and complexity must instead be addressed by a broad arsenal of fintech services including digital banking, cashless payments, credit reporting and cross-border transactions.

Alibaba’s Alipay is arguably the best example to-date, and its success in China has created a blueprint for many platform businesses within our markets. A collection of fledgling financial Megazords working to refine the configuration of their autonomous product constructs. For many it remains a work-in-progress. However, there are exceptional cases that indicate some may have found a winning formula.

Nestled away in a market of just 19 million people, Kaspi.kz has built a formidable application that boasts a user base comprising over 95% of the adult population of Kazakhstan. What originated as a humble Tier 2 bank has emerged over the last decade as the largest payment network, e-commerce platform and consumer finance business in the country.[2] Today, Kaspi.kz processes more transactions in Kazakhstan – where over two thirds of all transactions are cashless – than Visa and MasterCard combined.[3] Online purchases through the 260,000 active merchants on the platform account for over 70% of the entire e-commerce market.[4] And in 2021 they distributed over twice the amount of consumer loans compared to the largest and most systemically important bank in the country. In short, Kaspi.kz is not just a part of the fintech revolution in Kazakhstan. It is the revolution.

Figure 2: Kaspi.kz has multiple payments, e-commerce and credit products within a single application

Source: Kaspi.kz

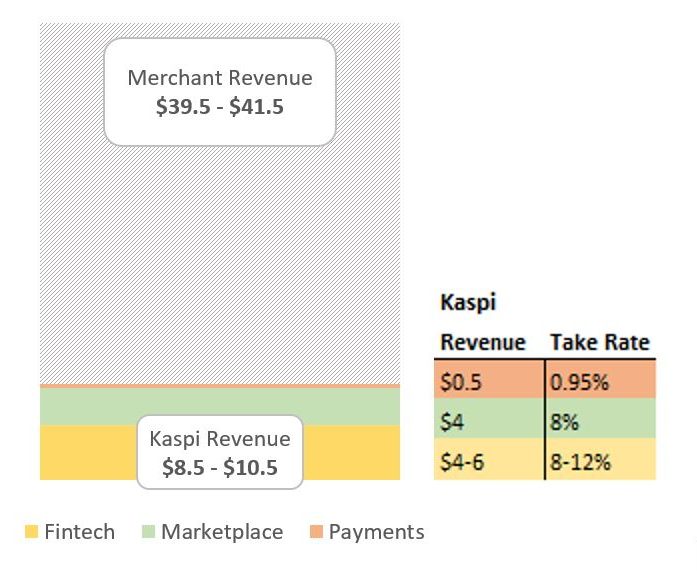
Indeed, outside of China, one would be hard pressed to find a company that has a firmer grip on the consumer spending journey than Kaspi.kz enjoys in Kazakhstan. In providing a place to purchase, a method to purchase and the means to fund that purchase, Kaspi.kz owns every commercial touchpoint of the transactions through its platform, thereby gaining access to the maximum profit pool of each consumer. Consider someone making a US$50 online purchase, funded through a three-month, 0% interest BNPL product. That single transaction has three revenue channels for Kaspi.kz, equating to between US$8.5 and US$10.5 in revenue. That is a whopping 17-21% of the overall transaction value.[5]

Figure 3: Revenue distribution for $50 e-commerce transaction funded through 3month BNPL

Sources: Kaspi.kz; Vergent Asset Management

The roots of success are often multifaceted, and Kaspi.kz is no exception. No doubt there are traces of the Matthew Effect, but equally we see attempts to deploy the same payments-marketplace-consumer finance trifecta in other markets as far inferior.[6] In our view, the triumph of Kaspi.kz in Kazakhstan is not as much in the business mix as it is in how those businesses are woven together. And in this case all yarns lead back to BNPL.

Figure 4: Kaspi.kz’s three businesses benefit from a strong network effect

Source: Kaspi.kz

Contrary to the traditional BNPL model of maximising standalone yields, Kaspi.kz utilizes BNPL as the engine room to drive the average transaction value (ATV) and volume of its users high enough to maximise the revenue of the entire platform. Incremental transactions generate proprietary data points on each user that pollinate other revenue generating areas of the business, whilst simultaneously diluting cost centres such as product development, sales and marketing, and risk management. That arms Kaspi.kz with new products and data to support more informed lending decisions, and thus the cycle repeats. Such is the potency of this lending model that through 2021— a period when the three global BNPL giants collectively burnt over US$1 billion of cash— Kaspi.kz’s standalone lending business generated a return on equity of over 45%.[7]
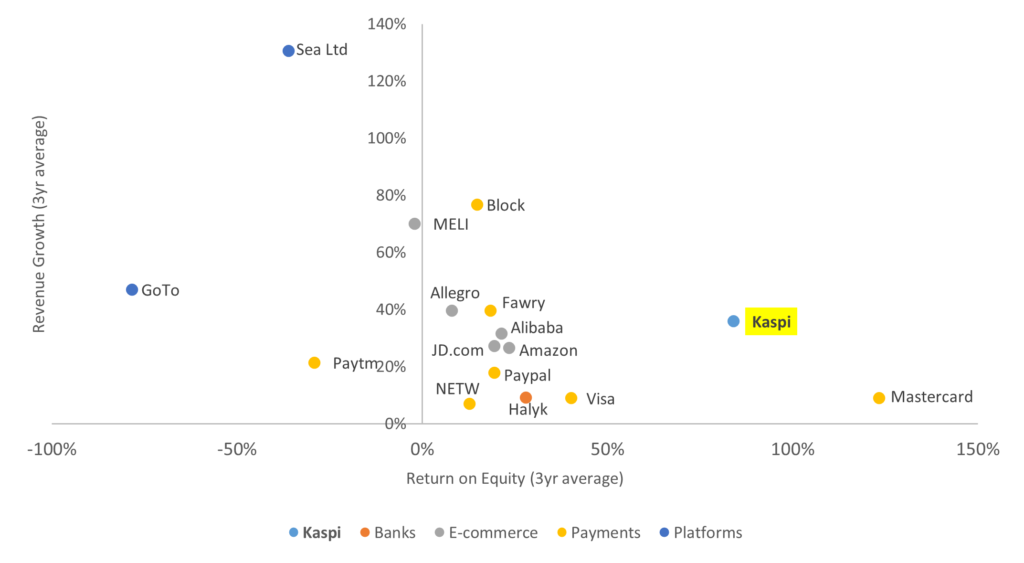
One of the most compelling upshots from this model is the impact on growth. Revenues magnified by intertwined, self-perpetuating products have a diluting effect on the cost base, sending operating leverage into overdrive. As a result, Kaspi.kz has managed to grow revenues at a 34% CAGR since 2019, despite spending on average just 4% of revenue on sales and marketing.[8] Even more astounding is that this growth was delivered at an average net margin of over 40%, for a combined growth and return profile that is best-in-class on an industry, regional and even global basis.

Figure 5: Revenue growth (three-year average) vs. return on equity (three-year average) for comparable peers

Sources: Bloomberg; Company Filings; Vergent Asset Management

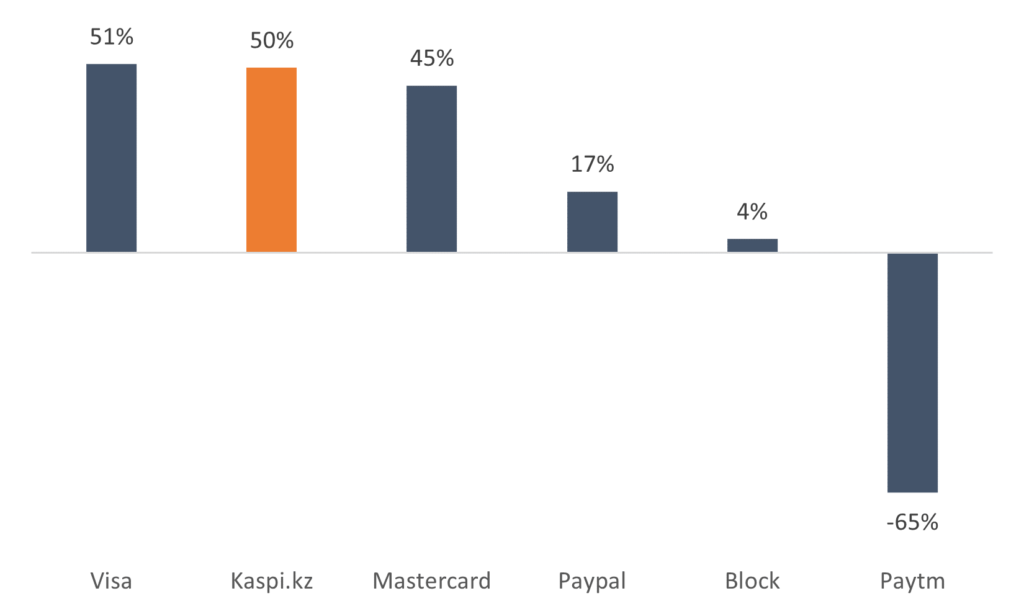
Consequently, Kaspi.kz enjoys the luxury of being able to subsidise strategic products profitably. In the marketplace business that means providing 95% of deliveries free of charge whilst still operating at over 60% net margin. Within payments, it means monetizing less than 10% of the peer-to-peer (P2P) transactions that constitute over 75% of total payments volume, thereby forgoing the lucrative interchange fee that typically represents the largest revenue line for digital banks, including Monzo and Revolut, as the cost of customer acquisition. That Kaspi.kz’s standalone payments business can still deliver net margins comparable to the largest and most successful global payments companies, despite surrendering these fees and operating in a market a fraction of the size, speaks to the harmony of its consolidated platform.

Figure 6: Net income margins of payments peers (three-year average to last reported period)

Source: Bloomberg; Kaspi.kz
Data shown for Kaspi.kz is the standalone payments business

The term super-app is overused and, in our view, frequently misunderstood. Sifting through investment decks of the not-so-super, the moderately-super or even the one-day-we-are-sure-to-be-super apps that flood our markets can at times feel like dragging a philistine through a modern art exhibition. No matter how fervent the arguments may be that the blue square in front of you is a masterpiece – a unique perspective on modernism – to the untrained eye it all looks rather the same. When we suggest that Kaspi.kz is emerging as one of the few genuine super-apps it is not because the platform tells the same exhausted story of having multiple products under one roof. Strength here is not in numbers: It is in the intricate design of each product such that the sum of all products is greater than the parts.

Critically, the platform must have ‘plug and play’ compatibility with new products. Acting as a magnet for new services that yearn for an adrenaline shot of growth is vital for keeping the platform sharp, competition blunt, and deepening the competitive moat of any aspiring super-app.

Take for example, Santufei, a negligible rail and airline ticketing vendor that comprised just a handful of people and a few basic aggregator relationships when Kaspi.kz acquired it in August 2020 for a paltry US$5 million. Today, that business (rebranded ‘Kaspi Travel’) sells over 70,000 tickets per month through what is now the largest rail and ticketing platform in the country. And travel tickets are just the start. There is a not-so-distant future where we foresee an office worker in Almaty ordering a taxi after a long day, getting home to receive promotions for their favourite takeaway, placing an order and then tipping the delivery driver all through Kaspi.kz. In this world, it is 3rd party developers that must bow as Kaspi.kz ascends to the gilded heights of consolidator. The gatekeeper to an ecosystem so rich that 3rd parties are forced to cede a slice of the economics, despite assuming all the business risk.

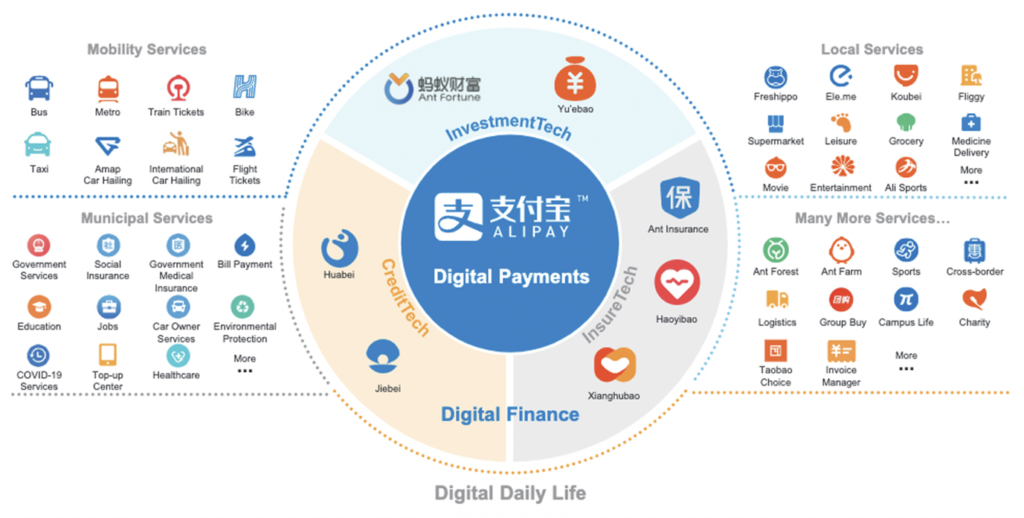
Platform compatibility is also relevant for the merchant base. Many services unbeknownst to consumers such as B2B payments, supply chain management solutions and merchant credit services offer equally attractive economic prospects, if not a means to entrench the platform deeper into the Kazakhstan economy than their consumer product counterparts. One only needs to look at the breadth of services offered through Alipay today to get a sense of how much more room there is for Kaspi.kz’s platform to grow.

Figure 7: Alipay offers insight into what the future Kaspi.kz platform may look like

Source: Alibaba; Vergent Asset Management

Although the example of Alipay offers a glimpse as to the end state for every aspiring super-app, we must remember that by no means does it reflect the sole operating model. Platforms with origins in payments will differ to those grown out of e-commerce, financial services, or one of the countless other services that can support the initial acquisition of customers. In our view, it is the understanding of this centrality that becomes essential in helping us see beyond a familiar and otherwise undifferentiated countenance.

So while Kaspi.kz will march on, continuing to forge new products against the idiosyncrasies of Kazakhstan, the near-term focus for us will remain firmly on BNPL. For today, that is the beating heart of the company’s ecosystem. The consumer credit juggernaut that in equal measures poses the greatest risks and opportunities to sustainable growth.[9] That we maintain our diligence, stay grounded in our approach and appreciate the consumer credit business for what it really is, will give us the best chance – we hope – of seeing Kaspi.kz write its own fairy tale ending.


[1] Based on ~139 million labour force and ~17 million credit cards in circulation. Sources: World Bank; Bank of Indonesia.

[2] Grossly simplified, Kaspi.kz is probably best thought of as a combination of Revolut, Paypal and Taobao. A somewhat fitting unity of East and West.

[3] Source: Analysis of the payment market in the Republic of Kazakhstan, PWC (March 2022).

[4] Source: Analysis of the retail e-commerce market in the Republic of Kazakhstan, PWC (October 2022).

[5] Moreover, this example is conservative. BNPL products that exceed three-months draw interest from the consumer and higher take rates from merchants, while certain e-commerce categories also command higher take rates.

[6] Taken from the Gospel of Matthew and popularized as the Power Law, the Matthew Effect is based on the idea that market leaders will attain a disproportionate amount of value over time. For companies with large network effects, that typically means being first to market.

[7] The three global BNPL giants referenced here are Klarna, Affirm and Afterpay, which reported US$631 million, US$431 million and US$159 million FY21 net losses respectively.

[8] Calculated as three years to June 2022.

[9] Macroeconomic risks associated with Kazakhstan are also at large, and the exclusion here for simplicity should not be confused with insignificance.

Microphone on stage in an auditorium.

For fans of Seinfeld, the line “What’s the deal with…” reminds us of a particular brand of observational comedy from the 90’s. Well, turns out 90’s humor is still a big deal, as Netflix paid half a billion dollars in 2021 for the streaming rights of Seinfeld. Not bad for a show about nothing. As we kick off a brand-new year, we thought it’s the perfect time to ask ourselves “What’s the deal with EM small cap…?”

For most investors, emerging markets (EM) as an asset class is high on the risk spectrum. They could be forgiven for thinking of small caps within EM to be a step too far. The EM small cap universe (EM SC) for the most part is ignored or misunderstood. We hope to change a few perceptions along the way by shining a light on EM SC as potential ground for adding alpha.

Added value

Before we begin to answer “What’s the deal with EM small caps…” let’s look at how MSCI EM SC has performed compared to its all-cap counterpart, MSCI EM. As seen below, whether on a three year, five year, 10 year or 20 year period, the MSCI EM SC index adds value compared to its all-cap counterpart. At the start of 2023, as we possibly enter a prolonged period of higher inflation and interest rates, we expect small caps to outperform by leveraging the flexibility and nimbleness that comes with smaller size and lower bureaucracy.

% Annualized USD Returns

3 yr5 yr10 yr20 yr
MSCI EM SC5.38%1.32%3.45%9.60%
MSCI EM-2.42%-1.10%1.77%9.04%
Source – Bloomberg. As on 30 Dec 2022.

A big stage

The reasons for its relative outperformance are many. Let’s start off with the fact that the EM SC universe is vast, with plenty of space to find the next big compounder among 11,000 companies, 24 countries and 11 sectors. The benchmark index – MSCI EM SC (MXEFSC) – is constructed with no index weight bias. Also, except for Taiwan, there is no sector bias among the big countries that constitute the index. This size and diversity mean that the EM SC universe offers plenty of scope for portfolio diversification and alpha generation.

Low to no coverage

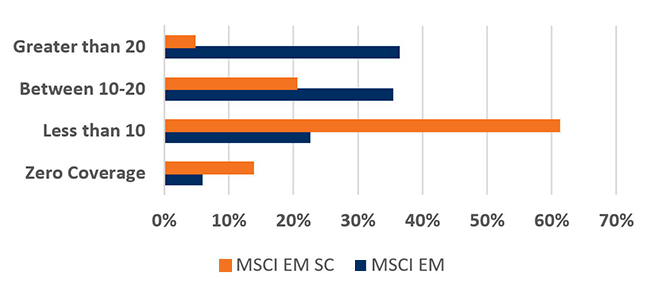
With big size comes lack of proper coverage. This universe’s vastness, combined with liquidity constraints, means this asset class doesn’t get extensive coverage, despite the value it has added historically. We see under coverage from both the buy side and sell side. This lends perfectly to our process at Global Alpha where we put in the hard yards to travel, meet management in person, and understand local business customs to stay on top of the story.

Analyst Coverage Comparison

Bar chart comparing MSCI EM & MSCI EM SC for analyst coverage, with EM SC being more than twice as much as EM when less than 10.
Source – Bloomberg. As on 30 Dec 2022

Less sino-centric

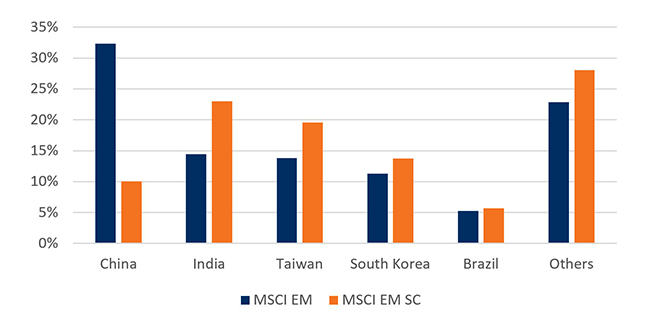
China dominates the large cap index – making up over 30% of the benchmark – while making up just around 10% of the small cap index,as seen in the graph below. The more balanced construction of the EM SC index helps investors avoid the policy and geopolitical risk that comes with concentrated exposure to a single market. At the same time, this differentiated exposure is a good complement in terms of total portfolio diversification.

EM Index Composition

Bar chart comparing MSCI EM & MSCI EM SC for EM Index Composition, with EM more than twice as much in China, and EM SC higher in India, Taiwan, South Korea, Brazil, and others.
Source – Bloomberg. As on 30 Dec 2022

Tailwinds

After decades of globalization, the pandemic exposed the fragility of the global supply chain system. De- globalization, near shoring and a greater reliance on domestic consumption as an engine of growth could come to define the next decade. EM small caps have greater exposure to consumer-facing sectors like healthcare, industrials, and discretionary and lesser exposure to global cyclicals like IT and energy compared to its all-cap peer.

MSCI EM

Source – Bloomberg. As on 30 Dec 2022

MSCI EM SC

Source – Bloomberg. As on 30 Dec 2022

SOE’s are minor actors

The EM SC benchmark has a lower allocation to State-Owned Enterprises (SOEs) than its large cap counterpart. Our experience informs us that SOEs are the same regardless of the country in which they are domiciled. They suffer from:

  • poor capital allocation,
  • lack of alignment of incentives,
  • slow pace of decision making, and
  • a track record of poor shareholder returns.

On the flip side, many of our small cap names need to be nimble and innovative to survive. Experience has shown that first generation entrepreneurs with skin in the game and properly aligned incentives tend to create shareholder value in the long run.

Being active

Emerging markets is a space where portfolios can look different from benchmarks. Research confirms that the average active share in this space has historically been close to 70%* and that there is a positive and significant relationship between active share and fund performance. Further, being consistently active is a strong predictor of fund performance. In other words, managers who back themselves on their ability to outperform by maintaining a high level of active share do well in the long run.

As we travel around the world, we are also seeing a generational shift in thinking among many of our family-owned companies. There is an openness among them to hire professional management. We also see a willingness to enhance corporate governance standards, and a better appreciation of what constitutes good capital allocation. While we don’t underestimate the challenge of finding the next HDFC Bank or TSMC, we feel the EM SC space offers the best playing field to generate value for our clients in the long run. And in our mind, that’s a big deal.

*Based on 67 emerging market funds that use MSCI Emerging Market Index as their benchmark. Active share is defined as percentage of holdings in a portfolio that differs from its benchmark.

TORONTO, ON, January 17, 2023 – Crestpoint Real Estate Investments Ltd. (“Crestpoint”) today announced the completion of two industrial investments with a combined market value of over $180 million. 

On December 15, 2022,Crestpoint acquired 7307 Meadow Avenue, a 100% leased, multi-tenant industrial portfolio comprised of six (6) buildings totaling over 190,000 square feet. Centrally located in Burnaby’s “Big Bend” industrial node, the primary and most amenity rich industrial sub-market in Metro Vancouver, the portfolio benefits from strong access to major highways, providing excellent connectivity to downtown Vancouver, the Fraser Valley, and the U.S. Pacific Northwest.  Crestpoint acquired a 50% interest in the property on behalf of the Crestpoint Core Plus Real Estate Strategy, its open-end Fund, with a local investor/developer acquiring the other 50%.  

On December 19 Crestpoint acquired 190 Summerlea Road, a 100% leased industrial property located in Brampton, Ontario. The ~305,000 square foot property is situated on a 24.8 acre site located in Bramalea Business Park in Brampton, Ontario, which includes 10 acres of excess land.  The asset benefits from close proximity to a number of major highways and streets and provides excellent connectivity to Pearson Airport, CN Rail’s Brampton Intermodal, and the rest of the GTA. Crestpoint acquired a 50% interest in the property on behalf of the Crestpoint Core Plus Real Estate Strategy, its open-end Fund, with the remaining 50% being acquired on behalf of another institutional client of Crestpoint’s.

The closing of these acquisitions brings Crestpoint’s total assets under management to over $9.5 billion and 35.4 million square feet. This caps off a very active and productive 12 months, which saw the completion of approximately $1.9 billion of acquisitions involving office, industrial, retail, and multi-family opportunities. It was also a very strong 2022 in terms of performance and we would like to thank all of our partners and investors for their tremendous support.

About Crestpoint

Crestpoint Real Estate Investments Ltd. is a commercial real estate investment manager dedicated to providing investors with direct access to a diversified portfolio of commercial real estate assets. Crestpoint is part of the Connor, Clark & Lunn Financial Group, a multi-boutique asset management company that provides investment management products and services to institutional and high net-worth clients. With offices across Canada and in Chicago, London, and Gurugram, India, Connor, Clark & Lunn Financial Group, and its affiliates are collectively responsible for the management of approximately $104 billion in assets. For more information, please visit: www.crestpoint.ca.

Contact

Elizabeth Steele
Director, Client Relations
Crestpoint Real Estate Investments Ltd.
(416) 304-8743
[email protected]

TORONTO (Ontario), le 17 janvier 2023 – Investissements immobiliers Crestpoint Ltée (« Crestpoint ») a annoncé aujourd’hui la conclusion de deux investissements industriels ayant une valeur marchande combinée de plus de 180 millions de dollars.

Le 15 décembre 2022, Crestpoint a fait l’acquisition du 7307 Meadow Avenue, un portefeuille industriel multilocataire entièrement loué, composé de six (6) immeubles totalisant plus de 190 000 pieds carrés. Situé au centre de la zone industrielle « Big Bend » de Burnaby, le principal sous-marché industriel de la région métropolitaine de Vancouver et celui qui offre le plus de commodités, le portefeuille bénéficie d’un excellent accès aux principales autoroutes qui mènent facilement au centre-ville de Vancouver, à la vallée du Fraser et au nord-ouest des États-Unis. Crestpoint a acquis une participation de 50 % dans la propriété au nom de la Stratégie immobilière de base plus Crestpoint, son fonds à capital variable. L’autre moitié est détenue par un investisseur/promoteur local.

Le 19 décembre, Crestpoint a fait l’acquisition du 190 Summerlea Road, une propriété industrielle entièrement louée située à Brampton, en Ontario. La propriété d’environ 305 000 pieds carrés est située sur un terrain de 24,8 acres dans le parc industriel Bramalea à Brampton, en Ontario, qui comprend un terrain excédentaire de 10 acres. L’actif profite de la proximité d’un certain nombre d’autoroutes et de rues importantes et offre un excellent accès à l’aéroport Pearson, au terminal intermodal de Brampton du CN et au reste de la région du Grand Toronto. Crestpoint a acquis une participation de 50 % dans la propriété au nom de la Stratégie immobilière de base plus Crestpoint, son fonds à capital variable. L’autre moitié est acquise pour le compte d’un autre client institutionnel de Crestpoint. La conclusion de ces acquisitions porte l’actif sous gestion total de Crestpoint à plus de 9,5 milliards de dollars et à 35,4 M pi2. Elle met aussi un terme à 12 mois très actifs et productifs, au cours desquels des acquisitions totalisant environ 1,9 milliard de dollars dans les segments des immeubles de bureaux, de l’industrie, du commerce de détail et des immeubles multifamiliaux ont été réalisées. L’année 2022 a également été très solide sur le plan du rendement, et nous tenons à remercier tous nos partenaires et investisseurs pour leur soutien exceptionnel.

À propos de Crestpoint

Investissements immobiliers Crestpoint Ltée est une société de gestion de placements immobiliers commerciaux qui cherche à fournir aux investisseurs un accès direct à un portefeuille diversifié d’actifs du secteur immobilier commercial. Crestpoint est membre du Groupe financier Connor, Clark & Lunn, une société de gestion de placements dotée d’une structure multientreprise qui offre des produits et des services de gestion de placements à des clients institutionnels et à valeur nette élevée. Possédant des bureaux partout au Canada, ainsi qu’à Chicago, à Londres et à Gurugram, en Inde, le Groupe financier Connor, Clark & Lunn et ses sociétés affiliées gèrent collectivement un actif d’environ 104 milliards de dollars. Pour obtenir de plus amples renseignements, veuillez consulter le site : www.crestpoint.ca.

Personne-ressource

Elizabeth Steel
Directrice, Relations avec les clients
Investissements immobiliers Crestpoint Ltée
416 304-8743
[email protected]

High inflation resulted in poor equity market performance in 2022 despite economic / earnings growth. Inflation relief in 2023 may limit further market weakness despite a global recession.

Absent shocks, economic momentum usually reflects real money trends six to 12 months earlier. Global six-month real narrow money momentum turned negative in March 2022, reaching a low in June before recovering slightly into November – see chart 1. This suggests that economic weakness will intensify in early 2023, with no monetary signal yet of a subsequent meaningful rebound. 

Chart 1

Chart 1 showing Global Manufacturing PMI New Orders & G7 + E7 Real Narrow Money (% 6m)

Real money contraction is fastest in the housing bubble / bust economies of New Zealand, Sweden and Canada, although the UK, Eurozone and US are only slightly behind – chart 2. China and Japan are positive outliers, suggesting less unfavourable prospects.

Chart 2

Chart 2 showing Real Narrow Money (% 6m)

Hopes are high that China’s covid policy U-turn will lead to a V-shaped economic recovery, as occurred in G7 economies post reopenings. Strong G7 rebounds, however, followed a surge in money growth. Chinese real narrow money expansion is still modest by historical standards and a rise in money rates in late 2002 may indicate less expansionary PBoC policy, possibly reflecting concern about inflationary effects of rapid reopening. 

Still-negative global real narrow money momentum indicates that a Chinese economic pick-up won’t offset recessions elsewhere. Forecasts of China-driven strength in commodity prices, therefore, are suspect. Additional weakness is more likely, based on an accelerating downswing in the global stockbuilding cycle, a key driver of commodity prices historically – chart 3. 

Chart 3

Chart 3 showing G7 Stockbuilding as % of GDP (yoy change) & Industrial Commodity Prices (% yoy)

The 2021-22 inflation surge was a consequence of central banks applying record monetary stimulus in 2020 as the stockbuilding cycle was tracing out an extreme low. Monetary fuel supercharged the usual cyclical rise in commodity prices. 

The monetary backdrop, like the status of the stockbuilding cycle, is now the opposite of 2020. G7 annual broad money growth crashed to 2.0% in November, below a pre-pandemic (i.e. 2015-19) average of 4.5% and down from a February 2021 peak of 17.3% – chart 4. The monetarist understanding of a roughly two-year lead implies an inflation crash from early 2023. 

Chart 4

Chart 4 showing G7 Consumer Prices & Broad Money (% yoy)

The latest trends, indeed, suggest rising medium-term deflation risk. G7 broad money contracted marginally in the three months to November. Bank loan growth to the private sector had been providing support but is now slowing as higher rates curb mortgage demand and corporate borrowing needs moderate with the stockbuilding downswing. 

The weak economic outlook is, according to the monetarist view, of limited relevance for assessing equity market prospects, which will hinge instead on “excess” money developments.

Two global excess money proxies are followed here: the gap between six-month real narrow money and industrial output momentum; and the deviation of 12-month real money momentum from a long-term moving average. The first indicator turned negative in December 2021 (allowing for data reporting lags), with the second following in February 2022. Historically (i.e. over 1970-2021), global equities underperformed cash by 8.9% pa on average when both were negative. The underperformance between end-February and end-December 2022 was larger, at 14.9% pa. 

As noted earlier, six-month real narrow money momentum has recovered slightly from a June low. Industrial output momentum, meanwhile, is estimated to have turned negative at end-2022, with further weakness likely. A cross-over, therefore, appears imminent and may even have occurred in December – chart 5. Allowing for the data reporting lag, a December cross-over would imply a shift in sign of the first indicator from positive to negative from end-February. 

Chart 5

Chart 5 showing G7 + E7 Industrial Output & Real Narrow Money (% 6m)

The second indicator – the deviation of 12-month real money momentum from a moving average – is heavily negative and unlikely to turn positive before mid-2023 at the earliest. 

The expected combination of positive and negative readings of the first and second indicators respectively was historically associated with equities underperforming cash by an average 4.5% pa, suggesting retaining a cautious investment stance.

The combination could result in significant sector / style rotation: tech, quality and growth outperformed on average with value and energy underperforming. Non-energy defensive sectors would be expected to continue to outperform non-tech cyclicals. EM equities outperformed developed markets on average.

The suggestion of a reversal of growth underperformance in 2022 is consistent with indications that Treasury yields will decline during 2023 – surging yields contributed to the derating of growth stocks last year.

Equity markets are bullish or bearish depending on whether excess money is positive or negative. Bond markets, by contrast, are sensitive to the rate of change of excess money, rather than its sign. Changes in US real Treasury yields have been inversely correlated with changes in the first excess money measure historically, i.e. yields have fallen when the measure has risen, even while still negative – chart 6. The current / expected improvement in the measure, therefore, suggests an extension of the recent yield decline.

Chart 6

Chart 6 showing US Real 10y Treasury Yield (6m change)

Treasury yields, in addition, usually move down into a low around the same time as the stockbuilding cycle trough – chart 7. Based on the average cycle length of 3 1/3 years, the next low could occur in Q3 or Q4.

Chart 7

Chart 7 showing G7 Stockbuilding as % of GDP (yoy change) & US 10y Treasury Yield

A fall in Treasury yields requires a Fed policy “pivot” but this could be imminent. Chart 8 shows the estimated probability of the Fed tightening policy in a particular month based on the latest data on core inflation, unemployment and supply bottlenecks. The probability estimate fell from 100% in October to 80% in December and currently stands at 75% for the FOMC meeting on 31 January / 1 February, consistent with market speculation of a step down from a 50 to 25 bp hike.

Chart 8

Chart 8 showing US Fed Funds Rate & Fed Policy Direction Probability Indicator

Based on the FOMC’s December median projections, the probability of tightening is forecast to fall below 50% in Q2 and below 10% in Q3. This outlook is consistent with the Fed shifting to an easing bias in Q2 and starting to cut rates in Q3.

Blocks showing transition from year 2022 to 2023

The market turbulence experienced over the last several years culminated with a major downturn for both public equities and fixed income in 2022. However, the journey along the way did provide useful insights and lessons, particularly from the experiences during the height of the pandemic in 2020. This article considers the extent to which investors heeded the warning signs, or whether they were desensitized to the ensuing risks.

The international risk consultant, David Hillson, defines risk as “uncertainties that matter”. In other words, when reviewing various investment uncertainties, the key is to understand how material the consequences could be if things do not go as expected. The assessment and acceptance of risk varies among investors. This is because different investors have varying levels of risk appetite and risk tolerance.

The practical implications for investors from Hillson’s definition is to prioritize risks when deciding how to respond to them. For example, if a particular risk has a minimal impact and low probability, then you may choose to accept the risk. However, for risks identified as material and with a higher probability of occurring, you will want to act. This may include controlling the risk exposure through better portfolio diversification, or avoiding the risk altogether, if possible.

Insights from the global pandemic

In the recent market environment, the global pandemic surfaced insights and warning signs, including:

  • Further concentration of equity markets, particularly towards technology companies;
  • Increased risk of rising interest rates and potential for negative fixed income returns;
  • Governments around the world working together to manage important global issues.

Equity market concentration

There was no surprise when equity markets declined in reaction to the spread of the pandemic in the first quarter of 2020 as investors responded to the implications for the economy and the fate of individual companies, particularly those in the travel and tourism industry as the world entered various stages of lockdown. However, the speed of recovery was a surprise to most.

Aided by extensive quantitative easing, equity markets bounced back robustly, with several delivering double-digit positive returns for calendar year 2020. Some of the strongest performing stocks globally in 2020 were technology companies that benefitted from the increased reliance on e-commerce during the pandemic. However, the strong performance also led to further concentration in the major equity indices. For example, Apple, Microsoft, Amazon, Facebook and Alphabet Inc. comprised over 20% of the S&P 500 Index at the end of 2020. The impressive performance also desensitized investors to concentration risk.

US equities are typically the largest equity component in most investors’ portfolios, so the increased concentration suggested a review of overall equity portfolio construction was appropriate. For those with a bias to global large capitalization developed equity markets, where the US dominates the overall market capitalization, potential considerations included the introduction of global small cap and emerging market equity allocations.

However, diversifying the overall equity allocation to reduce US stock specific risk did not address the information technology bias, since technology stocks globally benefitted hugely from the reliance on e-commerce during the pandemic. Therefore, an assessment of the overall equity style bias was also in order. For example, value style managers are less inclined to invest in technology stocks, thereby offering a source of sector diversification.

Reducing any bias to technology and growth stocks in general would have been a benefit in 2022, since technology stocks suffered the most for the calendar year. The ups and downs of specific stocks and sectors highlights the importance of having a formal risk assessment process to discuss and address uncertainties that arise, such as concentration risk.

Risk from rising interest rates

Fixed income yields have been in decline for decades, during which time governments and companies took the opportunity to significantly lengthen their bond maturities when issuing new debt. In doing so they contributed to an increased sensitivity to changes in interest rates (duration) for fixed income indices, such as the FTSE Canada Universe Bond Index, and the associated risk of low yields combined with high duration in a rising rate environment. For years “experts” predicted rising interest rates that did not unfold, leading to investors dropping their guard with respect to the ensuing risk.

Moreover, the fixed income market experience during the pandemic simply fueled investor desensitization. In times of equity market stress, a quality fixed income portfolio with high duration can provide an important source of diversification due to an increased demand for safe-haven assets and declining rates, which has seen fixed income markets deliver positive returns when equity markets experience significant declines. The defensive nature of fixed income came through in 2020 with the FTSE Canada Universe Bond Index returning 8.7% for the year, despite the low prevailing yield.

However, the risk associated with low yields and high duration in a rising rate environment reared its ugly head in full force in 2022 with the FTSE Canada Universe Bond Index declining over 11% and the FTSE Canada Long Term Overall Bond Index declining over 21% for the calendar year.

Actions taken by investors with an absolute return goal that heeded the low yield and high duration warning signs included:

  • Adopting fixed income strategies with a capital preservation focus and less sensitivity to interest rates;
  • Relaxing the constraints on fixed income managers with the goal of generating higher added value versus traditional fixed income strategies;
  • Increasing the yield through other fixed income assets, such as commercial mortgages;
  • Investing in higher yielding non-fixed income assets, including direct infrastructure and commercial real estate.

It is a different story for investors with liability-related goals, such as defined benefit (DB) pension plans, where in many cases, despite negative returns from the pension plan assets in 2022, the decline in the liabilities was greater, resulting in an improved funded position. However, for plans using leverage within their fixed income portfolio to increase the liability hedge, the market experience in 2022 may have worsened the funded position.

Due to the asset and liability dynamics of DB pension plans, upcoming risk assessments and related discussions will likely be focused on whether the experience in 2022 has created an opportunity to take advantage of an improved funded position. For example, where the goal is to manage the volatility associated with the funded position, increasing the allocation to fixed income assets could be one risk management consideration.

Governments working together

The global pandemic showed that governments around the world can work together to manage important global issues and created expectations for greater coordination on responsible investing in general, and specifically climate risk.

The current war in the Ukraine and associated impact to the energy supply and prices, saw resource-heavy markets, such as Canada, benefit from their higher energy allocation, which helped limit the extent of market declines in 2022 compared to markets with lower resource exposure. It also highlighted the challenges of adopting a position of no fossil fuel investments within a portfolio during a period when energy was the best performing equity sector.

However, it is crucial for governments and asset owners not to be desensitized to the importance and urgency of transitioning to renewable, cleaner energy, simply based on the recent investment return experience. While the world is still heavily reliant on traditional energy sources and there is still a long way to go to reducing our carbon footprint, a continued and orderly transition to cleaner energy is essential to manage the impact of climate risk.

Looking forward

Market turbulence of the last several years has contributed to desensitizing investors to ensuing risks. Risk management does not only have to rely on sophisticated modelling; it can take different forms including a simple discussion among trustees or committee members, drawing on the insights of investment managers and consultants, and fine tuning the asset strategy and portfolio diversification. In early 2023, take time to formally review your portfolio to identify any uncertainties which may elevate the risk of not delivering on your goals.

Silhouette of working oil pumps on sunset background.

Anyone who’s kept an eye on the markets is aware that the energy sector had a blowout performance in 2022. It started with the war between Russia and Ukraine in February that spiked oil and gas prices, the discussion then shifted to European LNG supply for the following winter, including which countries would be able to absorb Russia’s excess oil supply. Clearly, the energy resurgence in 2022 was a European-driven one.

With that in mind, what is the situation going into 2023? It appears that the worst-case scenario for this European winter has been avoided. Natural gas prices are now back at the pre-Ukraine invasion level, EU gas storage is sitting a comfortable 5% above its five-year trend, and winter weather has been lenient so far.

European Union gas storage levels, 2017 – November 2022

Chart comparing European Union storage levels from 2017 to 2022 vs the
5-year average.
Source: IEA, European Union gas storage levels, 2017-November 2022, IEA, Paris https://www.iea.org/data-and-statistics/charts/european-union-gas-storage-levels-2017-november-2022, IEA. Licence: CC BY 4.0

Governments are now focusing on planning for next winter, and the data points are more mixed. In 2022, Europe benefitted strongly from having Russian LNG flow for most of the summer and from lower LNG demand from China. Both things are unlikely to repeat in 2023. Indeed, a worst-case scenario, where Russian pipelines stop flowing completely for 2023, would represent a gap of nearly 50% of total gas storage requirements for the winter of 2023/24. And there are not many options for Europe to fill this gap elsewhere. Indeed, China’s 2023 LNG imports are expected to reach 2021 levels, which would capture over 85% of the estimated increase in 2023 LNG global supply, with much of that increase already contracted by China.

The market however does not appear to be discounting this. December 2023 futures contract for LNG is sitting around €70 per MWh, three times pre-2021 levels but well below the peak of €345 seen in August. There are certainly some indicators that support this optimism. Between August and November 2022, EU natural gas consumption dropped 20.1%, well above the government self-imposed target of 15% for the period between August 2022 and March 2023. Finland reduced its consumption by as much as 52%. Many countries capped the price for consumers and businesses. These lower prices should help alleviate the size of deficits generated from these programs, allowing those countries to face next winter with a healthier balance sheet. Furthermore, the weather for the rest of the winter will be a key driver of the requirements for next year, as estimates for gas storage levels at the end of the heating season vary between 5 and 35% of full capacity. Clearly it is too soon to predict a worst-case scenario, and Global Alpha does not expect a worst-case scenario to materialize. But the pain is likely to be felt more than markets currently discount.
At Global Alpha we have historically underweighted energy in our portfolios, not because of any macro views, but instead because the team consistently found better stock picking opportunities elsewhere. Indeed, pure oil and gas stocks are often at odds with Global Alpha’s investment philosophy: the quality of their balance sheet is volatile, they depend on macroeconomic factors to outperform, and as such tend to be more momentum based.

So how does Global Alpha get its energy exposure? An example of a name we have owned for many years is Schoeller Bleckmann Oilfield Equipment AG (SBO VIE). The company is the global market leader for high precision drilling components, providing nonmagnetic drill string components to directional drilling oil field service companies. Headquartered in Austria, more than 80% of its business is done in the U.S. and Europe, with high profile clients such as Schlumberger, Halliburton, and Baker Hughes.

With a healthy balance sheet and key market positioning backed by proprietary technologies, Schoeller-Bleckmann provides an attractive exposure to energy prices without being dependent on a few oil and gas projects. Indeed, its stock price has benefited from the pick-up in rig counts since mid-2021, with the firm boasting a book-to-bill ratio consistently above 1x, while at the same time showing its ability to pass on cost inflation to clients. There have also been discussions of green energy diversification, though the strategy remains unclear for now.

SWOT analysis

Strengths

  • +50% market share in most of its products
  • Strong balance sheet supported by low net debt

Weaknesses

  • Dependence on the big three oil services companies

Opportunities

  • Increased geographical diversification
  • Opportunistic M&A

Threats

  • Technological competition in their key plug market
  • Loss of market share in the U.S.

Schoeller-Bleckmann is a perfect example of the type of quality names Global Alpha is looking for in its portfolios: a niche, market leader with global exposure and a clean balance sheet that allows for sustained growth.

Hagia Sophia in winter (Istanbul, Turkey)

Summary

  • Slight down month for EM to round out the year.
  • The US dollar steadied against major currencies, following a sharp fall in November.
  • Turkey finished the year as the best performing market in EM (having been the worst in 2021), nearly doubling in USD terms.
  • Unsurprisingly, Russia was the worst, having been rolled out of the index in Q1.
  • China was the only major EM market to notch positive gains through the month as reopening moves ahead at a rapid clip.
  • Gulf markets struggled as a darkening global economic outlook hit energy stocks.
  • India had a down month following strong performance through the year. We think the long-term structural story in India is extremely compelling, but valuations look rich at this point.
  • Political risk in South Africa fell following president Cyril Ramaphosa’s re-election as African National Congress (ANC) party leader for a second five-year term, allowing the leader to run in the South African presidential election in 2024.
    • Re-election followed a tumultuous campaign, rocked by allegations that emerged in June that a large sum of foreign currency stashed inside a couch had been stolen from the president’s game farm in 2020.
    • A subsequent parliamentary investigation indicated that the president may be liable for misconduct, leading to an impeachment vote that was ultimately shot down by the ANC majority parliament in December.

Portfolio activity

  • Paring back exposure in Southeast Asia and India to add to China H-shares.
  • Maintaining bias to defensive sectors and quality.

Missed opportunity in Turkey?

  • There is currently no exposure to Turkey in the portfolio. Despite the sharp rally this year, we are wary of very poor liquidity and high macro risk. It is hard to see how the recent run is sustainable, to say the least.
  • Portfolio Manager Oliver Adcock visited Turkey earlier in 2022 to see whether there is a realistic chance of political change in presidential and parliamentary elections scheduled for most likely June 2023. Markets would undoubtedly cheer the election of an Erdogan alternative who would move quickly to establish a more orthodox fiscal and monetary regime.
  • Oliver met with pollsters, the head of one of the opposition parties, banks, corporates and a local thinktank.
  • Elections in 2023 look to be a close call, with the most likely outcome being that Erdogan and his AK Party lose control of parliament while retaining the presidency. We see this as a poor outcome.
  • One of the factors in Erdogan’s favour is that the coalition of opposition parties (the “Table of Six”) are struggling to decide on a presidential candidate, much less one that is likely to beat Erdogan to the presidency.
  • Erdogan does have room on the fiscal side and is likely to continue to pump the economy as much as he can into elections. This is despite headline inflation running at around 80%. Rates have recently been cut to 12%.
  • Cutting rates in the face of raging inflation courts serious currency risk, especially when forex reserves stand at around -$56 billion when accounting for currency swap lines (mainly with other Middle Eastern countries).
  • One large factor in the market rally has been driven by single stock futures, whereby the Turkish regulator has been allowing investors to reinvest gains made on trades even though they were not closed out. This has had the effect of supercharging the upswing.
  • Meetings with a number of banks confirm the economic situation is very volatile and fragile. The government is trying to control everything. New regulation attempts to force banks to lend at rates lower than 25%. The central bank rate is set at 12% but no one is lending there, banks are lending at 20% to SME and consumers, while deposits are 16%.
  • Overall, the economic backdrop is changing so rapidly that banks are reluctant to do anything, compelled to keep lending tight, and are holding weekly strategy meetings to assess key risks such as dwindling forex balance sheets.
  • The rally in Turkish stocks looks fragile and recent data indicates that foreign investors have been selling into it. Foreign ownership was already at historic lows and has continued to fall so it would seem that very few people have benefitted from this rally apart for the domestic traders who have been pumping the market (in many cases on margin) with the domestic liquidity created in the election run-up.
  • Risks are too high for us to build conviction in Turkey, however, it will be worth keeping an eye on polls in the coming months to see if sentiment changes once an opposition candidate for the presidency is chosen.

China regulatory headwinds abating

  • In March, Chinese Vice-Premier Liu He called for greater order and transparency in regulation of the tech sector. Our view was that this signalled a policy shift from Beijing, and that regulatory pressure was set to ease.
  • China made further supportive moves in December at the CCP’s annual Central Economic Work Conference (which shapes economic policy priorities), with policymakers declaring that it is essential to “support platform-based companies to leverage their abilities in leading development, creating jobs, and participating in international competition” (China Daily, December 2022).
  • This was soon followed by news that the China’s gaming regulator had granted 84 new game licences to domestic developers, and critically, 44 licences for imported games. These are the first approvals for imports for nearly two years. This shift from Beijing, which in August 2021 described gaming as “spiritual opium,” lifted the stocks of major gaming companies including Tencent and Netease.
Image shows timeline of Chinese regulatory events in the tech sector between 2017 to 2022.
Source: NS Partners Ltd., authorized and regulated by the Financial Conduct Authority.

China’s reopening accelerates

  • Following last month’s COVID 180 and rapid shift to reopening, Beijing pressed ahead through December despite news of a huge spike in cases (and presumably deaths) and hospital ICUs being overwhelmed.
  • China’s National Health Commission (NHC) announced a downgrade to the risk level for COVID (from class A to class B infectious disease), effective from 8 January. This effectively removes all centralised quarantine, contact tracing and risk area categorization throughout the country. Further, no control measures related to infectious diseases will apply at the border to all goods and people arriving from overseas. Travellers will only need a 48 hour pre-departure PCR test.
  • Outbound travel for Chinese citizens will also resume.
  • The NHC also reiterated that its focus will shift to boosting elderly vaccination levels, securing medical supply and healthcare resources (especially in rural areas), as well as prioritising treatment of severe cases.

Recent Bank of England signals have been deemed to be less hawkish than those of the Fed and ECB, contributing to a view that UK policy tightening is less likely to prove excessive, in the sense of causing greater economic damage than necessary to return inflation to target. 

Monetary trends do not support this hope. 

It should be remembered that the Bank embarked on rate hikes and QT before the Fed and has raised rates by 340bp versus the ECB’s 250 bp. 

“Shadow” rate estimates attempt to incorporate the impact of unconventional monetary policy measures. The Wu-Xia shadow rate for the UK has risen by 1250 bp from its 2021 low versus increases of 650 bp and 980 bp respectively in the US and Eurozone – see chart 1. 

Chart 1

Chart 1 showing Wu-Xia Shadow Rates

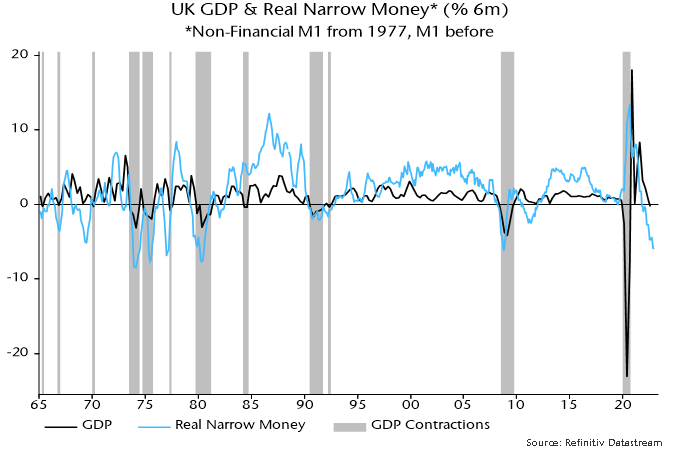
UK real narrow money (i.e. non-financial M1 deflated by consumer prices) contracted by more than comparable US / Eurozone measures in the six months to November – chart 2. The decline is historically extreme and suggests a severe recession – chart 3. 

Chart 2

Chart 2 showing Real Narrow Money (% 6m)

Chart 3

Chart 3 showing UK GDP & Real Narrow Money* (% 6m) *Non-Financial M1 from 1977, M1 before

UK nominal broad money (non-financial M4) grew by just 1.3% at an annualised rate in the six months to November – chart 4. The comparable Eurozone measure rose at a 5.0% pace. US broad money contracted but is correcting a much larger increase in 2020-21. 

Chart 4

Chart 4 showing Broad Money (% 6m annualised)

Real broad money holdings of UK households have retraced almost all of the pandemic-related surge, falling to the lowest level since May 2020 – chart 5. Far from “excess” money balances supporting spending, a real money squeeze is now likely to magnify consumption weakness. 

Chart 5

Chart 5 showing UK Household Sector Real M4 (£ bn, 2015 consumer prices)

Bank of England communications may be becoming less hawkish but the damage has been done. Officials ignored the monetary signal that a 2021-22 inflation spike would reverse with modest policy restraint. The economic consequences of overkill are likely to be at least as bad as in the US / Eurozone.