Gas price relief and Chinese reopening have tempered pessimism about Eurozone economic prospects, contributing to a Q4 rally in equities. Monetary trends, by contrast, suggest a worsening outlook due to the ECB’s scorched earth policy tightening. 

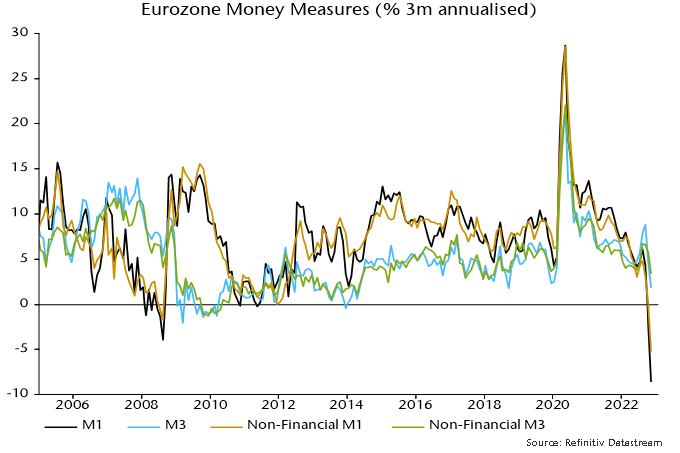
The preferred narrow money measure here – non-financial M1 – contracted for a third straight month in November. The three-month annualised rate of decline of 5.3% compares with a maximum fall of 1.7% during the GFC – see chart 1. 

Chart 1

Chart showing Eurozone Money Measures

Narrow money weakness is being driven by households and firms switching out of overnight deposits into time deposits and notice accounts – a normal pre-recessionary development. Broad money, in addition, is slowing – non-financial M3 rose by only 0.2% in November, pulling three-month annualised growth down to 3.4%, the slowest since 2018. 

The headline M1 and M3 measures are displaying greater weakness, reflecting a fall in money holdings of non-bank financial corporations.

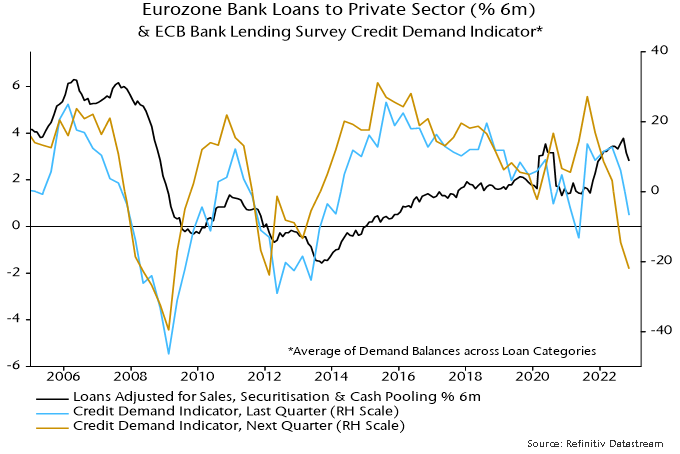
Broad money growth had been supported by solid expansion of bank loans to the private sector but, as expected and signalled by the ECB’s lending survey, momentum is now fading – chart 2. Slumping credit demand and forthcoming QT suggest that broad money will follow narrow into contraction. 

Chart 2

Chart showing Eurozone Bank Loans to Private Sector and ECB Bank Lending Survey Credit Demand Indicator

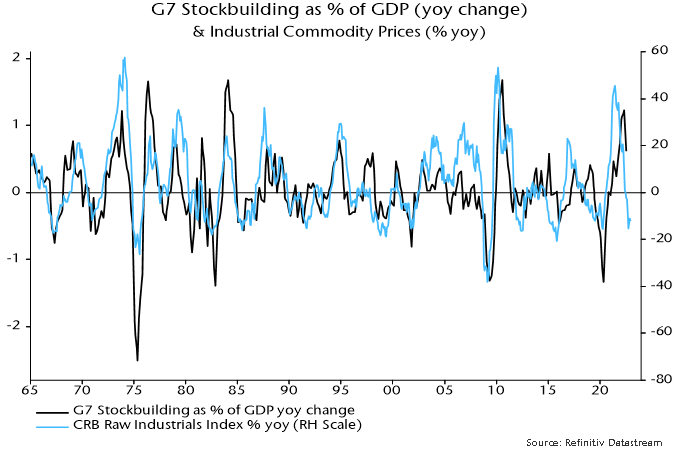
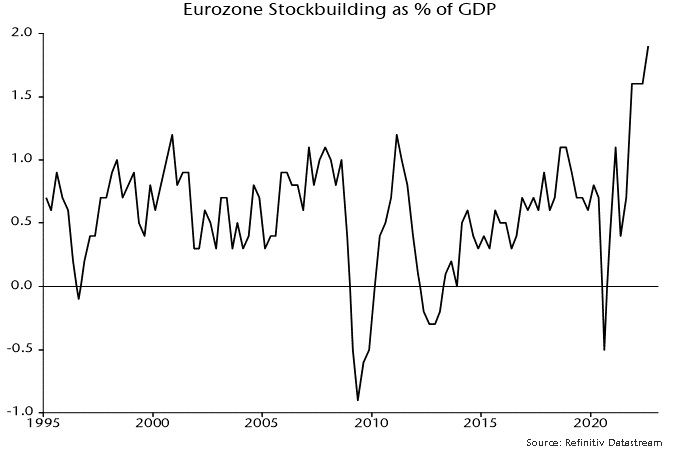
Corporate loan demand had been boosted by inventory financing but stockbuilding reached a record share of GDP in Q3 – chart 3 – and is probably now being cut back sharply, contributing to a move into recession. Consistent with this story, short-term loans to corporations contracted in both October and November. 

Chart 3

Chart showing Eurozone Stockbuilding as Percent of GDP

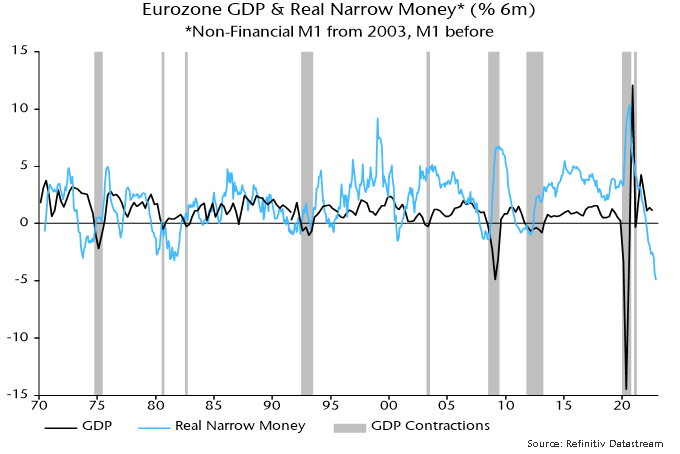
A sharp fall in inflation will support real money trends but has yet to arrive. The six-month rate of contraction of real non-financial M1 reached another new record in November – chart 4. 

Chart 4

Eurozone GDP and Real Narrow Money

Monetary tightening in 2007-08 and 2010-11 was associated with a divergence of money trends across countries, reflecting and contributing to financial fragmentation. This is occurring again, with weakness focused on Italy. 

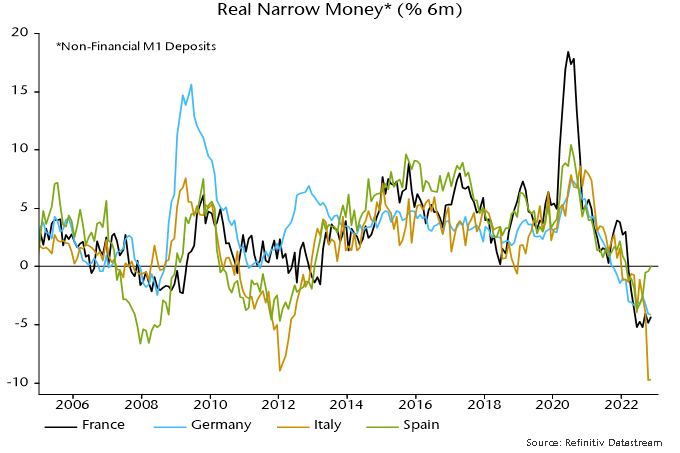
Italian real narrow money deposits contracted by 9.7%, or an annualised 18.4%, in the six months to November, with the larger decline than elsewhere due to both greater nominal weakness and higher CPI inflation – chart 5.

Chart 5

Chart showing Real Narrow Money

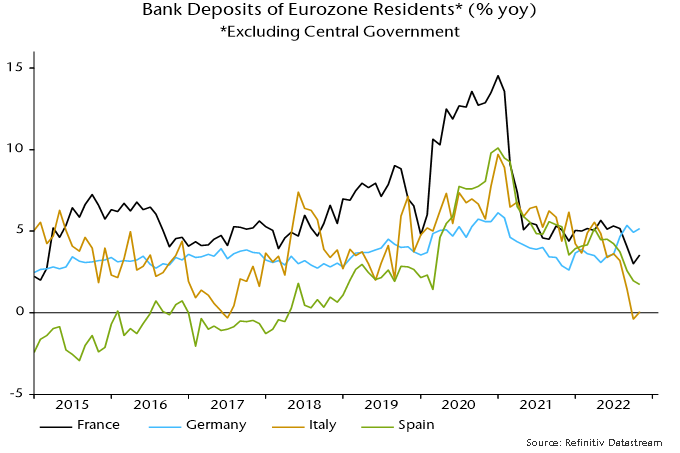
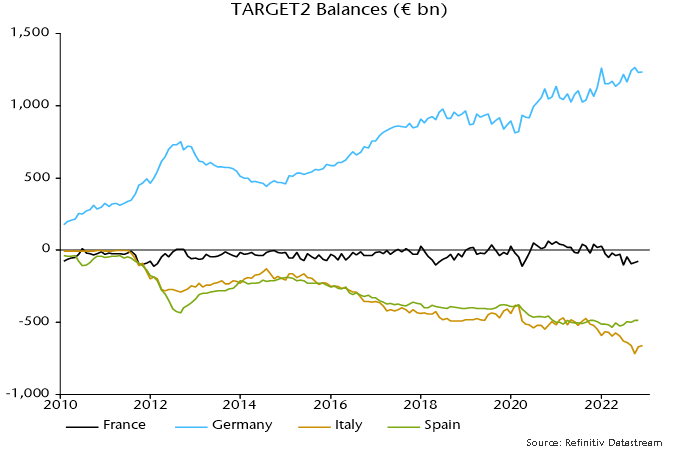
In nominal terms, total bank deposits in Italy were unchanged in the year to November – chart 6. Italian banks’ assets grew modestly over this period. The banks funded this expansion by increasing their net borrowing from Banca d’Italia, which in turn accessed additional funding from the Eurosystem, resulting in a further widening of its TARGET2 deficit. The deficit reached a record €715 billion in September following a surge in Italian BTP yields, falling back in October / November – chart 7. Another rise in yields since early December may have been associated with deposit outflows from the banking system and renewed upward pressure on the TARGET2 shortfall. 

Chart 6

Chart showing Bank Deposits of Eurozone Residents

Chart 7

Chart showing TARGET2 Balances

Image of human hand stacking generic coins over a black background with hexagonal golden shapes. Concept of investment management and portfolio diversification.

As discussed recently, inflation will be supported by low unemployment in 2023. This could be described as a classic inflation gap, as we expect a wave of salary adjustments persisting well into 2023.

Many important factors will keep unemployment at low levels. These include:

  • Demographics, especially in the U.S. where more and more Baby Boomers are accelerating their exit from the workforce, following a difficult COVID period.
  • Many developed countries halted immigration during COVID, causing backlogs compared to normal intakes.
  • Long COVID among many workers has been keeping them out of the workforce for lengthy durations.

As economic data comes out, high interest rates are beginning to affect the economy, as reported by the recent consumer price index (CPI) report. Weakening demand mixed with higher costs will weigh on corporate profits in 2023. The good news is Global and EAFE Small Cap valuations are at their lowest since the 2008-2011 period. These low valuations could provide stock price support as corporations reduce their profit guidance. As well, sentiment is at multi-year low and can only improve.

So, where to position in an economic downturn? Warren Buffet once famously asked, “What was the most popular chocolate bar in 1962?” Snickers, he answered. And what was the most popular chocolate bar in 2020? Snickers. Focus on what is resilient is the moral of this story.

The second anchor in a downturn is balance sheet strength as interest expense for many corporations start to rise. Recent Federal Reserve statements forecast a lengthy period of elevated interest rates. And the recent Carvana debt debacle will not be the only one. We certainly feel that many companies and analysts are too conservative in their medium-term (i.e., two year) interest rate outlook.

A third anchor relies on themes and long-term positive industry trends. Stocks with high exposure to critical, well-supported trends (renewables or onshoring, for example) will certainly help weather markets suffering from consumer demand decelerations.

Our portfolio companies hold substantial net cash war chests, and they have important M&A growth options during a slowdown. Let’s have a closer look at some holdings.

Several of our firms have net cash as a percentage of their market cap at a level greater than 10%. These include: Mabuchi Motor Co., Ltd. (37%), LINTEC Corp. (28%), SEGA SAMMY Holdings Inc. (17%), THK Co., Ltd. (12%), and Globus Medical, Inc. (11%). In addition, Ain Holdings Inc., Sakata Seed Corp. and Daiseki Co., Ltd. are all at 10%. This is only a short list of holdings at or above the 10% mark. Many of our companies have simply no debt.

What is even more reassuring is that a variety of tailwinds benefit our holdings. Let’s take SEGA SAMMY (6460 JT) for example. The Japanese gaming provider has transformed into an integrated entertainment powerhouse. Born from gaming, Sega’s Sonic the Hedgehog brand has been featured in movies, including a recently launched Netflix animated series. Additionally, the entertainment company’s newest 3D Sonic game, Sonic Frontiers, has sold more than 2.5 million copies worldwide since its launch in early November.  

Mabuchi Motor (6592 JT), the leading small motor provider out of Japan, is flush with cash and has no requirement of large expansion capex. Small motors are growing faster than many industrial markets due to increased demand for robotics. Moreover, the market in which Mabuchi operates is highly fragmented. The company can certainly use its cash for highly accretive acquisitions in the future.

At 11% net cash, Globus Medical is a quality anomaly in the medical technology world. The U.S.-based provider of orthopedic devices and robots is clearly a technology leader. Its surgical robots increase productivity four-fold in terms of successful back surgeries. As the company will ultimately see a peak penetration for its robots, it will be in a strong position to accelerate new innovations either by development or acquisitions.

Many of our companies demonstrate three key attributes:

  • product resilience,
  • positive tailwinds, and
  • balance sheet strength.

Product resilience can come in many forms and can be found in types of business models: Software as a Service (SaaS), maintenance services, and long-term fixed agreements, just to name a few. Global Alpha initiated in Reliance Worldwide Inc. (RWC AU). The Australian company is a leading provider of emergency plumbing equipment sold through global retailers such as Home Depot and Lowes. Reliance Worldwide’s sales performed well during the 2009 real estate collapse, and we feel its sales will hold up equally well in current market conditions.

Net cash is not the only way to uncover balance sheet strength. One of our holdings, Meliá Hotels International (MEL SM), recently went through an asset valuation analysis with CBRE. The Spanish hotel owner and operator is presently benefiting from strong volumes from its quality portfolio of hotels. The CBRE valuation of real estate assets came in at € 4 billion. This is against a debt level of € 1.3 billion and a market cap of € 1.1 billion.


US non-farm payrolls have risen by an average of 337,000 per month in the eight months since the Fed started hiking rates in March. The household survey measure of employment was essentially flat over this period.

The gap between the eight-month changes in the two series is at a record high, excluding April-May 2020 when data were distorted by the pandemic*. (This comparison, however, uses revised data for the two series.) 

The payrolls numbers have informed the FOMC’s judgement that “job gains have been robust”, in turn influencing the magnitude of the rise in rates this year. 

The payrolls survey covers about 670,000 worksites, while the household survey has a sample size of about 60,000. Sampling error, therefore, is larger for the household survey – the standard error of the monthly change in the household survey employment measure is more than four times that of the monthly payrolls change, according to the BLS. 

The payrolls survey, therefore, is conventionally regarded as the more reliable gauge of short-term employment movements. 

A focus on monthly sampling error, however, ignores sometimes large revisions to the payrolls data due to annual benchmarking against unemployment insurance tax records. There is no comparable annual revision to historical household survey data. 

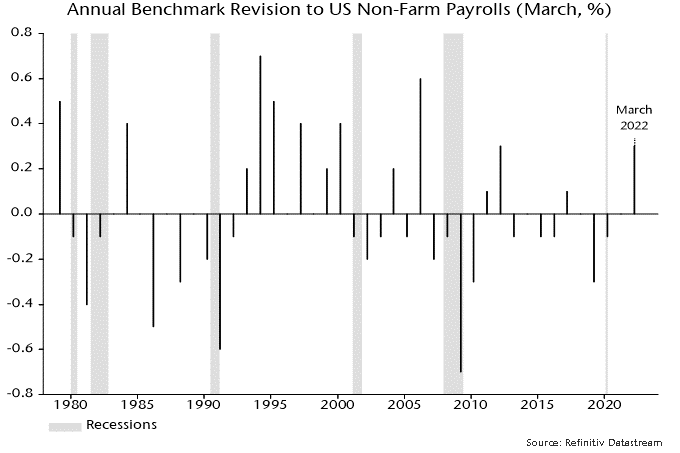
The annual payrolls revisions have averaged close to zero over the long run but there have been clusters of negative revisions around recessions – see chart 1. 

Chart 1

Chart 1 showing Annual Benchmark Revision to US Non-Farm Payrolls (March, %)

Benchmark revisions occur with a long lag. The BLS in August issued a preliminary estimate of a 462,000 upward revision to the March 2022 level of payrolls. This will be incorporated in monthly historical data up to March 2022 in February 2023. 

Benchmark revisions to recent monthly data, therefore, will occur in February 2024 under current BLS practice. 

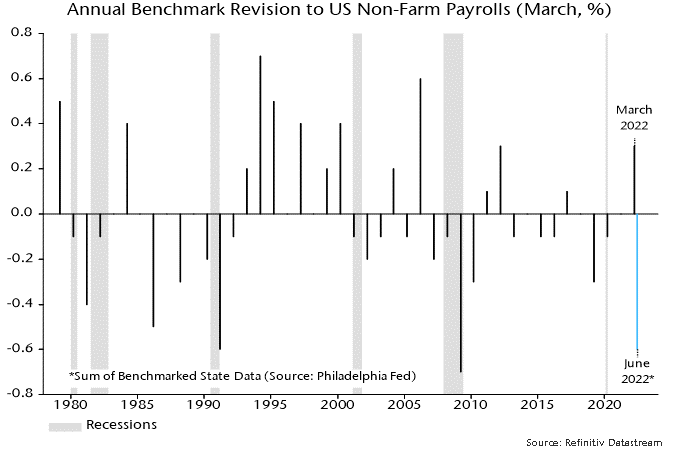
Research by the Philadelphia Fed suggests that these revisions will be negative and potentially very large. The researchers have attempted to replicate the annual BLS benchmarking procedure using quarterly UI records. They estimate that the currently-reported level of payrolls in June 2022 of 151.9 million will be revised down by 843,000, or 0.55% – chart 2. 

Chart 2

Chart 2 showing Annual Benchmark Revision to US Non-Farm Payrolls (March, %) *Sum of Benchmarked State Data (Source: Philadelphia Fed)

This would imply that payrolls grew by only 3,500 per month on average between March and June compared with the currently-reported 349,000. 

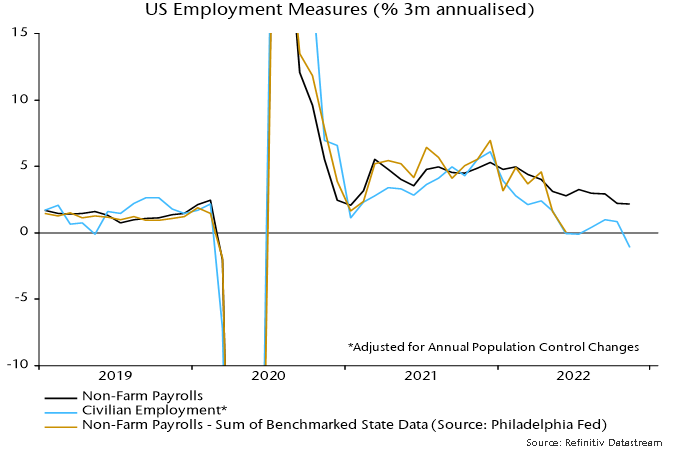
Chart 3 compares three-month growth rates of the official payrolls series, the household survey employment measure and the Philadelphia Fed benchmarked payrolls series. The May / June readings of the latter two are equal.

Chart 3

Chart 3 showing US Employment Measures (% 3m annualised) *Adjusted for Annual Population Control Changes

The official payrolls measure has risen by an average of 329,000 per month in the five months since June. Monthly gains in the household survey employment measure averaged 72,000 over this period. 

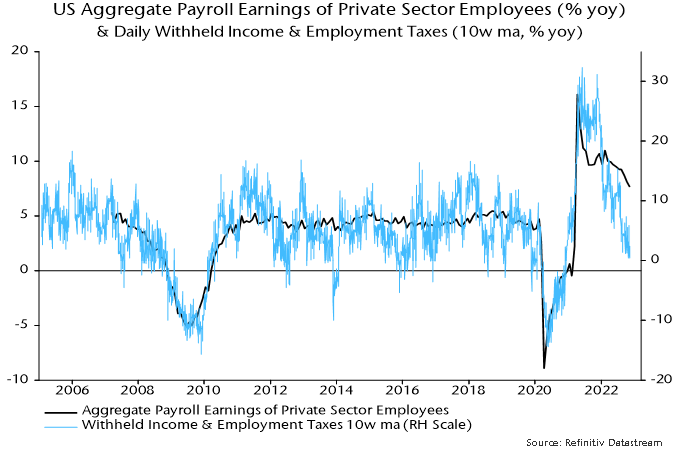
A benchmarked September payrolls estimate from the Philadelphia Fed will be released in March but timely data on withheld income and employment taxes – including UI taxes – suggest that the official payrolls series has continued to overstate gains. The daily tax data are noisy but year-on-year growth of a moving average has fallen sharply since June, widening an undershoot of the normal relationship with aggregate private sector earnings growth from the payrolls survey – chart 4. 

Chart 4

Chart 4 showing US Aggregate Payroll Earnings of Private Sector Employees (% yoy) & Daily Withheld Income & Employment Taxes (10w ma, % yoy)

*The payrolls series measures jobs while the household survey measures people. The wide gap partly reflects a rise in the number of people with multiple jobs. A BLS research series is available that attempts to convert household survey employment data to a payrolls concept, including by adding multiple jobs. This series rose by an average of 103,000 per month in the eight months to November. The difference with payrolls growth is also a record excluding 2020 data.

The BoJ’s decision to widen the fluctuation band of the 10-year JGB yield around the zero target follows an apparent withdrawal of monetary policy support by the PBoC in recent weeks. 

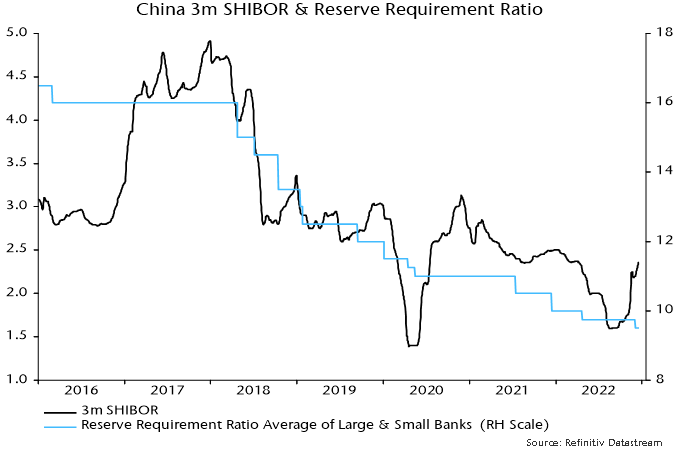
Three-month SHIBOR has risen by 75 bp since late September and is now only 15 bp below its start-of-year level – see chart 1. Upward pressure has been partly market-driven but the PBoC has chosen not to accommodate increased demand for liquidity. 

Chart 1

Chart 1 showing China 3m SHIBOR & Reserve Requirement Ratio

The PBoC’s Q3 monetary policy report, issued in November, expressed concern about medium-term inflation risks, stressing the importance of avoiding excessive monetary growth. An apparent hawkish shift may have been reinforced by the shock abandonment of the zero covid policy, which officials may view as likely to boost near-term price pressures via a faster demand recovery and / or an increase in supply bottlenecks. 

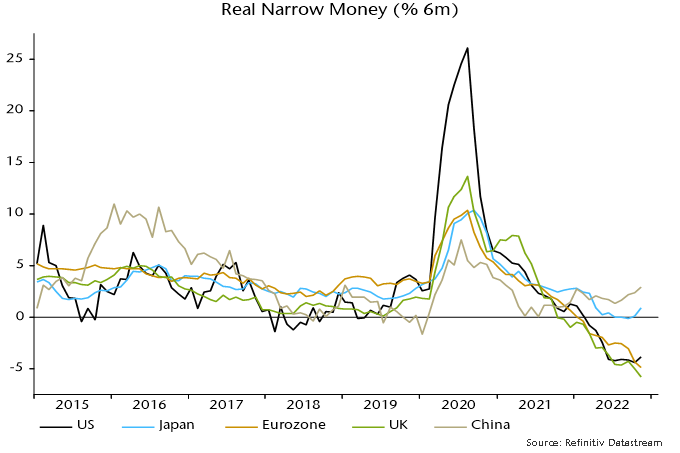
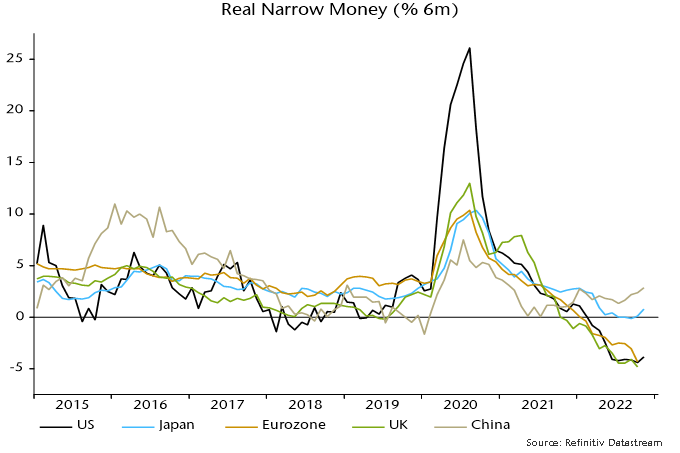
The Japanese / Chinese policy moves are worrying because monetary trends in the two economies have been providing a modest offset to significant US / European weakness – chart 2. That support could now fade. 

Chart 2

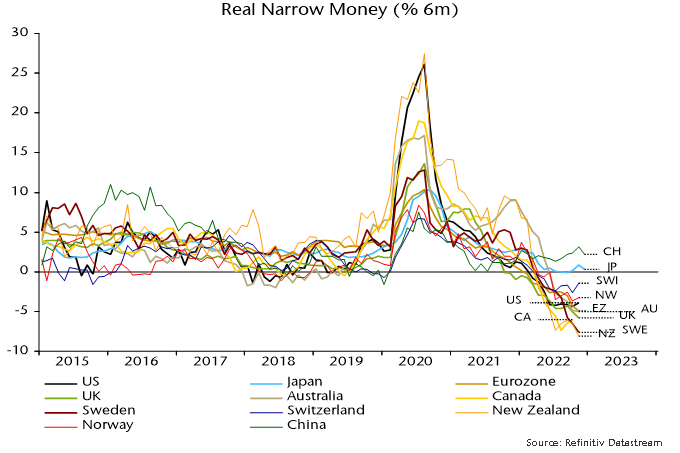
Chart 2 showing Real Narrow Money (% 6m)

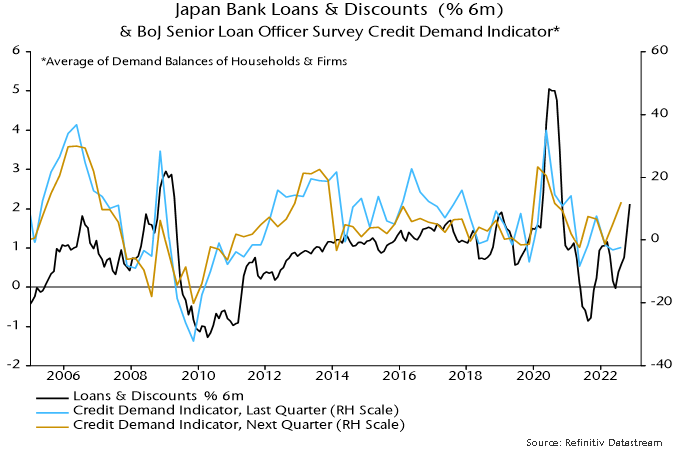
A rise in Japanese six-month narrow money growth in November was accompanied by a further pick-up in bank lending, consistent with stronger credit demand expectations in the BoJ’s Q3 loan officer survey – chart 3. The hope is that firmer bank loan growth / money creation will survive a modest policy adjustment. 

Chart 3

Chart 3 showing Japan Bank Loans & Discounts (% 6m) & BoJ Senior Loan Officer Survey Credit Demand Indicator* *Average of Demand of Households & Firms

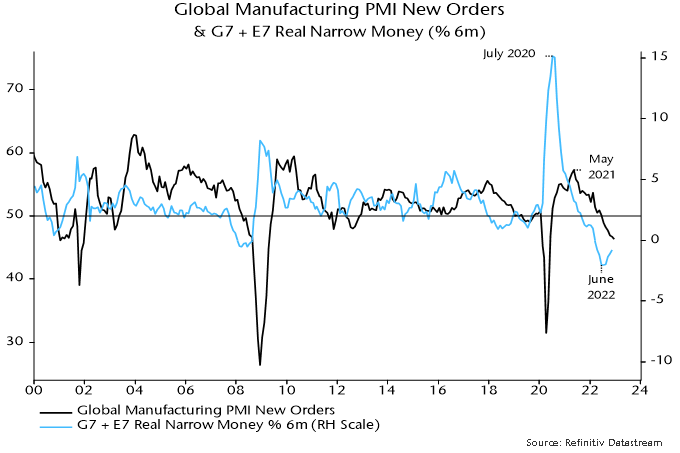
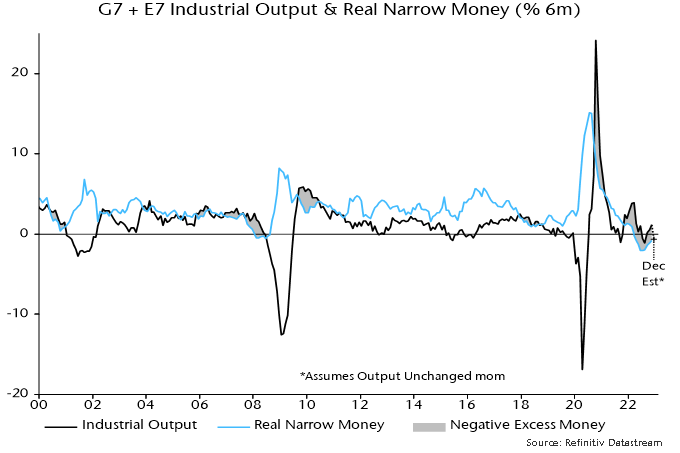
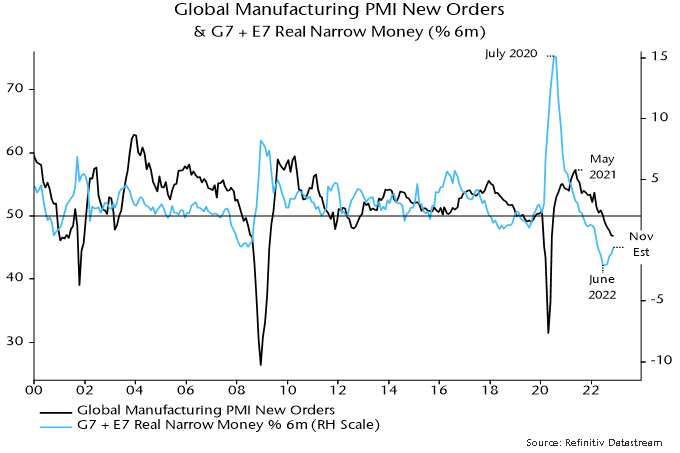
Global six-month real narrow money momentum is estimated to have risen for a fifth month in November but remains negative – chart 3. Allowing for the usual lag, the suggestion is that global manufacturing PMI new orders will bottom by next spring but remain in recessionary territory into Q3. 

Chart 4

Chart 4 showing Global Manufacturing PMI New Orders & G7 + E7 Real Narrow Money (% 6m)

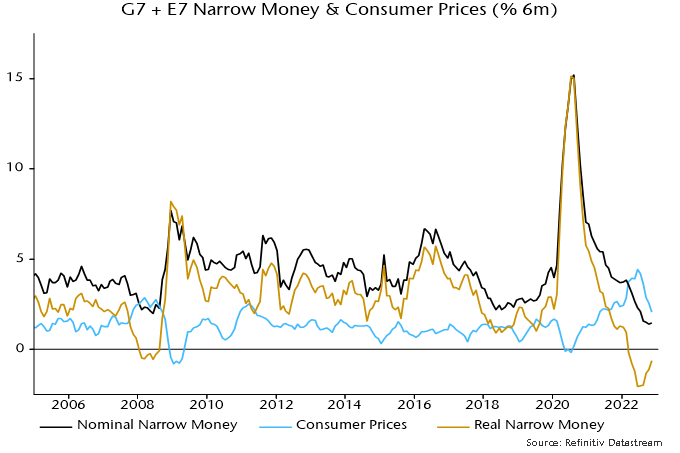
The recovery in real money momentum continues to be driven by a slowdown in six-month CPI inflation, with nominal money growth languishing – chart 5. The inflation decline will extend but overly hawkish central banks risk pushing nominal money momentum to new lows. 

Chart 5

Chart 5 showing G7 + E7 Narrow Money & Consumer Prices (% 6m)

We are excited to announce Banyan has recently partnered with Jason Grouette to target investment opportunities within the Personal Protective Equipment (manufacturing and distribution), Engineered Safety Systems, Safety Services and Repair, and Industrial B2B spaces.

Jason is a former 3M Executive who, since 2005, has led various business units in Canada and the USA, ranging from $100M to >$1.5B. Most recently Jason led 3M’s N95 pandemic response across Canada and the USA while leading the Personal Safety Division.

Jason has engaged with Banyan Capital Partners as an Operating Partner with the objective of finding, acquiring and leading a business in the industrial safety space.

Learn more about our investment criteria with Jason.

As we continue to add investments to our portfolio, you could be the next partner. Come join our Operating Partner Network and let’s go buy and build a business together.

Liberty Square in Taipei, Taiwan.

In mid-October 2022, after more than 2.5 years of strict border control measures, Taiwan lifted all its COVID entry restrictions and allowed foreigners free access. As countries returned to their pre-pandemic routine, Taiwan was among the laggards (along with China and Hong Kong) in loosening requirements for visitors to complete a mandatory lengthy quarantine. That is why we welcomed (to say the least) the announcement of easing travel restrictions. And after two weeks of preparation, we landed in Taoyuan International Airport at the beginning of November.

Except for the requirement to wear a mask in all public places including outdoors, lifted only on December 1, life in Taipei looked normal. There was strong traffic in malls, convenience stores, hotels and restaurants. Over the span of a week, we met with 28 corporates engaged in the information technology, consumer, healthcare and industrial sectors.

Our general impression was mixed, with more optimism around healthcare and consumer-oriented companies balanced by a more cautious outlook provided by the technology operators. Overall, most corporates noted quite low visibility going into 2023, with only a handful of companies ready to provide guidance for the next year.

Key takeaways from our meetings:

  • Strong domestic consumption recovery after the reopening in Taiwan.
  • Most of the semiconductor companies are in the midst of weak momentum due to slow demand for consumer electronics and inventory corrections. PC and handset unit sales are expected to decline in 2023.
  • Data servers, automotive and industrial remain the only bright spots for now. The U.S. hyperscaler server market is expected to continue growing at a double-digit rate in 2023, although global enterprise and China server demand are expected to remain weak. Demand for ASIC (application-specific integrated circuit) design remains strong, as does demand for the ABF (Ajinomoto build-up film) substrate despite a correction in the PC market.
  • The impacts so far of U.S. sanctions on the Chinese semiconductor space are limited on Taiwan semiconductor companies because the new rules target only the most advanced technology, and most Chinese IC (integrated circuit) designers are making changes to fall within key thresholds of those sanctions. Moreover, some companies aim to reap benefits on lower competition with Chinese peers in the long term. However, there is a risk of further escalation in U.S.-China relationships, which could disrupt global technology supply chains and impact demand in 2023.
  • Many technology companies pointed out an increased need to de-risk their production facility locations following their customers’ requests for production capacities outside of both China and Taiwan.
  • General supply chain normalization, with remaining tightness in the supply of some key components.

Taiwan is the second largest market for our Emerging Markets strategy (behind India), with about 20% weight in the MSCI EM Small Cap index. It is the only country in the EM universe with a clear sector bias, as information technology accounts for more than half of the country weight in the benchmark. In the first 10 months of the year, Taiwan Small Cap underperformed the EM benchmark by more than 10%, a result mostly driven by derating of the technology sector. However, its performance in November looks like the beginning of a year-end rally on the expectations of semiconductor inventory correction bottoming. Likewise, moderating geopolitical risk may ease following the results of local mayoral elections on November 26, in which the Kuomintang, a party taking a more moderate stance on China, scored a big win over the incumbent Democratic Progressive Party.

Although we remain cautious on the technology inventory correction cycle, as there are multiple risks that might delay the sector recovery (e.g., deep recession in the U.S. and Europe, and broader geopolitical escalation), we acknowledge that some of the corporates in Taiwan are progressing well ahead of their peers. Most of market participants expect that a cyclical bottom in semiconductor demand might occur in the first half of 2023, with sequential improvement starting in the second half of 2023. This could drive a strong recovery in technology stocks. The importance of understanding inventory cycles was discussed in our note published on March 13, 2009. We see similar patterns here and remain alert to understanding where we are in the cycle.

Our EM portfolio is currently in a market-neutral position in Taiwan. We have a balanced roster of technology leaders, dominant operators catering to domestic markets, and exporters benefiting from secular tailwinds.

Here is a description of a sample of our holdings in Taiwan.

Chroma ATE Inc. (2360 TT) is a power and semiconductor testing equipment provider enjoying a leading position among the top-five global IC testers. For instance, NVIDIA uses Chroma testing equipment for all its products. Chroma also enjoys strong growth momentum in the electric vehicle (“EV”) industry. The company is one of the few operators in the technology sector that is less susceptible to industry cyclicality, and it has better visibility into the longer-term growth trajectory of the semiconductor industry.

Universal Vision Biotechnology Co., Ltd. (3218 TT) is the largest ophthalmology chain in Taiwan. The firm offers various eye treatments and related medical services such as laser vision correction and cataract surgeries. It is the leading brand in Taiwan, backed by a 30-year track record of high-quality services and innovation, with a dominant position in advanced eye surgeries such as SMILE (Small Incision Lenticule Extraction) and FLAC (Femtosecond Laser Assisted Cataract Surgery). The company also sells optometry products such as eyeglasses, contact lenses, and orthokeratology lenses at its self-operated eyewear stores. Benefiting from structural demographic tailwinds in Taiwan – due to high prevalence of myopia in the population – UVB is also a beneficiary of China’s COVID reopening, where it derives 25% of revenue. Following the recent easing of COVID restrictions, the company is looking to accelerate clinic openings in China.

Makalot Industrial Co., Ltd. (1477 TT) is one of the major global apparel manufacturing companies with industry- leading design flexibility, lead times, product offering and scale. We believe it is one of the main beneficiaries of the supply chain consolidation trend due to its diversified production sites, aggressive expansion in Indonesia and Bangladesh, and ability to deliver rush orders.

UK payrolled employment rose solidly again in November, while pay growth numbers for October surprised to the upside. It has been suggested that this news reinforces the case for a Bank rate hike of at least 50 bp this week. 

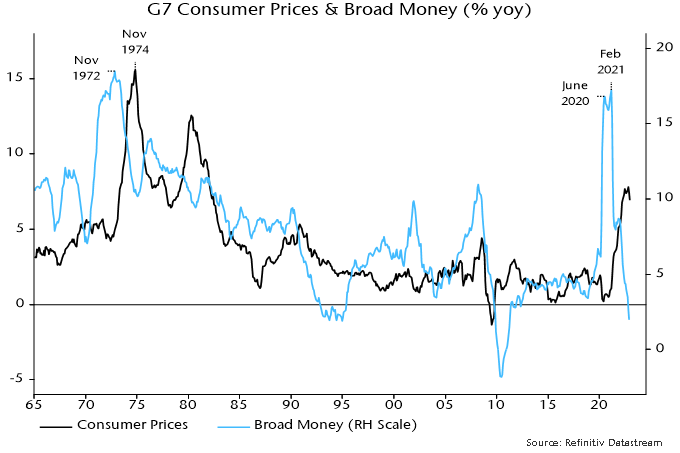
Employment is a lagging economic indicator. There is ample coincident evidence that a recession is under way. Annual broad money growth – as measured by non-financial M4 – is down to 3.4%, a level suggesting a medium-term inflation undershoot. The view here is that any rate rise this week will be a mistake. 

The monthly payrolled employment measure has a short history but it correlates closely with the quarterly (and less timely) Workforce employee jobs series. In the 2008-09 recession, the latter measure peaked two quarters after GDP.

Labour market indicators that lead employment / unemployment include the stock of vacancies and average hours worked. These indicators are usually roughly coincident with GDP.

The headline vacancies series is a three-month moving average but non-seasonally-adjusted single-month numbers are available and can be adjusted using a standard procedure. The resulting series peaked in April, one month before GDP, and fell again in November – see chart 1. The recent pace of decline is comparable with the 2008-09 recession.

Chart 1

Chart 1 showing UK Monthly GDP Index & Vacancies* *Single Month, Own Seasonal Adjustment

The weak November vacancies number suggests that GDP contracted significantly last month after October’s catch-up from reduced September activity due to the Queen’s funeral.

Average weekly hours tell a similar story. The series, which is available only as a three-month moving average, peaked in March and fell again in October, reaching its lowest level – excluding the pandemic recession – since 2012.

Should the MPC react to strong pay numbers? The monetarist view is that pay pressures are an effect rather than a cause of high inflation and will moderate as the dramatic slowdown in money growth since 2021 feeds through to slower price rises.

The latest upside surprise, in any case, reflects a belated catch-up in public sector pay; six-month growth of private sector regular pay is high but moving sideways – chart 2. A public sector pay pick-up may be bad news for real government spending and / or the public finances but will have little effect on the pricing behaviour of private sector suppliers of goods and services – especially against a backdrop of deepening recession and a loosening labour market.

Chart 2

Chart 2 showing UK Average Weekly Regular Earnings (% 6m annualised)
Young Asian woman wearing a protective face mask in the city.

Summary

  • Emerging markets bounced back throughout the month, fuelled by signals that inflation is peaking, China announcing measures to support the property market along with taking steps to reopen.
  • More cyclical markets such as Brazil and the Gulf states underperformed, as recession risks for major economies loom.
  • The DXY dollar index retreated, providing an additional tailwind for EM. 

Portfolio Activity

  • Added to China H-shares, particularly names set to benefit from a recovery in consumer demand as COVID-zero is phased out.

China’s Policy Pivot

While CCP Congress drew focus to longer term structural risks brought about by Xi’s consolidation of power and confirmation of a third term, the event was followed by a series of policy announcements that addressed more immediate economic and political risks, that served as a positive catalyst for Chinese equities.

Property

  • Beijing announced one of the first major support measures for the property market in an attempt to put a floor under structural risks in the sector.
  • The measures inject around US $183 billion of credit into the property sector (Jeffries estimate) and should help to alleviate the wider economic drag brought about by the crunch.
  • Likely a turning point with additional policy support to follow to ensure the recovery in home sales and credit growth has legs.

Has Beijing ditched ‘wolf warrior’ diplomacy?

  • Beijing’s diplomatic charm offensive began with German Chancellor Olaf Scholtz leading a high level business delegation to meet with Xi and Li Keqiang. The Chancellor stressed the need for Germany and its European partners to pursue “areas of mutual interest” with China, but without ignoring controversies.
  • This was followed by Xi hosting a number of conciliatory meetings with Western leaders on the side lines of the G20 summit in Bali (with the exception of Xi’s confrontation with Justin Trudeau). One particularly noteworthy meeting was between Xi and Australian Prime Minister Anthony Albanese, the first exchange between leaders of the two countries since 2016.

COVID

  • Following a tragic apartment block fire (which was under COVID lockdown), in Urumqi (the capital of Xinjiang), protests against draconian COVID policy broke out across China. The size, messaging and geographic spread of the protests was significant, with protestors hitting out against Beijing and the local governments tasked with implementing the policy.
  • While the unrest was inevitably met with a swift police response, it acted as a catalyst for the acceleration of Beijing’s reopening agenda. Protests were followed by a surprising acknowledgement by Xi of the frustration being felt by many Chinese people, the cancellation of routine mass-testing in multiple cities, a reduction in mandatory quarantine periods for foreign arrivals (“7+3” days in a quarantine facility/at home to “5+3”), and state media pushing a new narrative that the Omicron death rate/severity is very low.
  • The fear is that opening up will inevitably led to a huge spike in COVID cases, which threatens to overwhelm China’s healthcare system, and risk the lives of the elderly population that is under-vaccinated.
  • To address this, Beijing has set hard vaccination KPIs for local governments: by end of January 2023, the vaccination ratio of people aged over 80 should reach 90%, and 90% of the people aged over 80 who meet certain health criteria must be fully vaccinated and have received booster shots. Additionally, 95% of the people aged between 60-79 who meet health criteria must be fully vaccinated and have received booster shoots. Current numbers are a long way off these targets, so we expect to see the rollout of a massive vaccination campaign.

Michael Zhang’s China trip

  • Analyst Michael Zhang travelled to China to see family during the month of November and relayed his impressions of consumer sentiment and attitude to COVID:

“Depending on where you’re at, activity levels might vary a lot. Recently in Chengdu, most restaurants were open, food deliveries normal, but restaurants and shopping malls were a lot less busy. The situation literally changes by the hour, you live your life by constantly checking the local community Wechat group for any announcements and might be ready to sleep at your friend’s place if yours is suddenly locked down for a few days. At one point, 30% of Chengdu’s residential complexes was locked down (despite no city-wide restrictions), but many of them suddenly reopened after the change of tone at central government level. Local governments are also nervously watching the message from the top.

It may take longer for Chinese people to shift their mindset, even if governments suddenly announce “we’ve defeated the virus”, a lot of people will still be cautious and unwilling to come out and spend, plus COVID cases and deaths will be rising. With this in mind, the recovery in consumption may be more gradual than many expect.”

Korea and the Inflation Reduction Act (IRA)

Portfolio manager Mazika Li travelled to South Korea on a research trip, and found that the IRA is at front of mind for many Korean companies looking to pursue major investment opportunities.

Asymmetric opportunities

“Free money” – the U.S. government is doling out subsidies in the form of tax incentives and production tax credits to attract investment in its renewable energy and battery supply chain (to the exclusion of Chinese sourcing). The initiative budgets for US$30 billion per year for the next 10 years.

Three key components:

  1. Advanced manufacturing production credits – applies to solar, batteries, offshore and onshore wind technology.
  2. EV tax credits for car buyers for up to $7,500 per car. To claim the full credit:
    a) at least 50% of the battery components must be manufactured/assembled in North America (and will go up to 90% by 2029), and
    b) if at least 40% of the battery materials were extracted or processed from countries which have a free trade agreement with the U.S., or recycled in North America (stepping up to 80% by 2027).
  3. Investment tax credits for renewable, energy storage and critical minerals projects.

Who wins?

  • While building a U.S. plant is an expensive exercise, the strength of these incentives is such that Korean companies will be able to generate a healthy return on investment in a relatively short period of time.
  • Non-China suppliers of critical raw materials in the EV/renewable/battery supply chains should see increased demand.
  • Manufacturing equipment makers benefit from the capex spree.
  • The U.S. strengthens economic ties with allies in the West and East, and gains manufacturing know-how in key areas.
A newspaper with the headline Changes coming in 2023

So far calendar year 2022 has been a challenging period for investors. Both equities and fixed investments have delivered negative returns and there are no obvious signs of any immediate improvement in the outlook as we navigate rising interest rates and high inflation. Not the ideal scenario for the introduction of changes in the charitable spending requirements for registered charities announced in the 2022 federal budget and expected to come into effect in 2023. This article provides a recap of key considerations for charities and the implications for the long-term growth of investment portfolios to ensure continued support of charities’ missions and objectives.

New Spending Requirements

The 2022 federal budget proposed an increase in the minimum distribution requirement for registered charities with fiscal years beginning on or after January 1, 2023. The proposed changes were met with concerned feedback on the timing from the charitable community and as such the new requirements have yet to be passed. It is anticipated that the changes will be in the next Budget Implementation Act, which could be passed before the end of the year. The key points of the changes are:

  • The minimum distribution quota (DQ) will increase from 3.5% annually to 5.0% for property above $1.0 million that is not used directly for charitable activities or administration
  • The calculation is based on the average value of property exceeding $1 million during the prior 24 months
  • Administration and management fees do not qualify for satisfying a charity’s DQ, which was a previous source of confusion
  • The Canada Revenue Agency (CRA) can grant a reduction in a charity’s DQ in any given tax year
  • The accumulation of property rule which exempts charities from including certain property in their DQ calculation will be removed
  • If certain requirements are met, registered charities can make “qualifying disbursements” to non-qualified donees.

What are the Implications?

While charities and foundations have different missions and objectives, most have a common goal to operate in perpetuity by generating returns sufficient to grow their assets after accounting for spending distributions and other costs. The potential implications to such a goal will depend on the actual spending practices of charities. Some charities as a practice may already be distributing close to the 5% minimum, while for others this will signal an increase in their spending policy.

As discussed in a previous article, establishing a regular spending formula and adhering to it is appreciated by grant recipients who receive a consistent cash flow. However, the strategic asset mix of a charity’s investment portfolio and associated risk and return profile typically supports the spending target. Specifically, to support a spending target of 3.5% implies a different asset mix and associated risk and return profile compared to a higher 5% target.

For those charities where the new requirements will imply a higher distribution, there are two options in their toolkit to meet the higher target:

  • Generate higher returns from invested assets; and
  • Receive additional donor contributions

While a combination of the two options will be beneficial, generating higher returns from its investments can be more in a charity’s control.

Strategic Asset Mix

Notwithstanding calendar year 2022 is on track for negative returns, with both equities and fixed income declining year-to-date to the end of October, one positive outcome of the rapid rise in fixed income yields is the higher longer-term outlook for fixed income. This is because there is a strong relationship between the actual return investors earn and the current yield. For example, for the Canada Universe Bond Index, Figure 1 illustrates how the current yield provides an indication of the expected return for the next 10 years, as well as the direction of returns. The chart plots the universe bond yield over time (blue line), as well as the actual subsequent 10-year returns represented by the purple line.

Figure 1 – Universe Bond Yields versus Subsequent 10-Year Returns

With the rapid rise in yields, the longer-term outlook has vastly improved. The yield on the Universe Bond Index at the end of October had risen to 4.3%, suggesting the expected return over the next 10 years would be similar, although with the potential for further interest rate hikes, there could still be shorter-term periods of negative returns. Despite the shorter-term challenges, it suggests a portfolio of fixed income alongside an allocation to equities could be well positioned to achieve a 5% return.

However, for many charities the return goal also considers inflation to maintain the real value of the portfolio of assets. While inflation is currently elevated, for the purpose of illustrating the impact of inflation combined with higher distributions, and assuming an annualized inflation of 2.5% for the next 10 years, then the minimum real return goal would be 7.5%. It is less likely that a portfolio of fixed income and equities can achieve the higher 7.5% return, unless it is largely invested in equities, implying a risk and return profile that many charities would not be comfortable adopting.

One action item for committees would be to include an agenda item at a future meeting that considers potential alternative investments, such as private market investments including real estate, infrastructure, and private debt, and the extent to which these could improve the risk and return profile of the investment portfolio. It would also be appropriate to consider other higher yielding assets, including commercial mortgages, emerging market debt, as well as the potential role of hedge funds to contribute to the return and diversification role. However, a careful assessment of specific alternative investments would be needed to understand any implications from the higher interest rate environment on the longer-term outlook for these types of investments.

Understand Your Circumstances

During these turbulent times, it is important to maintain a long-term perspective for the charity’s investments. With the new spending requirements, it will be beneficial to review your own circumstances and goals to understand the ability to gather additional support for the charity through contributions compared to the requirement for higher investment returns. Make time at a future committee meeting in 2023 to review your long-term outlook and requirements.

The global manufacturing PMI new orders index was little changed in November, the six-month rate of change of the OECD’s G7 leading indicator has hooked up and cyclical sectors have been outperforming defensive sectors in the recent equity market rally. Do these developments signal a bottoming of global economic momentum and a prospective H1 2023 recovery? 

Monetary trends argue not. Global (i.e. G7 plus E7) six-month narrow money momentum rose slightly for a fourth month in October but remains in negative (i.e. recessionary) territory. All previous recoveries through the 50 level in global manufacturing PMI new orders were preceded by real money momentum rising above 2% – see chart 1. 

Chart 1

Chart 1 showing Global Manufacturing PMI New Orders & G7 + E7 Real Narrow Money (% 6m)

The June low in real narrow money momentum will probably hold but a corresponding PMI new orders low is unlikely before Q1 2023. There was a 10-month lag between the most recent real money growth peak (July 2020) and the matching PMI top (May 2021). 

There are additional negative considerations. The rise in real money momentum since June has been due to an inflation slowdown, with nominal money growth weakening further – chart 2. Previous PMI recoveries were preceded by nominal as well as real money accelerations. 

Chart 2

Chart 2 showing G7 + E7 Narrow Money & Consumer Prices (% 6m)

The rise in global real money momentum reflects the E7 component, with G7 momentum still weakening – chart 3. China, India, Mexico and Brazil have contributed to the E7 recovery but the increase has been exaggerated by a nominal money surge and inflation drop in Russia – chart 4. The latter may be of limited global relevance given Russia’s partial economic isolation. 

Chart 3

Chart 3 showing G7 + E7 Real Narrow Money (% 6m)

Chart 4

Chart 4 showing Real Narrow Money (% 6m)

The six-month rate of change of the OECD’s G7 leading indicator rose slightly for a third month in November, according to calculations here. This appears to be a hopeful signal – bottomings historically have usually been followed by sustained recoveries, as chart 5 shows. The uptick is also consistent with recent better relative performance of cyclical equity market sectors. 

Chart 5

Chart 5 showing G7 OECD Leading Indicator (% 6m) & MSCI World Cyclical Sectors Price Index Relative to Defensive Sectors (% 6m)

Initial indicator readings, however, are often revised significantly and previous sustained recoveries in the six-month rate of change from negative territory were accompanied or more usually preceded by a revival in G7 real narrow money momentum – chart 6. With the latter yet to bottom, the uptick in indicator momentum may be either revised away or reversed. 

Chart 6

Chart 6 showing G7 OECD Leading Indicator & Real Narrow Money (% 6m)