Several banknotes of Mexican & Indonesian currencies.

We are nearing our second year of our Emerging Markets Small Cap Fund and continuously monitoring various sectors across 24 countries. Almost 60% of the MSCI Emerging Markets Small Cap Index is represented by four countries: Taiwan, India, South Korea and China. In our view, these countries have advanced nicely in the emerging markets (EM) small-cap arena. Many of today’s technological developments are driven by companies that have been in the Index, including TSMC from Taiwan (circa 1994-95), Korea-based battery maker, LG Chem (circa 2001), India’s Apollo Hospitals (circa 2021) and consumer names from China.

These countries and companies have also been well represented in the MSCI Emerging Markets Small Cap Index having satisfied regulatory requirements, with some exceeding expectations by innovating such that they get “upgraded” in valuation or become classified as EM large caps. There are also ongoing discussions to elevate Korea from an EM to a developed market (DM).

We nevertheless feel that MSCI classifications can be inefficient. MSCI attempts to select promising EMs in advance using mostly backward-looking data, which can lead to mistakes. Argentina is an example. It was reclassified as an EM in 2018 and then cut in 2021. Vietnam should eventually be included in the Index despite foreign ownership limits, among other issues. It is more indicative of an EM than a FM classification. Saudi Arabia also has foreign ownership issues, yet is included in the EM Index.

Both Mexico and Indonesia make up close to 2% of the Index, but why? Considering their history, this is presumably due to a retrospective bias. From a forward-looking standpoint since 2020, our view is that their Index weightings are underestimated.

Mexico rising

Mexico comprises 2.1% of the MSCI EM SC Index (as of January 31, 2023). Although it has similar domestic issues as its peers, we believe it offers outstanding investment opportunities. Mexico is becoming increasingly relevant on the global stage considering its proximity to the U.S. and that many companies from Asia and beyond are setting up there. U.S.-based companies are following suit, including Tesla that will invest US$10 billion in a new plant in Nuevo Leon. Many of our Taiwan- and Korea-based companies are also expanding to Mexico. This nearshoring trend creates attractive investment opportunities across all sectors. According to the Inter-American Development Bank and Coldwell Banker Richard Ellis, nearshoring could represent a US$35.3 billion opportunity for Mexico, positioning the country as having the highest exports growth potential worldwide.[1] The share of Mexico’s nearshoring demand (based on % of net absorption) has increased from 10% in 2019 to 25% in Q2 2022.[2]

It’s worth mentioning that January 2023 was the strongest start of any year for Mexico’s stock exchange since 1996, despite the U.S. slowdown. We believe Mexico stands to benefit from the U.S. – Mexico – Canada Agreement for the next few years. The country’s fiscal accounts are well managed, it has low debt (50% of GDP) and its central bank will be one of the first globally to lower interest rates (currently at 11.25%). Moreover, the Mexican peso has outperformed other currencies, explained by more remittances and new foreign investments. As of Q3 2022, foreign direct investment already surpassed 2021 inflows, mostly concentrated in manufacturing and logistics.

All sectors seem robust and are expanding nicely. For example, the banking sector is one of the best capitalized in Latin America (together with Chile’s), net interest margin securities (NIMS) and cost of funding are healthy and the system as a standalone has ample liquidity and capital. Mexico is not immune to global banking events, but the main point is that its system remains strong. Why then is Mexico such a low weight in the Index? Its economics are changing, trends are evolving and global conditions for Mexico are rapidly improving. The following chart compares the returns of the MSCI Mexico Small Cap Index to its EM and World small-cap counterparts, with Mexico outperforming since 2020. Besides the factors already mentioned and that Mexico is the U.S.’s second-largest trade partner, other positive tailwinds for the country include its pension reforms and the rising possibility of a favourable outcome in its presidential elections next year. It wouldn’t surprise us if the MSCI increased its Mexico weighting in the interim.

Graph showing Mexico outperforming both its emerging market and global peers between March 2020 and April 2023.
Source: Bloomberg.

Indonesia rising

We just attended Indonesia’s largest conference – its most important of the year – where President Joko Widodo made the opening speech. At how many private conferences (especially in EMs) would a country’s president be so involved in promoting the country as a viable and attractive environment for investment? This is uncommon and means a lot. The event was exceptionally investor-friendly, with the government keen to attract capital. We also enjoyed intimate dinners with top Indonesian officials including Luhut Binsar, Coordinating Minister of Maritime and Investment Affairs who shared knowledgeable insights on the future of the country with us.

Prior to 2020, Indonesia had many restrictions that made enticing foreign capital tedious, costly and time consuming. Then the government passed its Omnibus Law, simplifying many processes and clarifying regulations to help foreign investors better understand them.

Over 500 investors from around the world attended the conference. When asked to compare Indonesia’s current investment climate to five years ago, 94% of attendees said it had improved. Despite global turmoil, Indonesia’s macroeconomic indicators in 2022 were among the best in the G20. We remain confident in the country’s economic resilience in 2023.

As the world’s fourth-largest country with a population close to 300 million, Indonesia enjoys sound demographics and is commodity rich. Its government is focused on capitalizing on trends such as nickel downstreaming where the country can be a key player in the electric vehicle market and substantially increase its country exports. We believe the downstream industry has the potential to be a transformational pillar in Indonesia’s economy and contribute to strong growth and employment. The target pipeline investment for battery chain development according to government officials at the conference is US$31.9 billion. 

In terms of fiscal discipline, the country has carried a surplus trade balance for 32 consecutive months supported by the strong performance of its downstream exports. During her presentation at the conference, Finance Minister Dr. Sri Mulyani Indrawati highlighted that as of Q3 2020, Indonesia’s GDP growth has been 5.7% year over year, one of the best in the G20, while inflation has sat at 5.5% and gross debt to GDP has averaged 41%, which are some of the lowest figures in the G20.

Sector-wise, the country’s recovery has been relatively even with mining and manufacturing surpassing pre-pandemic levels by 2022. And structural tailwinds that we also favour include Indonesia’s emerging middle class and its increasing purchasing power. Consumption benefits the most from this trend, but so do other sectors.

So, why theses low Index weights? We understand that the MSCI follows certain criteria to arrive at this outcome; however, with a forward-looking perspective we believe there’s a high probability that both Indonesia’s and Mexico’s weights will be revised. Relative to the Index, we are overweight in both countries.

Graph showing Indonesia outperforming both its emerging market and global peers between March 2020 and April 2023.
Source: Bloomberg.

This is the result of our strong bottom-up ideas that we think we have identified correctly against Indonesia’s and Mexico’s favourable investment backdrop and disciplined fiscal policies that are especially important during uncertain times.

Our approach in action

The following holdings in our view are quality companies with the balance sheets, cash flows and management team to prove it.

In Mexico, we own Grupo Aeroportuario del Centro (OMA MM). The company has a 50-year monopoly on developing, operating and maintaining 13 airports across northern and central Mexico. OMA enjoys strong margins (63% EBITDA Margin 2023E[3]), generates plenty of cash and has improved profitability on an ongoing basis even with 80% of its costs being fixed. As it relates to nearshoring, OMA is developing airports near the U.S. border and close to 65% of its traffic is associated with manufacturing and exports.

We are also positive regarding the experience of its new shareholder, Vinci Group, which builds and operates airports worldwide (on July 31 2022, Fintech informed OMA that it had entered into a share purchase agreement with a subsidiary of VINCI Airports SAS to indirectly sell 29.9% of its capital stock). OMA has maintained strong year-over-year passenger growth of +30% as of Q1 2023 and we expect its business traffic to continue recovering, where the company has larger exposure than the other two listed Mexican airports and which also reflects positively on profitability.

In Indonesia, we own Sido Muncul (SIDO IJ), the country’s largest herbal medicine company with some 300 herbal and supplement, food and beverage and pharmaceutical products. Since its IPO in 2013, Sido has grown its revenue per share and operating profit (OP) per share at c5% and c12% CAGR, respectively. In most quarters it has delivered on expectations, supported by a strong balance sheet with superior OP margins and return on invested capital, high cash flow generation and low capital intensity. As people become more health conscious, they are adopting the “back to-nature” secular trend with herbal medicines, the fastest-growing category within consumer health. Sido’s leading product portfolio, proprietary formulations and strong brand equity (it’s a household name in traditional herbal products) allow it to maintain its dominant position despite its premium pricing model. The company has a strong distribution network and vertical integration and its new extraction facilities provide superior yields and raw materials efficiencies.

Sino products on store shelves, Jakarta, January 2023.


[1] Source: Actinver Institutional Research.

[2] Ibid.

[3] Source: Bloomberg Consensus.

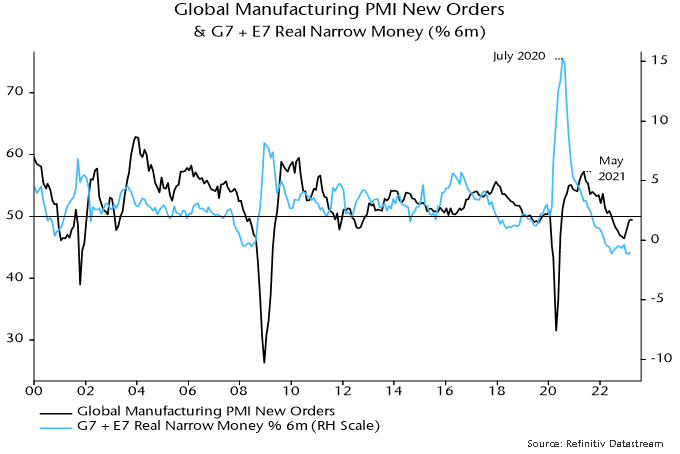
Partial information indicates that global (i.e. G7 plus E7) six-month real narrow money momentum fell for a third month in March, possibly breaching a low reached in June 2022. This increases confidence that a recent recovery in PMIs will reverse into H2. 

The June 2022 low in real narrow money momentum presaged a low in global manufacturing PMI new orders in December – see chart 1. Assuming the same six month lead, the roll-over in real money momentum since December 2022 implies a PMI decline from June. 

Chart 1

Chart 1 showing Global Manufacturing PMI New Orders & G7 + E7 Real Narrow Money (% 6m)

The fall could start earlier. The recovery in real money momentum between June and December 2022 was minor and driven entirely by a slowdown in six-month consumer price inflation. Momentum failed to break into positive territory. Credit tightening due to recent banking stresses may accelerate economic weakness. 

The renewed fall in global real money momentum since December reflects nominal money weakness rather than any inflation rebound: the six-month rate of change of nominal narrow money appears also now to be negative, a feat never achieved during the GFC – chart 2. 

Chart 2

Chart 2 showing G7 + E7 Narrow Money & Consumer Prices (% 6m)

Nominal money contraction is being driven the US and Europe, with momentum positive and stable in the E7 and Japan. 

Global real money momentum will be supported by a further inflation slowdown but a significant recovery is unlikely without a policy reversal that revives nominal money growth. As previously argued, recent reexpansion of the Fed’s balance sheet has no direct – or, probably, indirect – impact on money stock measures. 

The fall in global real money momentum has further delayed the expected cross-over above weakening industrial output momentum, suggesting fading the Q1 equity market rally and favouring defensive sectors, quality and yield.

Kevin Leon, CEO and President of Crestpoint.

From Lego towers to managing billions, meet Crestpoint’s founder, CEO and President, Kevin Leon.

We at CC&L Investment Management believe that if we can successfully tackle the key issues contributing to the leadership gender imbalance, we will substantially broaden the talent pool from which great leaders emerge and create better business outcomes.

This belief led to the founding of our Women in Leadership (WiL) initiative in 2021, which focuses on expanding leadership talent by identifying and addressing issues that have contributed to gender gaps within our organization, industry and society at large.

The work of our collective initiative has resulted in recommendations for new strategic priorities that directly target issues uncovered through discussions and research. An important – and unexpected – discovery has been that the solutions identified to break down the leadership gender imbalance also solve issues that extend beyond gender. In other words, while our focus began with women, the outcomes of our recommendations benefit everyone.

What follows is a high-level summary of WiL’s findings and proposed solutions; however, if you’re interested in learning more about our work, we would love to connect. Please contact us through this link.

Collaborating to unleash potential

Led by a committee with engagement from the majority of women in our organization, WiL’s primary objectives are:

  1. Identifying the root causes and key issues regarding gender imbalance both within and outside of our organization.
  2. Proposing solutions to proactively right size that imbalance.

Underpinning our initiative is a considerable volume of academic, media and industry research on workplace gender (in)equality. In aggregate, these findings overwhelmingly point to a systemic and persistent theme that spans almost every industry: the more senior, technical and higher-profile the jobs, the smaller the proportion of women in these roles.

We recognize that many drivers of gender inequality are outside our organization’s control, but also that our interconnectedness as industry players and members of society has tangible implications for CC&L’s ability to effect change.

Our approach in action

When examining this multi-dimensional problem, we took a bottom-up approach as to why women weren’t reaching their full potential at work. For instance, we conducted extensive interviews internally and externally as well as brainstorming sessions and in-depth research. Through this process, we identified key issues facing women in our workplace and distilled these further to determine their underlying root causes. From there, we crafted solutions to directly address the most important root causes. This involved breaking down the WiL initiative into four key areas:

  1. Societal norms
    • What we looked at: Gender-related expectations (e.g., familial obligations and caregiving responsibilities) and how to promote an equal playing field for our employees both at work and at home.
    • Our recommendations: Aimed at mitigating challenges associated with parental leave and division of household labour, with the goal of establishing better support systems for employees.
  2. Leadership competencies and qualities
    • What we looked at: Identifying and eliminating gender-related impediments to leadership development, allowing equal opportunity to grow into higher-level positions.
    • Our recommendations: Ongoing, 360-degree feedback between managers and employees and a clearly aligned vision for career progression.
  3. Work environment
    • What we looked at: Identifying enhancements in how we interact that could remove barriers to career progression. In male-dominated fields, women may struggle to build relationships and feel part of the team. Their confidence may be impacted such that they are reluctant to give and receive feedback or voice and pursue ambitious goals.
    • Our recommendations: Foster a safe and inclusive workplace that nurtures professional development.
  4. Hiring
    • What we looked at: Achieving a more gender-balanced workforce supported by hiring practices that address gender-based constraints. Areas of focus include:
       
      • The talent pool: There is an underrepresentation of women in senior positions.
        Our recommendations: Seek to improve gender balance in the overall talent pool over time by focusing on entry-level applicants and career development.
      • CC&L’s application pool: Gender imbalances at both senior and entry levels.
        Our recommendations: Focus on increasing the likelihood of receiving applications from experienced women, as well as developing awareness about how women can succeed in capital markets.
      • Our hiring process: Unconscious bias can screen out qualified women.
        Our recommendations: Implementing hiring practices and success measures that minimize unconscious bias.

A brighter future for all

We adopted a gender-neutral approach in designing our solutions, which not only promotes inclusivity and diversity but also enhances the overall quality of our work environment. While the task of implementing the more than 20 solutions (outlined in our full report) may seem ambitious, we believe that by breaking it down into smaller, actionable steps, we can effectively prioritize and execute our recommendations over a multi-year period, ensuring we achieve our objectives. We expect that the WiL initiative will continue to grow and evolve over time as needs and expectations change through the implementation process.  This will likely result in periodic adjustments to the longer-term implementation roadmap.

By coming together to reinforce a culture of fairness, open dialogue and opportunities, we create conditions for success. With this in mind, we are hopeful that the positive impacts of our WiL initiative will ripple across our organization and into the communities where we live and do business – leading to better leadership, stronger teams and a brighter future for all.

If you’re interested in learning more about our work, we would love to connect. Please fill out the form below:

Magnifier focusing on a financial & technical data analysis graph.

During times of volatility and uncertainty, quality investing can be a common buzzword among investment managers and the media alike. But what is it exactly? This commentary discusses what quality investing means and how Global Alpha incorporates its quality bias into its portfolios.

Novice investors often confuse defensive characteristics for quality, as the quality factor falls under the defensive category. However, defensive stocks are defined by their non-cyclicality, which means their financial performance isn’t significantly affected by the state of the economy. These stocks, such as household products, utilities, food suppliers and discount retailers, tend to outperform cyclicals during recessions and also on an absolute basis.

In contrast, quality investing is unrelated to market cycles or sectors. Instead, it’s defined by certain fundamental characteristics that distinguish a company from its peers. These include factors that give a business a more durable and sustainable competitive advantage, as well as profit and cash flow stability. Key variables that define the quality factor include:

  • Moat: This term, popularized by Warren Buffett, refers to the factors that allow a company to maintain its long-term competitive advantage over its peers (e.g., economies of scale, intangible assets, switching cost, etc.).
  • Business model: A durable corporate structure and business strategy can enable a company to remain nimble and competitive, unlike many Japan-based companies with bloated corporate structures operating in multiple unrelated lines of business.
  • Corporate governance: This criterion examines management strength and the quality of the rules of governance. Strong governance practices are now widely accepted within the investment community as beneficial (given the rise of ESG investing).
  • Balance sheet: A company with a quality bias tends to have a high return on equity, low and sustainable debt, low earnings growth variance and strong cash flow generation.

Quality is a well-documented source of alpha. Eugene Fama and Kenneth French, who won the 2013 Nobel prize in Economics for their three-factor model (size, value, market risk) have updated their model to include two factors related to quality: profitability and asset growth. This is backed up by other research that has also shown how profitability and stability are as useful as size, value and market risk at explaining returns.

So why don’t all managers have a quality bias? Although many studies illustrate that quality tends to outperform over long periods, there will be times when it does poorly relative to other factors. Most notably, quality companies tend to underperform in momentum-based environments wherein investors disregard fundamentals and valuation and stock winners keep on winning. The last decade has seen many momentum-driven cycles, including the COVID-19 rebound in 2020 during which tech stocks were in vogue and names like Zoom, Robinhood and Peloton were trading at multiples that implied they would become the next Apple or Microsoft.

Quality-biased fund managers can encounter several challenges in such environments, including avoiding speculative names and selling their winners too soon. Quality strategies often incorporate GARP (Growth at a Reasonable Price) even though discussions of quality as a factor do not technically address valuation. However, their bottom-up approach and consistent growth of their companies make these investment managers more aware of the cost they are paying for that growth. Quality strategies can offer superior downside protection and steadier returns than peers despite not experiencing the same highs as momentum strategies.

An example of a quality holding in our portfolios is CVS Group (CVSG LN), one of the U.K.’s largest veterinary practice operators and consolidators. The company’s complete service offering includes laboratories, surgeries and crematoria. CVS is known for hiring new graduates and providing them with training and development, creating a consistent pool of veterinarians in a talent-scarce and competitive industry.

The company satisfies most of our quality criteria, including:

  • Economies of scales as a moat: The company’s management has a strong track record of growth through disciplined M&A and sustained organic growth. With over 25% market share in the U.K. and a differentiator as a higher-end veterinary care business, CVS has comfortable pricing power, and generates steady and predictable earnings per share (EPS) and cash flow growth.
  • Balance sheet and financials: Despite its M&A activity, the company’s net debt is well below 1x earnings before interest, taxes, depreciation and amortization (EBITDA). Management’s ambitious plan to double EBITDA over the next five years is expected to bring that ratio to a manageable 1.2x EBITDA, demonstrating their intent to maintain a nimble and flexible balance sheet.
  • Corporate structure and governance: In 2022, the company made governance structure adjustments to align with the UK Corporate Governance Code, despite not being obligated to comply with the code given its AIM listing. CVS’s governance framework is clear and transparent, with board activity and accomplishments provided to investors in the company’s annual reports.

At Global Alpha, we prioritize quality names like CVS in our investment strategy. The company provides downside protection while capturing above-market rates of sustained EPS and cash flow growth, allowing us to continue to build portfolios from the ground up.

Magnifier focusing on a financial & technical data analysis graph.

During times of volatility and uncertainty, quality investing can be a common buzzword among investment managers and the media alike. But what is it exactly? This commentary discusses what quality investing means and how Global Alpha incorporates its quality bias into its portfolios.

Novice investors often confuse defensive characteristics for quality, as the quality factor falls under the defensive category. However, defensive stocks are defined by their non-cyclicality, which means their financial performance isn’t significantly affected by the state of the economy. These stocks, such as household products, utilities, food suppliers and discount retailers, tend to outperform cyclicals during recessions and also on an absolute basis.

In contrast, quality investing is unrelated to market cycles or sectors. Instead, it’s defined by certain fundamental characteristics that distinguish a company from its peers. These include factors that give a business a more durable and sustainable competitive advantage, as well as profit and cash flow stability. Key variables that define the quality factor include:

  • Moat: This term, popularized by Warren Buffett, refers to the factors that allow a company to maintain its long-term competitive advantage over its peers (e.g., economies of scale, intangible assets, switching cost, etc.).
  • Business model: A durable corporate structure and business strategy can enable a company to remain nimble and competitive, unlike many Japan-based companies with bloated corporate structures operating in multiple unrelated lines of business.
  • Corporate governance: This criterion examines management strength and the quality of the rules of governance. Strong governance practices are now widely accepted within the investment community as beneficial (given the rise of ESG investing).
  • Balance sheet: A company with a quality bias tends to have a high return on equity, low and sustainable debt, low earnings growth variance and strong cash flow generation.

Quality is a well-documented source of alpha. Eugene Fama and Kenneth French, who won the 2013 Nobel prize in Economics for their three-factor model (size, value, market risk) have updated their model to include two factors related to quality: profitability and asset growth. This is backed up by other research that has also shown how profitability and stability are as useful as size, value and market risk at explaining returns.

So why don’t all managers have a quality bias? Although many studies illustrate that quality tends to outperform over long periods, there will be times when it does poorly relative to other factors. Most notably, quality companies tend to underperform in momentum-based environments wherein investors disregard fundamentals and valuation and stock winners keep on winning. The last decade has seen many momentum-driven cycles, including the COVID-19 rebound in 2020 during which tech stocks were in vogue and names like Zoom, Robinhood and Peloton were trading at multiples that implied they would become the next Apple or Microsoft.

Quality-biased fund managers can encounter several challenges in such environments, including avoiding speculative names and selling their winners too soon. Quality strategies often incorporate GARP (Growth at a Reasonable Price) even though discussions of quality as a factor do not technically address valuation. However, their bottom-up approach and consistent growth of their companies make these investment managers more aware of the cost they are paying for that growth. Quality strategies can offer superior downside protection and steadier returns than peers despite not experiencing the same highs as momentum strategies.

An example of a quality holding in our portfolios is CVS Group (CVSG LN), one of the U.K.’s largest veterinary practice operators and consolidators. The company’s complete service offering includes laboratories, surgeries and crematoria. CVS is known for hiring new graduates and providing them with training and development, creating a consistent pool of veterinarians in a talent-scarce and competitive industry.

The company satisfies most of our quality criteria, including:

  • Economies of scales as a moat: The company’s management has a strong track record of growth through disciplined M&A and sustained organic growth. With over 25% market share in the U.K. and a differentiator as a higher-end veterinary care business, CVS has comfortable pricing power, and generates steady and predictable earnings per share (EPS) and cash flow growth.
  • Balance sheet and financials: Despite its M&A activity, the company’s net debt is well below 1x earnings before interest, taxes, depreciation and amortization (EBITDA). Management’s ambitious plan to double EBITDA over the next five years is expected to bring that ratio to a manageable 1.2x EBITDA, demonstrating their intent to maintain a nimble and flexible balance sheet.
  • Corporate structure and governance: In 2022, the company made governance structure adjustments to align with the UK Corporate Governance Code, despite not being obligated to comply with the code given its AIM listing. CVS’s governance framework is clear and transparent, with board activity and accomplishments provided to investors in the company’s annual reports.

At Global Alpha, we prioritize quality names like CVS in our investment strategy. The company provides downside protection while capturing above-market rates of sustained EPS and cash flow growth, allowing us to continue to build portfolios from the ground up.

TORONTO, ON, April 5, 2023 – Crestpoint Real Estate Investments Ltd. (Crestpoint) today announced the acquisition of a two building multi-family complex located at 2 & 4 Hanover Road in Brampton, Ontario (the Property).

The Property, comprised of two towers of 18 and 22 storeys, respectively, with a total of 605 units and 946 parking stalls, provides an attractive mix of 1, 2 and 3-bedroom suites that currently have a ~97% occupancy rate. In addition to the two existing towers, the Property’s 10 acre site can also support the development of an additional ~400 units in the future. The desirable location, minutes away from Highway 410 and both the Bramalea and Brampton GO stations, offers tenants easy access to multiple schools and a variety of retail, community and recreational amenities including Chinguacousy Park. Vestcor Inc. and Crestpoint, on behalf of the Crestpoint Core Plus Real Estate Strategy (its open-end fund), split a 90% interest in the Property. InterRent REIT acquired the remaining 10% and will provide property management services on behalf of the ownership group.

The closing of this acquisition brings Crestpoint’s total assets under management to approximately $9.9 billion and 36.5 million square feet.

About Crestpoint

Crestpoint Real Estate Investments Ltd. is a commercial real estate investment manager dedicated to providing investors with direct access to a diversified portfolio of commercial real estate assets. Crestpoint is part of the Connor, Clark & Lunn Financial Group, a multi-boutique asset management company that provides investment management products and services to institutional and high-net-worth clients. With offices across Canada and in Chicago, London and Gurugram, India, Connor, Clark & Lunn Financial Group and its affiliates are collectively responsible for the management of approximately $104 billion in assets. For more information, please visit: www.crestpoint.com.

Contact

Elizabeth Steele  
Director, Client Relations  
Crestpoint Real Estate Investments Ltd.  
(416) 304-8743  
[email protected]

Connor, Clark & Lunn Funds Inc. (the “Manager”) has amended language on its website in an effort to clarify that ESG factors and representations made by the Manager are not investment objectives, nor do they form a material element of the investment strategies of its publicly offered mutual funds. The following statement was removed at the request of Ontario Securities Commission Staff in the course of an issue-oriented review of ESG-related funds: “CC&L Funds is committed to engaging in responsible corporate behavior as it relates to environmental, social, and governance (ESG) concerns and seeks to make investments that not only generate superior returns for its investors but have a positive impact on the society, environment, and markets in which they operate.”

In addition to amending its website, the Manager has updated the disclosure in the simplified prospectus for its alternative mutual funds prospectus and is in the process of updating the simplified prospectus for its conventional mutual funds in order to provide specific disclosure to investors regarding the role that ESG factors and considerations play in the investment decision-making process of certain funds.

Funds included in the Manager’s alternative mutual fund simplified prospectus:

  • CC&L Alternative Income Fund
  • CC&L Global Long/Short Fund
  • CC&L Global Market Neutral II Fund
  • PCJ Absolute Return II Fund

Funds included in the Manager’s conventional mutual fund simplified prospectus:

  • CC&L Core Income & Growth Fund
  • CC&L Diversified Income Portfolio
  • CC&L Equity Income & Growth Fund
  • CC&L Global Alpha Fund
  • CC&L High Yield Bond Fund
  • NS Partners International Equity Focus Fund

About Connor, Clark & Lunn Funds Inc.

Connor, Clark & Lunn Funds Inc. (CC&L Funds) partners with leading Canadian financial institutions and their investment advisors to deliver unique institutional investment strategies to individual investors through a select offering of funds, alternative investments and separately managed accounts.

By limiting the offering to a focused group of investment solutions, CC&L Funds is able to deliver unique and differentiated strategies designed to enhance traditional investor portfolios. For more information, please visit cclfundsinc.com.

About Connor, Clark & Lunn Financial Group Ltd.

Connor, Clark & Lunn Financial Group Ltd. (CC&L Financial Group) is an independently owned, multi-affiliate asset management firm that provides a broad range of traditional and alternative investment management solutions to institutional and individual investors. CC&L Financial Group brings significant scale and expertise to the delivery of non-investment management functions through the centralization of all operational and distribution functions, allowing talented investment managers to focus on what they do best. CC&L Financial Group’s affiliates manage over $104 billion in assets. For more information, please visit cclgroup.com.

For further information, please contact:

Lisa Wilson
Manager, Product & Client Service
Connor, Clark & Lunn Funds Inc.
416-864-3120
[email protected]

Global economic sentiment has improved on the back of China’s reopening and a collapse in the European gas price but monetary indicators continue to signal a negative outlook. The “excess” money backdrop remains unfavourable for equity markets, with prospective developments suggesting overweighting non-energy defensive sectors and expecting a further relative recovery in quality / growth. 

Revisions to US seasonal adjustments have slightly altered the recent profile of global (i.e. G7 plus E7) six-month real narrow money momentum – the key leading indicator in the money / cycles forecasting approach used here. On the new numbers, momentum bottomed in June 2022, recovering modestly into December before falling back in January / February – see chart 1. 

Chart 1

Chart 1 showing Global Manufacturing PMI New Orders & G7 + E7 Real Narrow Money (% 6m)

The June turning point has been followed – with a lag within the normal range – by a recovery in global manufacturing PMI new orders from a low in December, with the revival driven by a sharp rise in the Chinese component. 

The PMI recovery is expected to fizzle out and reverse into H2, for both monetary and cycle reasons. Six-month real narrow money momentum, as noted, fell back in January / February and remains in negative territory – a sustained economic / PMI recovery has never occurred historically against such a monetary backdrop. 

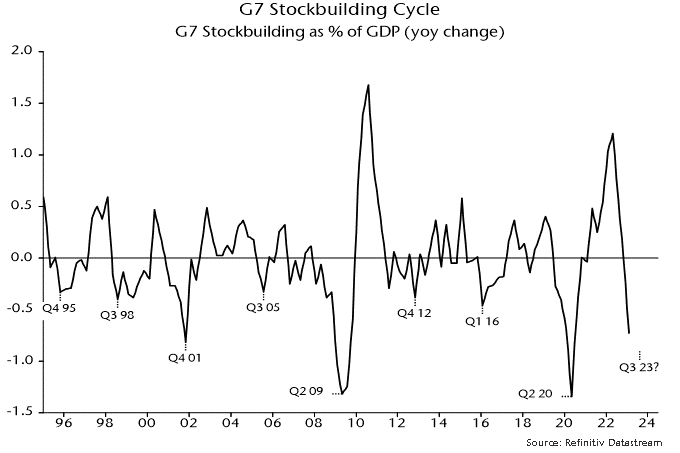
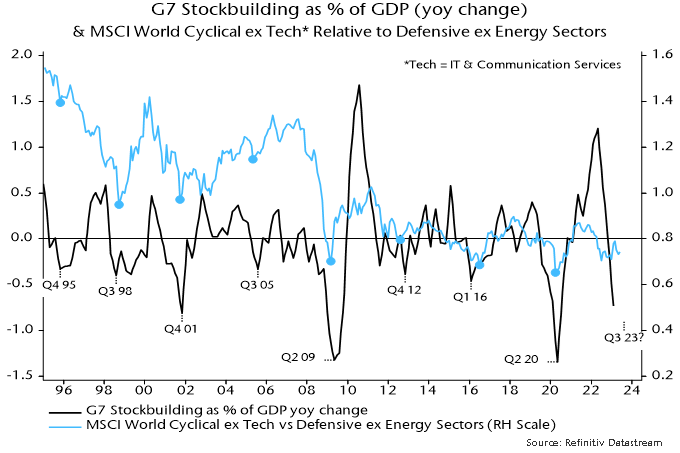
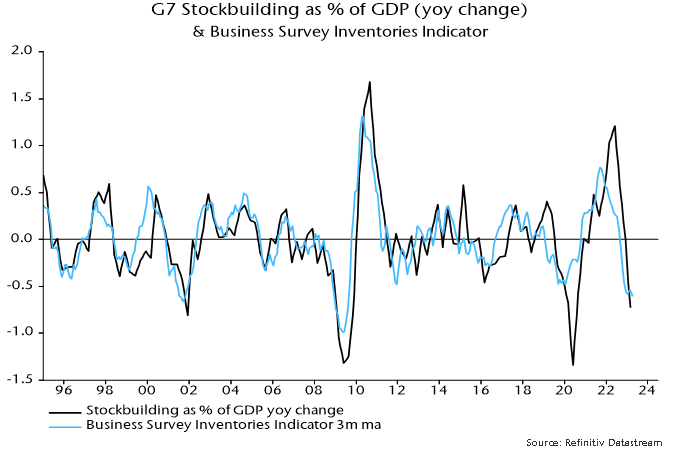
From a cycles perspective, major PMI lows occur around troughs in the stockbuilding cycle but the current downswing phase was only starting when PMI new orders bottomed in December. With the last cycle trough in Q2 2020, the average historical cycle length of 3 1/3 years suggests another low in H2 2023. 

The marginal recovery in global six-month real narrow money momentum since June 2022 has been driven entirely by China and several other E7 economies. US / European momentum has slid deeper into negative territory as already restrictive monetary policy settings have been tightened further – chart 2. 

Chart 2

Chart 2 showing Real Narrow Money (% 6m)

The Chinese pick-up suggests economic acceleration through 2023 but a recovery will be held back by – and won’t offset – global weakness. Current Chinese real money strength, moreover, could fade: higher short-term rates / yield curve flattening since late 2022 suggest a slowdown in nominal money growth while unusually low inflation may revive as the economy normalises. 

The assessment of market prospects relies on two indicators of global “excess” money – the gap between six-month real narrow money and industrial output momentum, and the deviation of year-on-year real money momentum from a long-term moving average. The signs of the two indicators define four investment quadrants describing different market environments – see table 1. (This presentation echoes Hedgeye’s investment “quads”, in their case defined by the directions of economic growth and inflation – the approach here offers an alternative “monetarist” perspective.) 

Table 1

Table 1 showing “Excess” Money Quadrants Real Narrow Money % yoy minus Slow MA

The two indicators were negative from January 2022 (allowing for reporting lags) through year-end but the last quarterly commentary suggested that the first measure would turn positive in early 2023 as weakening industrial output momentum crossed below stable or rising real money momentum. Based on historical patterns, the implied shift from the bottom right to top right quadrant might be associated with less negative equity markets and a reversal of some of last year’s sector / style moves, including relative recoveries in quality / growth and tech – table 2. 

Table 2

Table 2 showing “Excess” Money Quadrants Real Narrow Money % yoy minus Slow MA

The suggested sign switch of the first indicator had not occurred by January – chart 3 – but markets appeared to front run the quadrant shift in Q1, with tech / growth outperforming strongly and energy / financials weak. A cross-over of six-month industrial output momentum below real money momentum is still expected here, although timing is uncertain – Chinese reopening has delayed industrial weakness. Some Q1 moves were extreme so it may be advisable to await confirmation before adding to favoured themes. 

Chart 3

Chart 3 showing G7 + E7 Industrial Output & Real Narrow Money (% 6m)

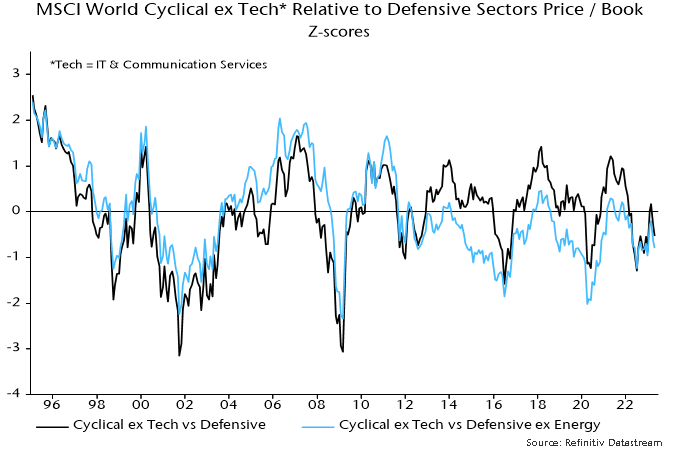
A common characteristic of the right hand quadrants of the table is a trend of non-energy defensive sectors outperforming non-tech cyclical sectors. The reverse occurred during Q1, although much of the cyclical relative gain unwound later in the quarter as financials were pummelled by banking crises. With no early move to the left hand of the table in prospect, an overweighting of non-energy defensive sectors – along with quality, which also usually outperforms in both right hand quadrants – is suggested. 

The stark contrast between positive and rising E7 six-month real narrow money momentum and faster contraction in the G7 raises the question of whether investors should overweight EM equities. Over 1990-2022, EM equities outperformed developed markets by 3.2% pa on average when the E7 / G7 real money momentum gap was positive, underperforming by 6.1% when it was negative. 

Further investigation, however, indicates that a positive gap is a necessary but not sufficient condition for EM outperformance – the global “excess” money backdrop, in addition, needs to be taken into account. Table 3 shows that, since 1990, EM equities have outperformed on average only when both the E7 / G7 gap and the first global excess money indicator were positive. Confirmation of a sign change in the latter indicator would strengthen the case for overweighting EM. 

Table 3

Table 3 showing Average Excess Return on MSCI EM vs MSCI World 1990-2022, % pa E7 minus G7 Real Narrow Money % 6m

Historically, periods of sustained EM outperformance coincided with trend declines in the US dollar. The dollar reached major peaks in 1969, 1985 and 2002. These peaks occurred 6-7 years before housing cycle lows (in 1975, 1991 and 2009). Assuming a normal (i.e. c.18 year) cycle length, another cycle low is scheduled for the late 2020s. A dollar peak in October 2022, therefore, may turn out to be a major top, preceding a trend decline into or beyond the housing cycle trough.

Each year, the CC&L Foundation supports numerous not-for-profit organizations across Canada in support of:

  • promoting a better environment;
  • improving education;
  • advancing science and medicine;
  • creating stronger communities; and
  • encouraging the arts.

In particular, it aims to support organizations in which our employees or partners have a personal connection and have made financial or time commitments.

CC&L Foundation commits $125,000 to Ronald McDonald House Charities Alberta

In 2022, the CC&L Foundation committed $125,000 to Ronald McDonald House Charities Alberta. The Ronald McDonald House supports families who need to travel while seeking vital medical treatment for their seriously sick or injured child. They provide a home-away-from-home when those families are experiencing one of life’s most difficult times. Each year, thousands of families will stay at one of the four Ronald McDonald houses in Alberta, and stays can last anywhere from a few nights to several months.

Currently, Ronald McDonald Houses are only able to serve 14% of those who need to travel for pediatric care within Alberta. This results in some families being turned away to make their own arrangements, sometimes resulting in keeping families away from their children. To expand capacity and assist in meeting the high demand, Ronald McDonald Houses are in the process of doubling their capacity in Edmonton and Calgary. The CC&L Foundation’s donation is contributing to these expansion projects.

CC&L Private Capital volunteers at Home for Dinner

Jim Kapeluck is a Wealth Advisor with our CC&L Private Capital team in Edmonton. Earlier this year, Jim and the local team volunteered at one of the Ronald McDonald ‘Home for Dinner’ nights. The team prepared and served meals to families in need.

Find out more about the work of the CC&L Foundation.