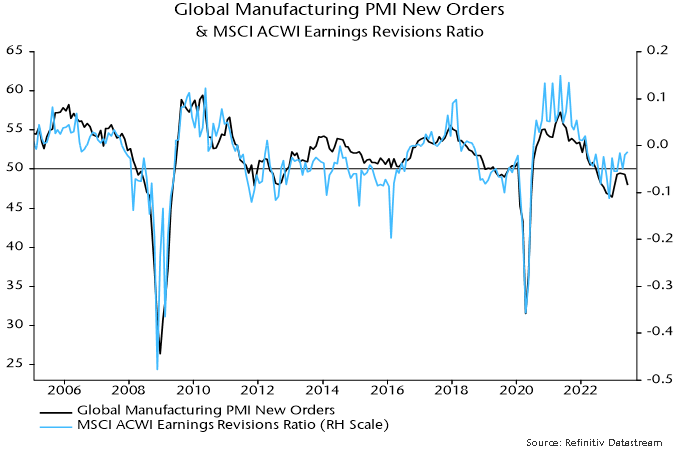
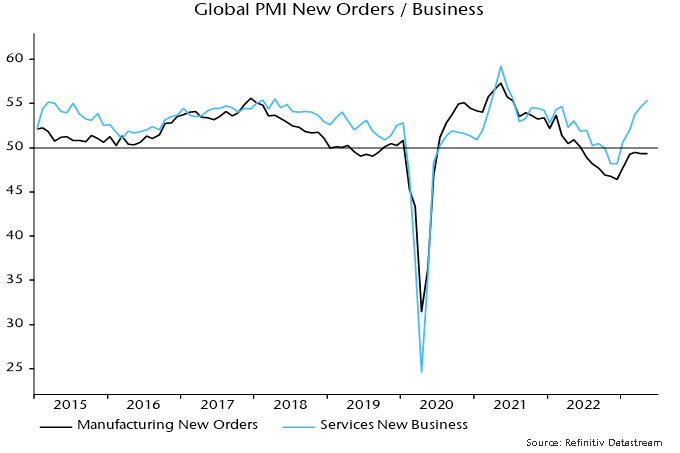
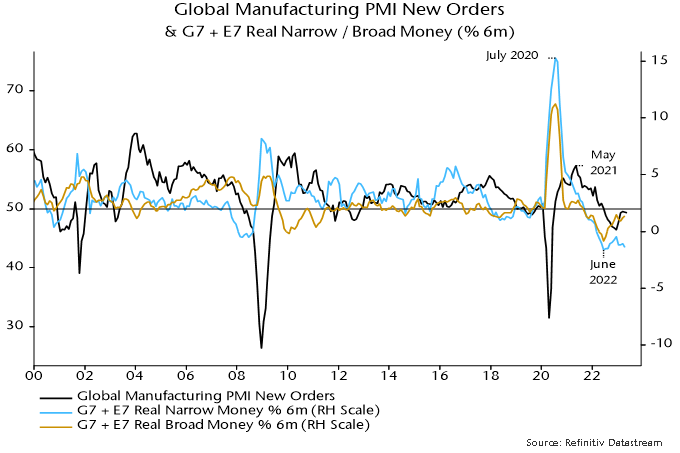
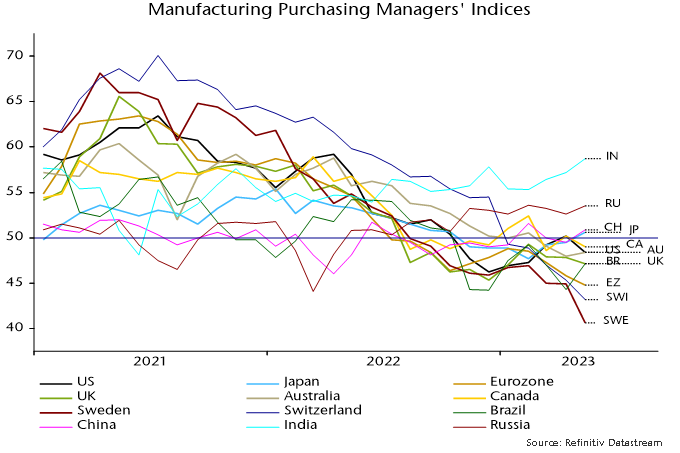
The global manufacturing PMI new orders index – a timely indicator of global goods demand – was little changed below 50 (49.4) in April, a weaker result than had been suggested by DM flash results. 

Inventories indices for finished goods and production inputs, meanwhile, rose further to their highest levels since November. Accordingly, new orders / inventories differentials – which often lead at turning points – fell for a second month. 

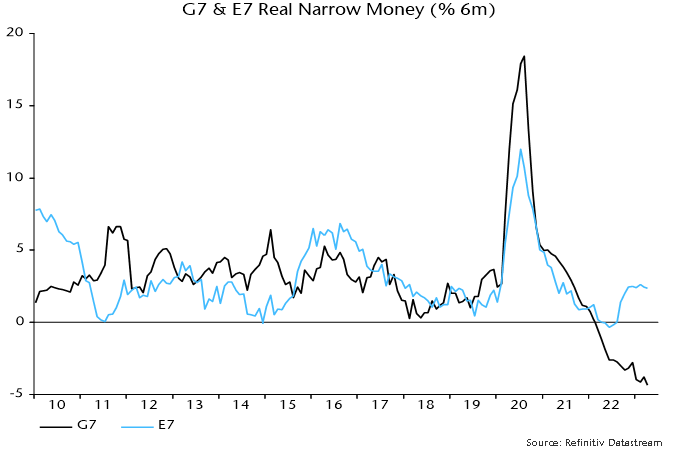
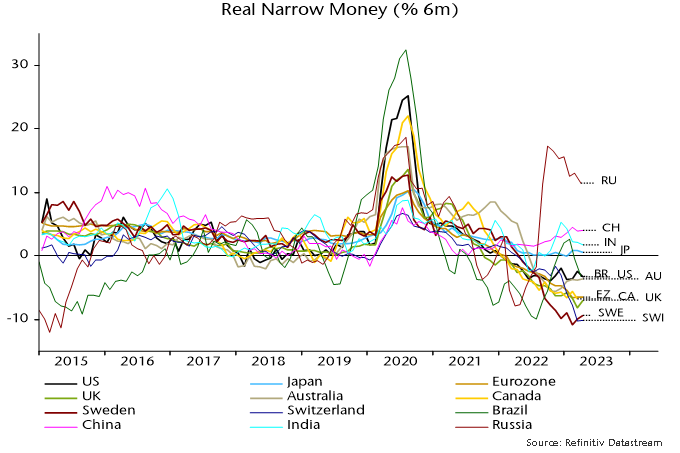
These results are consistent with the forecast here that a recovery in PMI new orders since December 2022 would fizzle out in H1 and reverse into H2, with a possibility of a break below the December low. The basis for the forecast was a relapse in global (i.e. G7 plus E7) six-month real narrow money momentum around end-2022. Real money momentum moved sideways in March at around its June 2022 low – see chart 1.

Chart 1

Chart 1 showing Global Manufacturing PMI New Orders & G7 + E7 Real Narrow Money (% 6m)

A downswing in the stockbuilding cycle was a key driver of earlier PMI weakness. A further drag is in prospect but the down phase of the cycle is well advanced, with incoming data and average cycle length suggesting a low during H2. 

Business capex is emerging as a new source of global goods demand weakness. The capital goods component of PMI new orders reached a new low in April – chart 2. 

Chart 2

Chart 2 showing Global Manufacturing PMI New Orders

A contraction in business investment is consistent with a squeeze on real profits in late 2022 – chart 3 – and weak corporate money trends: business broad money holdings have fallen in nominal terms recently in the US, Eurozone and UK – chart 4. 

Chart 3

Chart 3 showing G7 Business Investment (% yoy) & Real Gross Domestic Operating Profits (% yoy)

Chart 4

Chart 4 showing Broad Money Holdings of Business / Corporations (% 6m)

Other evidence of a capex downturn includes: 

  • Weak capex intentions in regional Fed manufacturing surveys (and the NFIB small firm survey) – chart 5.  
  • Weak enterprise loan demand for fixed investment in the ECB bank lending survey – chart 6.  
  • Falling capital goods / machinery orders in the US, Japan and Germany – chart 7.

Chart 5

Chart 5 showing US Non-Residential Fixed Investment (% yoy) & Regional Fed Expected Capex Average* *Average of Dallas, Kansas, New York, Philadelphia & Richmond

Chart 6

Chart 6 showing Eurozone Non-Residential Fixed Investment (% yoy) & ECB Bank Lending Survey, Loan Demand from Enterprises for Fixed Investment

Chart 7

Chart 7 showing Capital Goods Orders January 2015 = 100

Capex retrenchment is usually accompanied by a fall in labour demand. Adjusted for negative revisions to the prior two months, the addition to US non-farm payrolls in April was 104,000, the smallest since January 2021 – chart 8. Revisions in the last three reports cumulate to -200,000, a level rarely reached outside recessions – chart 9.

Chart 8

Chart 8 showing US Non-Farm Payrolls Change (000s) First Estimate Actual & Adjusted for Revisions to Prior 2 Months

Chart 9

Chart 9 showing US Non-Farm Payrolls Change Revisions to Prior 2 Months (000s)
Biofuel storage tanks at a power plant.

Earlier this month, we attended a conference in San Francisco that focused on various carbon removal technologies, including direct air capture, land-based carbon removal and enhanced mineralization. The conference had over 650 participants, with 130 of them being corporates from both private and public companies that are working toward reducing carbon emissions. The number of start ups in this space has grown exponentially in the last couple of years and the United States is becoming a leading global carbon capture centre.

The Inflation Reduction Act (IRA), passed in August 2022, has created favourable conditions for carbon capture technology deployment in the U.S. The most notable provision is the 45Q tax credit for CO2 storage, which aims to promote carbon capture utilization and storage (CCUS).Companies providing direct air capture technologies have grown from only three start ups a couple of years ago to over 60 today. One of the reasons for this is the attractive credit of US$130 per tonne of CO2 captured and stored.

We also learned more about the Department of Energy’s Loan Programs Office (LPO), which grants debt capital to companies providing clean energy services and infrastructure. Over the last decade, this office has already issued over US$38 billion, with billions more available for future funding. The LPO is focused on providing capital in three main areas:

  1. Title 17 Clean Energy Loan Program to accelerate the commercial deployment of innovative energy technologies.
  2. Advanced Technology Vehicles Manufacturing Direct Loan Program to promote local manufacturing of more fuel-efficient and clean vehicles.
  3. Tribal Energy Loan Guarantee Program to support the investments into energy projects for federally recognized tribes.

Many companies that will benefit from the IRA are also eligible to receive additional debt financing if they meet any of the LPO’s three programs, unlocking capital to deploy into clean technologies. With the amount of capital pouring into clean energy sectors, it is definitely an exciting time to follow the sector.

Although carbon capture is a difficult area to gain exposure to in public markets, there are a few public companies that have internally incubated such technologies. One such company is Advantage Energy Ltd. (AAV CN), which we currently own and had the opportunity to meet at the conference. Advantage is an Alberta-based natural gas and light oil producer that has started a subsidiary clean-tech company, Entropy, providing modular carbon capture and storage technology. Advantage owns 85% of Entropy, with Brookfield Renewable being the other strategic owner.

Entropy’s carbon capture technology is already in operation at Advantage’s Glacier Gas Plant and has a capture rate of 90% to 95% of post-combustion flue gas. With the addition of the technology, Advantage’s carbon emissions at that specific plant have fallen by about 15%, resulting in a CO2 savings of about 47,000 tonnes annually. This helps make the company one of the lowest emission intense producers compared to its peers.

The carbon capture process involves capturing the CO2 from the flue gas stream emitted by the plant, processing it by scrubbing it with a chemical solvent and then storing the captured CO2 permanently deep underground. The process is illustrated in the figure below.

The post-combustion carbon capture technology is a strategic advantage for Entropy and the company is a key asset for Advantage Energy. Currently, there are only two operating post-combustion carbon capture projects in the world. The post-combustion technology can be retrofitted to existing energy-generating assets, which is the market the company aims to serve through its capital-light licence and support model, in addition to developing, owning and operating carbon capture units. Moreover, Entropy uses its proprietary solvent called Entropy23 that allows for lower input and operating costs due to its superior chemistry developed in-house. 

Currently, Entropy is benefiting from Canada’s investment tax credit of 50% for carbon capture equipment, but it is also expanding its team to focus its commercial efforts in the U.S. to benefit from the IRA. Recently, the company announced a first memorandum of understanding with California Resources Corporation, in which Entropy will provide technology, engineering and development services to decarbonize gas-fired boilers, avoiding about 400,000 tonnes of carbon annually. 

Aurubis AG (NDA GY), Europe’s largest copper producer and the world’s largest copper recycler is worth mentioning for its commitment to reducing its carbon footprint. Copper smelting is a heavy emitting activity but critical for the energy transition as we have highlighted in a previous note. The company has set Science-Based Targets with a goal of 1.5-degree alignment by 2030 and is piloting the use of blue ammonia in its production process for copper rods at its Hamburg facility. The carbon dioxide by-product from blue ammonia production is captured and stored underground. If successful, Aurubis will permanently switch to blue ammonia, potentially saving 4,000 tonnes of CO2 annually.  

The opportunities in the carbon capture space are extremely attractive, with both policy and capital driving growth. We are confident that Advantage and Aurubis will benefit from them in the future while providing critical technology in helping it and other companies achieve net-zero goals. 

PETRONAS Twin Towers in Kuala Lumpur, Malaysia.

The strategy saw strong contributions from holdings in ASEAN (Indonesia, Malaysia, and the Philippines) and the Middle East in the quarter. However, this was offset by losses in the Africa portfolio. As we have written about in previous letters, we have been actively reducing the strategy’s exposure to Africa (specifically Egypt and Kenya) and increasing it in ASEAN and the Middle East (Saudi Arabia and the United Arab Emirates). African economies are undergoing severe macroeconomic headwinds that have overwhelmed equity returns and exerted pressure on earnings. Conversely, ASEAN and Middle Eastern economies have been performing reasonably well, allowing us to harvest healthy USD equity returns through earnings growth and multiples expansion.  

Continuing with the above theme, we decided to fully tender out the strategy’s shares in East African Breweries Ltd. (EABL) to Diageo PLC at a price of Ksh192/share (compared to the Ksh170/share price as of the date of this letter). While Diageo paid a premium of 35% versus the one-year average (at the time of the “intention to acquire” announcement in October 2022), the deal multiples were highly favourable to Diageo at ~14x 2023 earnings, a substantial discount to emerging and frontier market brewers. We tendered out at these low multiples due to two factors: first, there are limited incremental buyers for EABL given the macroeconomic environment and stock market illiquidity in Kenya; second, the Diageo bid presented a relatively lucrative way for us to reduce exposure to Africa, in line with our strategy. Following the deal, EABL will remain listed on the Nairobi Stock Exchange with Diageo’s ownership now up to 65%, from just over 50% pre-tender. We will continue to monitor EABL and potentially re-enter the stock once the economic environment in Kenya settles.  

The strategy was very active during the quarter in both ASEAN and the Middle East. In ASEAN, we invested in CTOS, Malaysia’s leading private credit reporting agency, which holds over 70% of the country’s credit reporting market. Due to the high barriers to entry in this industry, market leaders like CTOS are likely to sustain their position as they continue to compound their data sets and create new use cases for their customers. Malaysia is a particularly underpenetrated market for credit reporting, as financial institutions still rely heavily on their internal data to underwrite credit. Malaysia is interesting because financial inclusion is high at around 95%, yet 65% of the population still does not have a regulated credit account. As financial sophistication grows and credit compliance requirements tighten, demand for CTOS’s services should increase significantly. With scale and technology that enables it to generate operating income margins of ~40%, we expect CTOS to achieve ~20% growth for the next few years. We have followed CTOS since it listed on the Bursa Malaysia in July 2021, but had reservations on its valuation and the previous management team, who we thought were brought on just to list the company rather than the focus on generating long-term value. When the previous CEO left the company, we went to Kuala Lumpur to meet with the new CEO, Erik Hamburger, a former executive at Experian, who articulated a growth strategy around product development, digital strategy, and sales initiatives that we thought, if well executed, would unlock tremendous value for shareholders. With a positive view on the company and management, it was a case of waiting for a valuation opportunity to open, which finally happened in this quarter.  

The strategy also invested in Al Ansari Financial Services (AFS), a UAE-based remittance and currency exchange house that is a leader in the second-largest market remittance market globally (after the U.S.). AFS focuses primarily on small-ticket money flows from the UAE to countries in Asia (example: Philippines), Sub-continent (India and Pakistan), and the Middle East and North Africa (Jordan and Egypt). AFS focuses primarily on small ticket remittance flows, a market that banks are strategically not interested in, and that fintechs have found difficult to penetrate. For context, the company reports that 67% of the remittances it facilitates are less than $400 per transaction. AFS has a robust offline network in 226 carefully selected locations across the UAE, which captures monthly remittance flows from blue-collar and underbanked white-collar workers. This offline network is supported by a strong online presence, where it has a top ranked app that processes 41% of personal digital outward remittances among exchange houses. AFS’ management have executed well, deepening the company’s competitive advantage, and translating that to operating margins of ~50%, on healthy mid-teens top line growth.

Despite the softer performance during the first quarter, we remain constructive on the strategy’s outlook. We believe the current environment is conducive to stock pickers, with valuations as attractive as they’ve been since we launched the strategy in 2018. Moreover, the economic environment is expected to deepen the competitive edge of portfolio companies in their respective markets. 

As we have done in previous letters, we sign off by reminding our investors that our objective is to deliver differentiated returns that are attributed to investing skill (alpha) rather than market directionality (beta). We believe there are abundant alpha opportunities in frontier and emerging markets, which we choose to express through a concentrated but geographically diverse portfolio of companies with idiosyncratic earnings drivers and share-price catalysts. While there may be significant deviations from global and emerging market indices in certain periods, the hope is that our approach will provide a superior risk-adjusted return profile to investors over the long term. 

Vergent Asset Management LLP

Night View of Dubai Architecture Complex.

Gulf equity markets underperformed their emerging market peers (as measured by the MSCI Emerging Markets Index) for the second consecutive quarter. This weaker market performance can be attributed to some of the same factors we highlighted in the Q4 2022 Manager Letter namely, higher interest rates and lower oil prices. These factors present a headwind to earnings growth for the banking, energy, and materials sectors, which together constitute 69% of the S&P Pan Arab Composite Index. Banks have been a particularly sore area for the market, with profitability ratios starting to crack under the pressure of higher rates and concerns about capital allocation and corporate governance at two large banks in Saudi Arabia and the UAE. The news of indirect exposure to Adani Group companies and a potential acquisition of Standard Charter Group at First Abu Dhabi Bank, combined with the write-down of the unfortunate Credit Suisse investment at Saudi National Bank, provided further reasons for the sector’s underperformance this quarter.   

However, if we look beyond the Index’s major sector constituents, the overall market sentiment is clearly bullish. For example, in Saudi Arabia, out of the 229 stocks comprising the Tadawul All-Share Index, 174 stocks generated positive returns in the quarter. In the UAE, IPO activity has been robust and share prices of recent entrants such as Salik Co., Emirates Central Cooling Systems Corp. and ADNOC Gas are well above their offer prices. While the performance divergence between the broader market and the Index is easy to attribute, the magnitude of the divergence (in favour of the former) is noteworthy. It is evident that investors are increasingly reducing their exposure to banks and materials while increasing their exposure to other sectors, such as consumer, healthcare, and technology, where liquidity is relatively less accommodative and therefore prone to larger stock price moves.    

The context is important in partially explaining the strategy’s outperformance in the quarter. The aforementioned dynamics led to meaningful valuation multiples expansion for the strategy’s key portfolio companies. However, we also anticipate a robust earnings growth outlook for many of our core portfolio companies. For example, National Co. for Learning and Education (NCLE), a prominent Saudi K-12 school operator, reported year-on-year revenue and net income growth of 48% and 50%, respectively, in its last quarterly reporting period. Our team spent a day touring various NCLE-operated schools with the CEO in Riyadh and we were thoroughly impressed with the quality of the staff, facilities, and unique culture preserved by management dating back to NCLE’s roots as a family-run enterprise. 

The strategy’s returns also benefited from a sizeable position we have been building in Saudi Telecom Co. (STC), Saudi Arabia’s leading telecommunications provider. Our thesis on STC has been largely driven by valuation, which has been developing since the Public Investment Fund (PIF) offloaded a 6% stake in STC in December 2021. This event stoked fears of future sell-downs in the stock from the PIF, which currently owns 64% of the company. While we cannot be sure that the PIF will not sell more shares of STC in the future, we found that valuations were becoming increasingly attractive for such a dominant business, with free cash flow yields exceeding 10% for 2023. Our thesis received a strong boost from STC collecting nearly $4bn of outstanding receivables from government clients in the fourth quarter of 2022, which represented 8% of its market capitalisation at the time. We met with STC’s management at an investment conference in Dubai and were encouraged by their efforts to improve disclosure and transparency for the investor community.  

As mentioned earlier in the letter, banks have lagged Gulf equity markets. This is a phenomenon that also played out in the strategy, with five of the eight negative return stocks in the quarter coming from the sector. While we have a significant underweight in banks, the strategy’s absolute returns experienced a drag from Saudi and Qatari banks, where pressures on profitability are building up as cost of funds increases at a higher rate than yields on assets.   

The strategy also experienced underperformance in its North African portfolio, and particularly in Egypt, where severe macroeconomic headwinds have overwhelmed USD equity returns. We have been reducing the strategy’s exposure to Egypt over the last year but opted to keep a level of investment in our highest conviction portfolio companies there. 

Looking ahead, we continue to see favourable opportunities for the strategy. The macroeconomic backdrop remains supportive, with healthy FX reserves and balance of payments positions across most of the Gulf. While still early days, the Saudi-Iranian reproachment is a key event that warrants our attention, as any progress there can lead to a lower geopolitical risk premium on regional assets. OPEC+ is committed to maintaining high oil prices to support government spending plans, which could benefit equity markets. We also note that positioning from global emerging market funds remains light and governments in the region are intent on growing their share in the emerging market capitalisation, which we believe will end up manifesting itself in a quasi-short squeeze on those funds.  

The environment is highly dynamic in the region, and as active managers, we are willing to make bold decisions to ensure that the strategy continues to provide investors with attractive opportunities in the MENA region.

Vergent Asset Management LLP

The Chinese economy has bounced back since reopening but the pick-up has arguably been underwhelming. GDP grew at a 9.1% annualised rate in Q1, according to official data, but this partly represents payback for a weak Q4. Growth averaged an unexceptional (by Chinese standards) 5.7% over the two quarters. 

Inflationary pressures remain weak despite the activity rebound. Nominal GDP expansion was only marginally higher than real in Q4 / Q1 combined: the GDP deflator rose by just 0.4% annualised – see chart 1**. 

Chart 1

Chart 1 showing China Nominal & Real GDP (% 2q annualised)

Muted nominal GDP growth has contributed to lacklustre profits, with the IBES China earnings revisions ratio diverging negatively from recent stronger official PMIs, questioning the sustainability of the latter – chart 2. 

Chart 2

Chart 2 showing China NBS Manufacturing PMI New Orders & IBES China Earnings Revisions Ratio

Monthly activity numbers for March were mixed and don’t suggest a pick-up in momentum at quarter-end. Retail sales were a bright spot but strength in industrial output, fixed asset investment and home sales has faded after an initial reopening bounce – chart 3. 

Chart 3

Chart 3 showing China Activity Indicators January 2019 = 100, Own Seasonal Adjustment

Moderate nominal GDP expansion is consistent with recent narrow money trends: six-month growth of true M1 (which corrects the official M1 measure to include household demand deposits) remains range-bound and slightly below its 2010s average – chart 4**. 

Chart 4

Chart 4 showing China Nominal GDP & Narrow / Broad Money (% 6m)

Broad money growth, as the chart shows, is significantly stronger. However, examination of the “credit counterparts” indicates that a rise since late 2021 has been driven mainly by banks switching to deposit funding and reducing other liabilities – domestic credit expansion has been stable. 

The judgement here is to place greater weight on narrow money trends, which currently suggest a moderate recovery that probably requires additional policy support to offset external headwinds. 

*Official unadjusted nominal GDP seasonally adjusted here; GDP deflator derived from comparison with official seasonally adjusted real GDP.

**March true M1 estimated pending release of demand deposits data.

Bamboo forest in Kyoto, Japan.

At Global Alpha we are macro aware but don’t make macro calls. Being macro aware helps us evaluate investment opportunities through the lens of a country’s economic indicators, politics and regulatory landscape. It can also be an important risk management tool, especially in emerging markets.

Macro awareness also comes from understanding a country’s policy choices on its path to success or failure. An exceptionally interesting book called “How Asia Works” by Joe Studwell, provides unique insights into why North Asian countries (Japan, Korea, Taiwan and China) have managed to achieve sustained economic growth while South Asian countries (Thailand, Malaysia, Indonesia and the Philippines) seem to have stalled on their way to economic success. The book answers several questions including:

  • Why successful industrial brands like Haier, TSMC and Hyundai emerged from North Asia and not South Asia.
  • How the Philippines went from being twice as rich as Korea to 11 times poorer in half a century.
  • Lessons that other emerging markets can learn from ones that have experienced growth and success.

The last point is particularly useful to our investment process. If there was a common thread (or formula for success) across North Asian economies, it would be the following.

Step 1 – Small gardens beat large ranches (Land reforms)

This is the crucial initial step, yet also the stage at which most countries falter. Achieving sustained economic growth of 7% to 10% over a significant period requires making tough political decisions, such as redistributing land in a peaceful manner. Following WWII, many North Asian economies were poor and had a surplus of labour in rural areas. However, land ownership was concentrated in the hands of a few wealthy and connected landlords.

The key to unlocking growth in this situation was to peacefully redistribute land from these connected landlords to small rural farmers and peasants. This approach is counterintuitive to what neo-classical economists might recommend, which is to establish massive, mechanized farms to maximize profit per acre. Instead, an intensive gardening approach on a small plot can deliver maximum crop yield.

The effect of this type of reform is that it fully employs the abundant labour available in rural areas. Increased agricultural output leads to sharp increases in purchasing power, waves of consumption and the resources to pay for basic manufacturing technology. Another significant effect of this reform was the social and economic mobility that it enabled, which in turn led to the emergence of a new middle class and a new cohort of entrepreneurs. For instance, the founder of Hyundai (Chung Ju Yung) in Korea and the founder of Formosa Plastics (Wang Yung Ching) in Taiwan were both sons of farmers.

Step 2 – Export or die (Carrot and stick approach to manufacturing)

As agriculture begins to create a new generation of entrepreneurs, returns from agricultural reforms start to taper off after a decade. The challenge then lies in redirecting entrepreneurial energy towards export-oriented manufacturing instead of services. Manufacturing is preferable to services because significant productivity gains can be achieved with low-skilled workers, and manufactured goods are more freely traded across the world.

Where policy differs from the consensus neo-classical approach is in offering protection to domestic manufacturers in the early stages of a country’s development, in the form of subsidies, while keeping international competition out of the domestic market with high tariffs. In exchange for this protection, domestic firms are required to maintain strict “export discipline.” This means that the more a domestic business exports and competes in the international market, the more subsidies and financing it receives.

A positive side effect of this policy is that businesses in North Asia were compelled to rapidly climb the technology learning curve to produce high-quality products. Those that failed to be export competitive were cut off from cheap credit and subsidies and were forced by the government to shut down or merge with successful companies. Instead of picking winners, the government weeded out the losers.

For example, Korea’s government encouraged a dozen conglomerates, including Samsung, Daewoo and Shinjin, to master car manufacturing in a market that was just 30,000 units in size. Vehicle imports were prohibited until 1988 and the import of Japanese cars until 1998, allowing domestic manufacturers to compete for survival. As a result of this policy, a single world-beating colossus in the form of Hyundai-Kia remains.

In contrast, Malaysia decided to master car manufacturing with a single state-owned enterprise (Proton) instead of encouraging private enterprise. With no export discipline or internal development of technology, Proton has mostly found success in the domestic market. In 2022, Proton sold approximately 141,000 cars, while Hyundai Kia sold over 6.8 million.

Step 3 – Targeted finance (Saying no to short-term profits)

The final step is to ensure that domestic financial institutions are fully aligned with the agricultural and industrial policy goals outlined above. Banks are kept under government control via the central bank and “directed” to lend to industrial and agricultural projects that may not necessarily yield the highest short-term returns but have the potential to earn long-term profits by nurturing infant industries. Capital controls are implemented to ensure that citizens’ savings remain in the country to finance national development projects.

The key is to avoid premature deregulation of the financial sector as with what led to the 1997 Asian financial crisis. Deregulation and capital market development as promoted by the World Bank and International Monetary Fund came much later in the industrialization process in Taiwan and Korea. In South Asia, premature deregulation of the financial system led to the issuance of new bank licenses to a cozy group of entrepreneurs who financed their own business activities and short-term speculative investments, like luxury real estate, instead of projects of national importance.

This historic review of North Asian success may seem both contrarian and counterintuitive due to its prescription of financial repression, tariffs and political intervention. However, it helps us at Global Alpha identify countries or sectors that might be on an unconventional path to success. For example, when we were in Vietnam late last year, we couldn’t help but wonder if its combination of an export-driven model and capital controls resembles the Korea or Taiwan of 1970s and 1980s.

Similarly, when Korea announced in 2022 its plans to develop its carbon composite industry as its second steel industry, we saw parallels with how it mastered the art of steelmaking with POSCO, now one of the world’s most efficient steelmakers. In fact, we have exposure to the advanced materials space in Korea through Hansol Chemical (014680 KS), which plans to invest ₩85 billion in silicon anode production as a solution to increasing the energy density of EV batteries while reducing charging time. If history is any guide, we can expect plenty of support from the Korean government to nurture this industry of the future.

Macro awareness can help you succeed

The success of emerging markets isn’t just about individual companies, but also about the broader economic and political context in which they operate. Being macro aware and having a solid understanding of the broader context can help investors make better informed decisions, mitigate potential risks and maximize their returns.

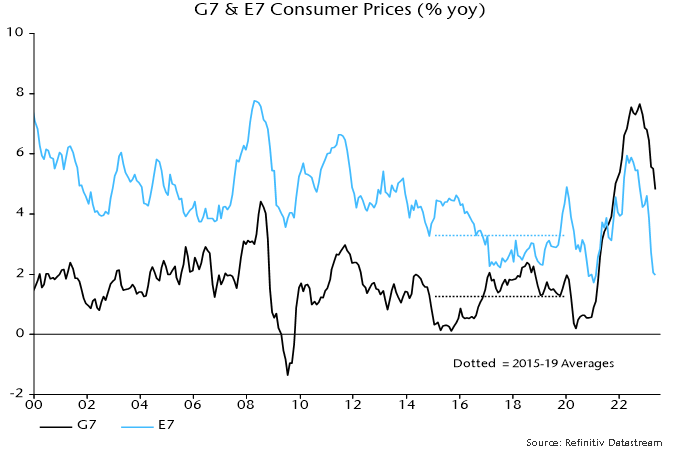
The “monetarist” forecast is that G7 inflation rates will fall dramatically into 2024, mirroring a collapse in nominal money growth in 2021-22.

G7 annual broad money growth returned to its pre-pandemic (2015-19) average of 4.5% in mid-2022. Based on the rule of thumb of a two-year lead, this suggests that annual inflation rates will be around pre-pandemic levels in mid-2024. More recent broad money stagnation signals a likely undershoot.

Pessimists argue that inflation will prove sticky because of high wage growth. Wages are a coincident element of the inflationary process. Low (but rising) wage growth didn’t prevent the 2021-22 inflation surge and high (but moderating) growth isn’t an obstacle to a substantial fall now.

The 2021-22 inflation surge was initially driven by excess demand for goods, due to a combination of covid-related supply disruption, associated precautionary overbuilding of inventories, a spending switch away from services and – most importantly – excessive monetary / fiscal stimulus.

Excess goods demand was reflected in a plunge in the global manufacturing PMI supplier delivery speed index to a record low. This plunge predated the inflation surge by about a year versus a two-year lead from money – see chart 1.

Chart 1

Chart 1 showing G7 Consumer Prices (% yoy), G7 Broad Money (% yoy, lagged 2y) & Global Manufacturing PMI Supplier Delivery Speed (lagged 1y, inverted)

The reverse process is now well-advanced, with supply normalising, firms running down excess inventories, the services spending share rebounding and monetary policies far into overrestrictive territory. The PMI delivery speed index is at its highest level since the depths of the 2008-09 recession, signalling substantial excess goods supply.

Global goods prices are heading into deflation. Chinese reopening has added to excess supply and Asian exporters are already lowering prices in the US – chart 2. Chinese producer prices are falling and the renminbi is competitive, with JP Morgan’s PPI-based real effective rate at its lowest level since 2011. Other Asian currencies are similarly weak.

Chart 2

Chart 2 showing US Import Prices of Goods by Country / Region (% yoy)

The global manufacturing PMI output price index lags and correlates negatively with the delivery speed index. It has plunged from 64 to 53 and is likely to cross below 50 soon. The current prices received balance in the US Philadelphia Fed manufacturing survey turned negative (equivalent to sub-50 in PMI terms) in April, the weakest reading since the 2020 recession.

Global goods deflation will squeeze profits and wage growth in that sector, with knock-on effects on services demand, pay pressures and pricing.

Central bankers are once again asleep at the wheel, pursuing procyclical polices that amplify economic volatility and impose unnecessary costs.

Chhatrapati Shivaji Terminus Railway Station in Mumbai, India.

As we approach the second anniversary of our Emerging Markets Small Cap Fund, our team has been actively discussing investment ideas across 24 countries. In Global Alpha, we follow a well-established investment process, similar to our strategies in developed markets. We believe that complementing our analysis with on-the-ground visits to our holdings and prospects, including factories and other sites, is essential. These visits allow us to enhance our investment thesis and validate or revise our perspectives. In this note, we highlight the main takeaways from our recent trip to Asia and provide some examples of how we incorporate our findings into our portfolio.

During our visit to Mumbai, India, we had the privilege of conducting close to 30 one-on-one meetings and attending a local conference. Two things immediately stood out. First, the heavy traffic, cars honking and bustling crowds signaled a high level of activity, with no signs of recession. Despite potential consumption deceleration during a downturn, the sheer size of the population helps ensure that activity continues.

Second, every company we met with signaled strong, double-digit growth for at least the next three years. This common mindset among the companies we met was striking and seemed almost psychological. None of them anticipated a slowdown in fiscal year 2024. When companies share a common optimistic outlook that deviates from consensus, it often becomes a self-fulfilling prophecy. Each company we visited had a medium-term mindset, with growth as their main focus.

India currently comprises approximately 20% of our Index, making it the second most important country after Taiwan. Valuations of India-based companies have been a challenge for us, as many of the quality players are expensive. However, we believe that investing in India is more for long-term structural growth and our recent visit provided confirmation of this perspective. For example, we visited one of the largest real estate projects in India called Thane, developed by the company Oberoi. Seeing the dimensions of the project in person rather than just in a presentation was illuminating and provided us with new perspective. Another example is the Mulund project of Prestige, one of the company’s flagship developments. Prestige (PEPL IN) is a company we currently own in our portfolio. Over the last decade, the Prestige Group has firmly established itself as one of the leading and most successful developers of real estate in India across all asset classes. The company is based in Bangalore and recently entered Mumbai with better than expected results.

Prestige Group development

In India, we also visited one of our most significant portfolio holdings, CreditAccess Grameen (CREDAG: Natl India). CREDAG is the largest non-banking finance company/microfinance institution (NBFC-MFI) in India with consolidated AUM of approximately INR150 billion, indicating an industry market share of over 5% (16.3% within NBFC-MFI) and a recorded 52% assets under management (AUM) CAGR over fiscal year 2014-2022, with a strong presence in Karnataka, Maharashtra and Tamil Nadu.

The company is a market leader in an underpenetrated business with immense, multi-year growth potential. Driven by its strong management and track record, the company is in a privileged position to capture India’s secular trend of the emerging low-middle-class population. Moreover, there is a massive underpenetration of MFIs in rural areas where CREDAG has its largest AUM. CREDAG maintains strong returns on equity driven by a low cost of risk. There was also a spread cap for this business that was recently removed, creating larger opportunities for the company. In this case, we also received confirmation from the management expecting growth. Their expectations are to increase its AUM by at least 20% for the next three years, driven by strong demand from the rural population and underpenetration. It’s different to understand the drivers of that growth in a lengthy face-to-face meeting than just over a Zoom call. We incorporated all the inputs in our model.

As explained in our previous weekly note, we visited Indonesia, where we took advantage of the opportunity to see the willingness of authorities to attract foreign investors. In another recent weekly note, we highlighted our approach to choosing companies and our preference for Mitra Adrapekasa (MAPI), our top pick in Indonesia. We visited MAPI’s top management and got validation about their significant growth potential. It was a reassuring confirmation check for us. As part of our process, we need to know the management of our core holdings and hear their strategy in person. Thus, this meeting was useful to maintain our conviction in this position, as explained in our previous weekly note. Our main takeaway is that the company is poised for strong top-line growth with sound profitability for many years.

These visits are also relevant to challenge the management teams of our holdings. For example, we own Prodia (PRDA: IJ), Indonesia’s biggest independent lab. The company is a market leader in an underpenetrated business with significant growth potential for many years. Current market share is about 40%. Prodia enjoys superior unit economics, strong returns and profitability indicators. Nevertheless, PRDA maintains conservative top-line growth at high single digits.

The company meets all the criteria in our process with the only caveat being its lack of top-line growth. So we challenged its management team, comparing their situation with other lab companies we own (such as Integrated Diagnostics Holdings (IDHC LN) in Egypt). Indonesia is a huge country with 300 million people with a vastly underpenetrated healthcare system. We should expect the company to grow at double digits. We also mentioned the case of Fleury (FLRY3 BZ) when we were in Brazil, where the growth is higher with a similar population. Management was receptive to our comments and we could understand from them more about their reasoning and intention to grow more aggressively (while maintaining profitability) in the future. Its interesting because we’ve never had the chance to go deep into that conversation by Zoom. There is nothing wrong, indeed it adds a lot of value, to question some strategies of our holdings in-person with them. It helps us understand their view and incorporate their decision-making into our process. Its also useful for us as investors to provide our portfolio companies with feedback and identify opportunities for improvement.

Detailed tests in Prodia.
Prodia lab entrance.

We also had the opportunity to visit Thailand and gain insights into the country’s small-cap companies. Many of these companies are known for their conservative approach to growth, which may not always be a bad sign if they manage risks efficiently. Being on the ground allowed us to understand how the culture drives this conservative approach in various aspects, which is something we can only fully appreciate through firsthand experience.

During our visit, we met with eight companies as well as strategists and representatives from non-listed companies. Thailand is experiencing a significant influx of tourists, which contributes to around 20% of its GDP and is relevant for economic recovery across different sectors, such as consumer, banking and industrials.

In our portfolio, we own two stocks in Thailand, with Chularat Hospital PCL (CHG) being one of the highlights. CHG operates a network of nine mid-end hospitals and four clinics throughout Eastern Thailand. Its network consists of three hub hospitals (Chularat 3, 9 and 11) and 10 smaller hospitals and clinics serving nearby provinces with high concentrations of industrial zones and dense populations. CHG is well-known for its expertise in cardiology and microsurgery and is the sole operator of a heart center in the Eastern region. As such, CHG has become the main referral center for both Social Security Office (SSO) and National Health Security Office (NHSO) programs in the area. CHG is one of the leading regional hospital networks catering to the Thai middle class, with a well-balanced patient base consisting of 59% cash and 41% government program patients.

We visited one of its hospitals (Hospital 3) and were impressed with its cleanliness, spaciousness and organization, with specialized centers within the hospital. Notably, there was a dedicated floor for UAE patients. CHG stands out as one of the few companies in the Thai market that is growing faster than the overall market with good margins and a clear growth strategy. Visiting one of its main facilities allowed us to see firsthand how the company treats and manages their speciality centers, which are well developed in the country. In one of the following photos, we captured the amazing work they do in hand and finger recovery at one of their specialty centers.

Chularat Hospital 3 entrance. 
Specialist center.

During our next country visit to Korea, we spent a whole week visiting close to 30 companies. Overall, our impression was positive although it wasn’t easy to find many ideas because Korea’s small-cap market is mostly linked to memory and EV battery materials. We visited companies we already own, such as Hansol Chemical (014680 KS)and Leeno Industrial (058470 KS), but the message wasn’t very positive as inventory levels were still high and demand was weak.

We also visited other companies that we don’t own but are monitoring closely, such as Tokai Carbon Korea (064760 KS) whose CFO explicitly stated that the company expected the memory market to recover in the second half of 2023 but remain complicated throughout the whole year. We understand that we don’t have to get a positive message from every company we visit and our main job is to incorporate the inputs we receive wisely. So, we took a conservative approach in the material memory names we own and postponed the initiation of some prospects based on feedback during the visits. The beauty of being with the companies in person is that we could understand from different sources on the ground what was really happening, which served as confirmation of what we had read and discussed internally.

We also visited some companies related to EV battery materials, particularly silicon anode technology, which is intended to improve battery life cycle (carbon) and energy density (in the form of oxide). Currently, silicon anode is mixed in small percentages (4% to 8%) with graphite as higher percentages (92% to 96%) cause the battery to swell. However, battery cell makers in Korea have been positive about their ongoing technology of increasing the silicon anode composition to around 15% in a couple of years. If this is achievable it could have a strong multiplier effect driven by the increase of EV sales and the higher penetration of silicon anode. Companies like Daejoo Electronic Materials (078600 KS) are aiming to have more than a million cars adopting this technology by the end of 2023, with Porsche Taycan and some models of GM being among the end clients of battery cell maker, LG Chem. There was also news that Hyundai could be starting to adopt this technology. However, it is difficult to estimate the exact number of cars that will adopt silicon anode oxide (with Daejoo) and the penetration rate.

In this regard, we think that the current rally of pure EV battery materials stocks in Korea has gone a little too far, with too much optimism for 2025-2026 onwards, where profits are still uncertain. In our portfolio, we have two companies, SKC (011790) and Hansol Chemical, that are developing (not commercialized yet) silicon anode carbon, so we feel we can indirectly participate in this technology from 2024-2025 onward. Both companies are more diversified and have other businesses, starting with silicon anode (Daejoo started to commercialize it in 2019).

One of the main takeaways from our visit to Korea is that we met a company we were researching before the trip, and got confirmation about our positive view, leading us to invest. This case is quite interesting because the company is only covered by Korean sell-side analysts, most of the information was in Korean and there was not a lot of disclosure. Nevertheless, we always found the company quite interesting and we continued our due diligence because it fit in our investment process, which we confirmed during our in-person visit.

The company is Park Systems (140860 KS), which was established in 1997 as an Atomic Force Microscope (AFM) manufacturer/supplier for academic research labs and corporate clients. AFM can observe ultra-fine structures that cannot be measured with an electron microscope with high resolution and it has future applications in industries such as new materials, energy, environment, biotech and medical diagnosis. There are several things we like about Park Systems, including its technological leadership, innovative technology that remains far ahead in accuracy and precision with IP protection, integration of hardware and easy-to-use software that stores and analyzes results, shortening training time, and its solid balance sheet, growth profile and capital allocation.

The company also has several opportunities to continue growing, such as expansion into the display products industry and launching new products for industrial AFM. We also had a very good impression of its senior management regarding their experience, industry knowledge and intentions to grow the business.

Park Systems building entrance, Seoul.

Lastly, we visited the Philippines, a country with a population of 100 million people and a young demographic. The Philippines also has abundant nickel reserves, which got us excited about potential investment opportunities in the downstream sector.

During our trip, we came across one of the most exciting stories in Indonesia, which is Nickel Asia (NIKL PM). NIKL is positioned as an EV battery play, with equity in net income from investments in two high-pressure acid leach (HPAL) plants, Taganito and Coral Bay. Looking ahead, NIKL will also be the exclusive contractor of the huge Pujada mine with a possible third HPAL plant.[1]

However, considering the young demographics, vast population and emerging middle class, we tend to favour the consumer sector. We only had one holding in the Philippines and a couple of weeks before the trip, there was a corporate event that raised questions for minority shareholders. We didn’t want to make decisions without understanding management’s view, so we took advantage of the trip to ask them directly. We were not satisfied with their response, as they literally said, “if you want to invest in us, you have our assets and these events, it’s all in the soup.” With that answer, our investment process quickly came into place and we decided to sell our position. As we have mentioned in previous examples, these trips are useful not only to confirm positive aspects but also to identify red flags more easily when you have an ongoing in-person relationship with the company.

During our visit to the Philippines we also explored other alternatives in the consumer space and will be keeping an eye on them. The country offers a wide range of opportunities and things are improving compared to previous years.

The Global Alpha emerging markets small-cap team will continue to be on the ground, integrating our on-site views with our investment process and daily analysis of prospective companies that could be included in our portfolio, as well as monitoring those we already have.


[1] Source: CLSA research.

US February job openings were 17% below their March 2022 peak. Historically, a decline of this magnitude in vacancies – job openings or, for earlier years, help-wanted advertising – was always associated with a payrolls recession. 

Job openings numbers are available back to 2000. Regis Barnichon, now at the San Francisco Fed, constructed a proxy series – composite help-wanted advertising – for earlier decades. The Barnichon series adjusts historical data on newspaper advertising for a rising share of online job postings, modelled by an S-curve. 

The official and Barnichon series (which is no longer updated) can be spliced together to create a continuous vacancies series extending back to the early 1950s, a period encompassing 11 recessions involving sustained payrolls declines – see chart 1. 

Chart 1

Chart 1 showing US Non-Farm Payrolls & Job Openings / Help-Wanted

Every payrolls decline was preceded by a fall in vacancies but several vacancies declines were followed by slowdowns in payrolls rather than outright weakness (e.g. 1966). 

A sufficient condition for a payrolls recession was a fall of more than 15% in vacancies from their peak level in the latest 12 months – chart 2. This condition was met in February job openings numbers released last week. 

Chart 2

Chart 2 showing US Non-Farm Payrolls & Deviation of Job Openings / Help-Wanted from 12m High

Historically, the 15% threshold was reached around the time that payrolls started to decline. In six of the 11 cases, payrolls had already peaked, although this was not always known at the time. 

As an example, current data show a 1974 payrolls decline beginning in August, one month before the vacancies fall reached the 15% trigger. In real-time data, however, a payrolls peak was delayed until October.

Man looking ahead at the Shanghai skyline.

Summary

  • Emerging market equities notched a positive month despite the fears over cracks appearing in developed market banking systems with the failure of Signature Bank, Silicon Valley Bank and the UBS takeover of Credit Suisse.
  • Chinese equities steadied in March, slightly up as the two sessions (China’s equivalent of parliament) rubber stamped Xi’s unprecedented third term as leader, and Li Qiang’s ascent to the role of Premier. Li was keen to tout China’s business-friendly credentials in his first remarks as premier.
  • This was followed later in the month by Jack Ma’s return to Hangzhou, China, the home of Alibaba HQ. This was followed shortly after by an announcement by the company that it would be split into six units. According to Alibaba CEO Daniel Zhang, the units will be able to “pursue independent fundraising and IPOs when they are ready.”
  • This provided a major boost to large cap Chinese tech stocks, with investors interpreting the announcement as further confirmation that regulatory headwinds for the sector were easing.
  • Portfolio names Alibaba, Tencent and Netease all rallied sharply.
  • Stocks in Taiwan and South Korea were stronger, in part due to some optimism that the deep downcycle across the semiconductor industry is starting to bottom.
  • Brazil underperformed wider emerging markets. Despite falling inflation and scope for the central bank to consider rate cuts, political risks continue to curb investor enthusiasm. President Lula’s scepticism of central bank independence and a free spending fiscal agenda are key concerns which muddle a potentially compelling opportunity for investors.
  • Gulf markets were weak, as headwinds build for energy prices and other commodities given the deteriorating global economic outlook.

Navigating booms and busts in China

Given the wide dispersion of country returns in emerging market equities each year, we know that outperformance hinges on finding the right stock in the right country. As the below chart illustrates, great stock fundamentals can be wiped out by poor macro.

Dispersion of EM country returns

Chart 1: Emerging market returns by country from 2004 to 2022.
Source: Thomson Datastream.

The opportunity to gain exposure to high-quality companies operating in an economy delivering structural outperformance – such as India at present – is a key attraction of emerging market equities. However, experience teaches us that it is through avoiding big negative macro shocks in EM that we can sustainably tilt the odds in our favour.

Our approach to country analysis centres on two elements: 1) hard data inputs with monetary aggregates at the heart of this; and 2) qualitative macro analysis incorporating an assessment of shorter-term factors such as political risk and longer-term structural factors like institutional quality.

This piece will focus on the quantitative element, and specifically the role that the Liquidity Theory of Asset Prices plays in country selection.

Emerging markets and the Liquidity Theory of Asset Prices

Analysis of monetary (or liquidity) data is a key input in our process for determining country weightings. This is based on the insight that, while we know that monetary trends lead the economy, “excess” money – the difference between the growth of real money supply and industrial output – moves markets even earlier. Broadly speaking, when narrow money is growing above industrial production, you are probably in a bull market somewhere as money not put to use in the real economy finds its way into bonds, stocks, property and other assets. The reverse also applies, with current weakness in financial markets reflecting a deteriorating liquidity picture as hot inflation and tight monetary policy suck money out of markets.

G7 + E7 industrial output & real narrow money (% 6m)

Chart 2: Graph showing G7 and E7 industrial output relative to real narrow money from 2000 to 2022.
Source: Thomson Datastream.

Applying Liquidity Theory in EM equities

We have found this to be a powerful leading indicator and tool for assessing the optimal country exposure through economic and market cycles. In emerging markets this works particularly well as we analyse liquidity country by country in a wide and diverse opportunity set.

Over the decades our team has compiled data on the sensitivity of individual countries in EM to varying liquidity environments. This helps us gauge whether the tide is coming out or in for a country’s financial markets. While this data provides signals for which markets might be winners over the medium term, we find that it adds the most value in providing warning signs of vulnerabilities that precipitate market shocks. You do not want to be around in a country like Argentina or Turkey when the liquidity tap shuts off.

Key input for managing China exposure

Liquidity analysis has been central to managing our portfolio exposure in China. As the chart illustrates below, observing the change in real narrow money growth is a key input for anticipating periods of out- or underperformance for the largest component of the EM benchmark. This is married up with qualitative macroeconomic research and in-depth economic value added stock analysis to determine exposure that aligns with our level of conviction.

MSCI China price index relative to MSCI EM & NS Partners’ active weight in China + Hong Kong

Chart 3: MSCI China Price Index relative to MSCI Emerging Markets Index and NS Partners’ active weight in China and Hong Kong from 2014 to 2022.
Source: Thomson Datastream.

Successfully navigating the violent boom and bust of Chinese equities from 2014 through to mid-2016 demonstrates the effectiveness of this approach. Improving narrow money through the beginning of 2014 preceded a lift in exposure to China as the market began to outperform. Conversely, money numbers deteriorated from mid-2014, a warning sign that the rally was on borrowed time. This formed part of our decision to begin cutting exposure ahead of the market peak in June 2015. Highly leveraged retail investors had fuelled the final euphoric stages of the rally. News of a softening economy saw sentiment for Chinese equities wane, with initial modest stock declines triggering a wave of margin calls that precipitated a frenzied sell-off.

CSI 300 index (rebased to 100)

Chart 4: CSI 300 Index performance from 2014 to 2016.
Source: Bloomberg.

Fearing the slump would trigger a major financial crisis, Chinese authorities stepped in to introduce short selling bans and stock “circuit breakers”, while loosening margin requirements to allay fears of further defaults. Lock-up periods were enforced for owners of more than 5% of a company’s tradeable stock, and mutual funds and pension funds were compelled to support the market. Critically, the PBoC stepped in to slash rates, providing a significant boost to money numbers. Sentiment remained fragile through the beginning of 2016 with investors concerned about the ability of Beijing to rebalance a structurally slowing economy with bad debts without triggering capital flight. We were more constructive than consensus and gradually lifted exposure to overweight, encouraged by money numbers signalling a stronger economy ahead and judging that authorities had the tools to keep forex and balance of payments risks in check.

More recently, having been significantly underweight through the brutal selloff in Chinese equities in 2021, we began lifting exposure at the end of that year in response to improving liquidity data, reaching a neutral weight by the middle of 2022. This was subsequently raised to overweight later in the year as money numbers improved further, some political headwinds eased and Beijing’s COVID-zero approach to the pandemic was rapidly abandoned. The weighting shift provided a boost to portfolio performance as Chinese equities rallied hard on the “reopening trade”.

CSI 300 & HSI index (rebased to 100)

Chart 5: CSI 300 and HSI Index performance from 2018 to 2022.
Source: Bloomberg.

Looking ahead, we remain modestly bullish on Chinese equities but believe that current monetary trends signal that the authorities are determined to avoid overstimulating and sparking a Western-style inflation surge, which would risk social disruption. This should support a gradual but more sustainable economic recovery favouring quality names, as opposed to more cyclical parts of the market and derivative plays in materials and energy. 

As outlined above, in addition to quantitative inputs to our process, we also consider shorter term political risks along with longer term measures of institutional quality. China faces major challenges on both of these fronts as the Sino-U.S. dispute intensifies and as Xi Jinping consolidates power at the expense of the intra-party pluralism established under Deng Xiaoping. It means that while a monetary and economic recovery provides a supportive backdrop, our qualitative assessment of political and policy risks limits our conviction and consequent portfolio exposure to China.