Canadian investors have long leaned toward homegrown stocks, giving Canadian equities a bigger slice of their portfolios than global equity benchmarks suggest. Notwithstanding the strong performance of the Canadian equity market in 2025, the recent surge in US markets – fuelled by the rise of the “Magnificent Seven” technology giants – has some investors rethinking this approach. Canadian investors have a similar home-country bias as some of their global peers. While some investors may go all-in on global equities, there are several advantages for having a Canadian-equity bias.
Home-country bias
Home-country bias refers to building an investment portfolio instinctively favouring stocks from your own country, which is a tendency shared by investors worldwide. Although Canadian stocks represent just 3% to 4% of world equity markets, the comfort of the familiar leads to a much larger role in equity portfolios. It is common for Canadian investors to allocate 20% to 40% of their total equity exposure to domestic equities.
Many investors globally allocate far more in local equities than their country’s actual slice of the global market. According to the WTW Thinking Ahead Institute’s Global Pension Assets Study 2025, this bias has been especially strong for Australian, Japanese and UK pension investors that allocate 20% to 45% of their total equity exposure to homegrown companies. While US pension investors typically have the largest domestic percentage allocation, it generally reflects the US market’s large representation of the global market.
The case for a home-country bias versus a more global market capitalization approach often wrestles with similar challenges, like the impact of certain sector concentration. However, each approach offers a unique lens on how to manage risk and opportunity.
Features of the different approaches
The table highlights the features of the different approaches to managing total equity assets.
|
Canadian-equity bias |
Global equity only |
| Currency |
Investing in assets denominated in Canadian dollars allows institutional investors, such as pension plans, endowments and foundations, to sidestep currency risk. This ensures that asset values move in step with liabilities, eliminating valuation fluctuations caused by currency mismatches. |
Investing globally is not just about geography; it is about currency too. Global equities provide exposure to multiple currencies, offering a natural hedge if the Canadian dollar takes a hit during global downturns or commodity slumps. |
| Index features |
Canada’s equity market stands out globally with its concentration in resources and financials, which gives it a unique risk-return profile. During commodity booms, for example, Canadian equities can offer diversification benefits relative to global markets. |
From a sector perspective, the global market is more heavily weighted to growth sector opportunities, such as information technology and health-care sectors compared to Canada. |
| Diversification |
While Canada’s market is smaller and more concentrated, leading to higher return volatility, it can strengthen total equity returns when paired with global equities by adding a layer of diversification. |
Diversifying globally helps avoid putting all your eggs in one equity basket. Depending on the global index adopted, it provides access to many developed and emerging market countries. |
| Alpha potential |
Added value potential from active management has been more consistent for Canadian equities compared to global equities, providing an important additional source of return. |
Active management within global equity portfolios has delivered added value, notwithstanding the recent headwinds due to the robust performance of technology-related companies. |
Why have a Canadian-equity bias?
Portfolios with a Canadian-equity bias provide the opportunity to unlock better risk-adjusted total equity returns compared to global only, they have the benefit of more consistent added value potential from active management, as well as a supportive economic backdrop in Canada that amplifies its growth potential.
Return perspective
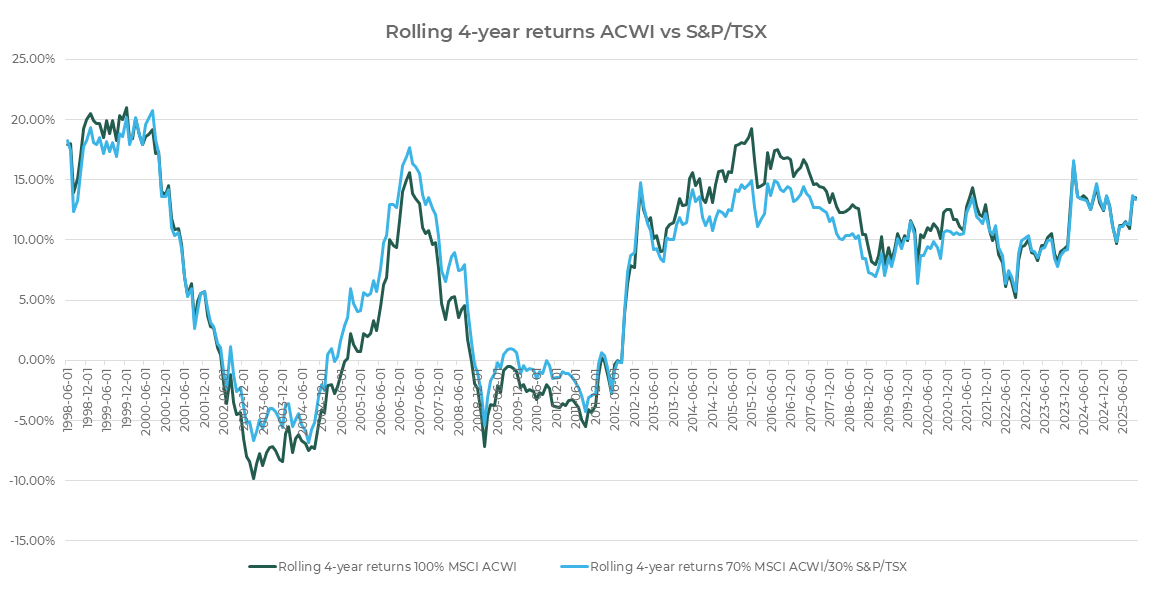
Analyzing relative historical performance of Canadian equities (S&P/TSX Index) versus the major global equity indices (MSCI ACWI Index and MSCI World Index), highlights the resilience and benefits that a Canadian equity bias can bring. While global indices often steal the spotlight, there is no clear, consistent winner. Except for the most recent decade, Canadian equities have outpaced their global counterparts over extended periods, when measured in rolling four-year returns and in Canadian-dollar terms for the global indices (figure 1). While the headlines focus on the “Magnificent Seven” powering US and global equity gains, Canadian equities have quietly matched global equity performance over the more recent rolling four-year periods.
Figure 1 – Global equity versus Canadian equity index returns
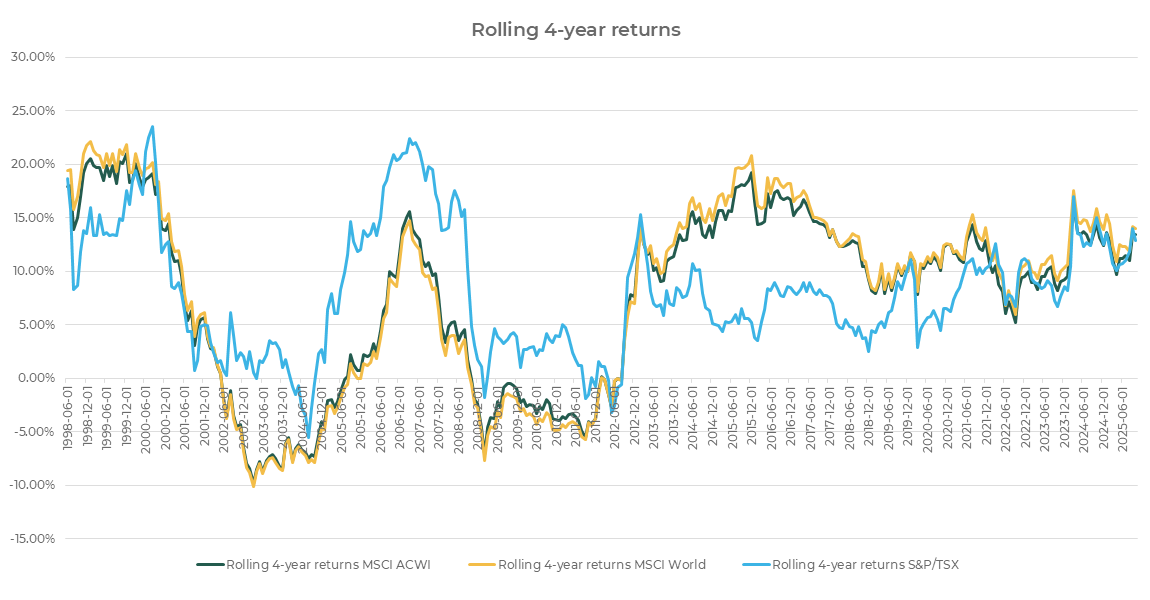
Source: MSCI, FTSE and Bloomberg
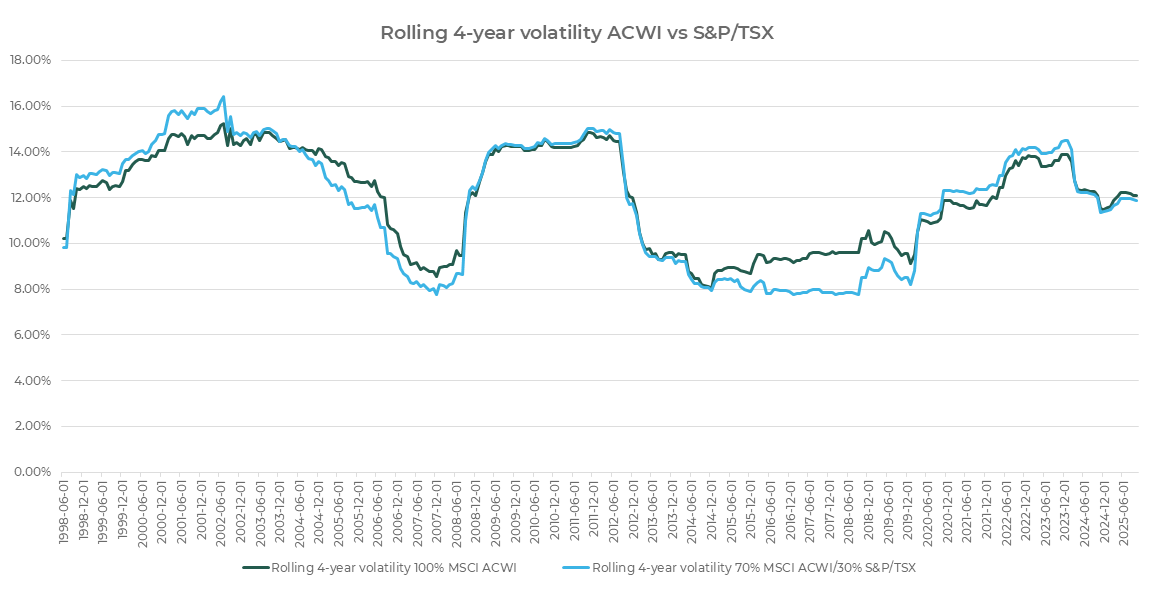
When analyzing the volatility of Canadian and global equity indices, the story is a little clearer, with Canadian equities generally being more volatile than unhedged global equities (figure 2). This experience is consistent with the more concentrated Canadian market compared to the global equity market.
Figure 2 – Global equity versus Canadian equity volatility of index returns

Source: MSCI, FTSE and Bloomberg
But here is the twist: portfolios that have a tilt toward Canadian stocks, more than their market capitalization weighting would suggest, have generally experienced lower overall volatility than a purely global portfolio, as illustrated for a portfolio invested 70% in global equities (MSCI ACWI Index) and 30% in Canadian equities (figure 3). When also considering the rolling four-year return experience (figure 4), it implies stronger risk-adjusted returns for a home-country bias.
Figure 3 – Global equity versus home-country bias global equity volatility of index returns
Source: MSCI, FTSE and Bloomberg
Figure 4 – Global equity versus home-country bias global equity index returns
Source: MSCI, FTSE and Bloomberg
Alpha potential
Active management offers the potential of an additional source of return. While the influence of technology-related stocks has recently implied headwinds for active managers in general, Canadian equity managers have on average provided more consistent added value over time compared to global equity managers (figure 5).
Figure 5 – Canadian versus global equity median added value
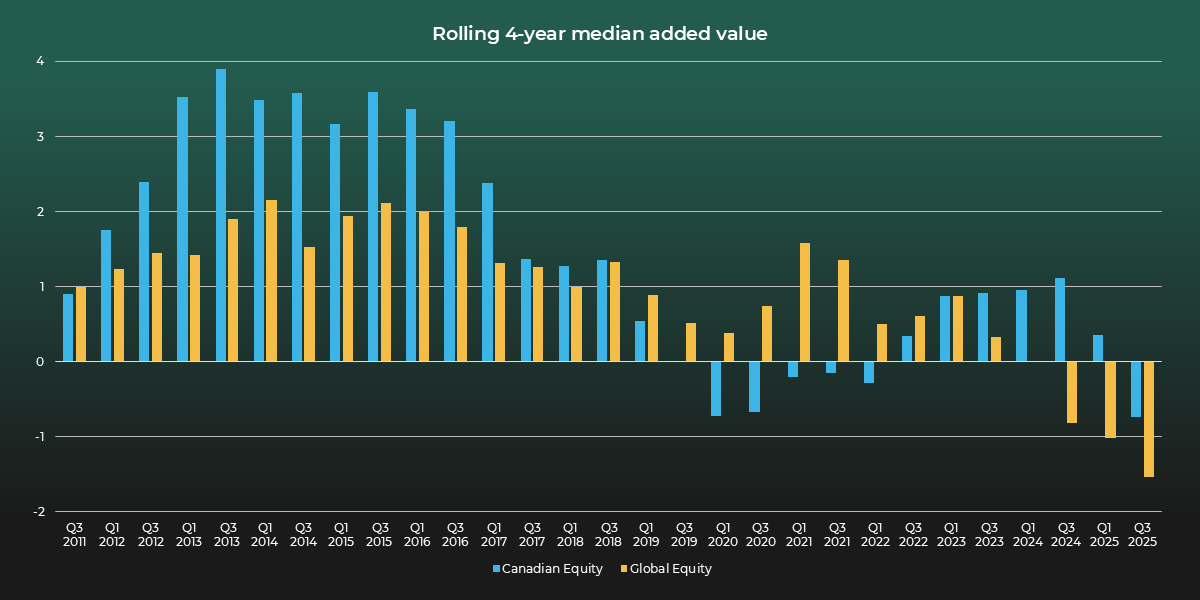
Note: Based on manager universe with MSCI ACWI Index benchmark for global equities.
Source: eVestment, Connor, Clark & Lunn Financial Group.
Current economic backdrop
Canada is positioned to deliver both value and growth for investors. The country is stepping confidently into a new era of economic growth, powered by a pro-business agenda. Under Prime Minister Mark Carney, the country is embracing reforms that break down interprovincial trade barriers, streamline regulations and fast-track resource and infrastructure development. Policy moves, like easing the carbon tax, signal a broader commitment to making Canada a more attractive place to do business. At the same time, the Bank of Canada’s aggressive interest rate cuts and a government focused on fiscal stimulus are working in tandem to ignite domestic growth.
Canada’s rich reserves of future-critical commodities, such as copper, uranium, gold, rare earths and natural gas, are set to play a pivotal role in the global energy transition. For example, the introduction of new liquified natural gas export terminals on the West Coast is opening the doors to Asian markets. The country’s banking sector, renowned for its stability and strong regulations, adds another layer of resilience in an unpredictable world.
Benefiting from local strengths and global opportunities
While global equities provide broad investment opportunities, a Canadian bias in total equity allocations offers strategic advantages, especially for investors seeking currency alignment, unique market exposure, greater active management contribution, as well as more efficient risk management. An optimal approach to total equity portfolio structure is a thoughtful blend of both Canadian equity and global equity that incorporates an element of home-country bias.