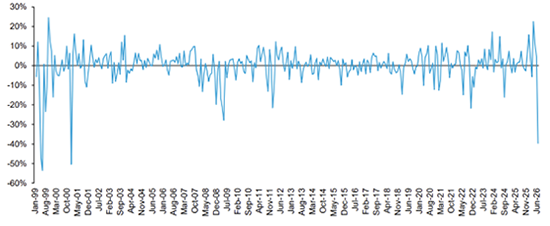
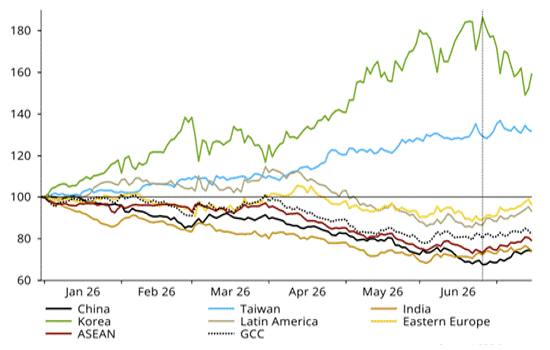
International equity markets fully recovered their March losses and made significant gains over the quarter as investors focused on AI driven earnings growth rather than the unstable geopolitical backdrop and volatile oil prices. The MSCI EAFE index returned 11.6% in local currency terms and 10.8% in US dollars. IT rose 55% as the scale of AI investment was reflected in strong demand and pricing across the AI infrastructure complex including semiconductors, hardware and equipment. The worst performing sector was energy, down 17.2%, reversing the gains made in Q1.

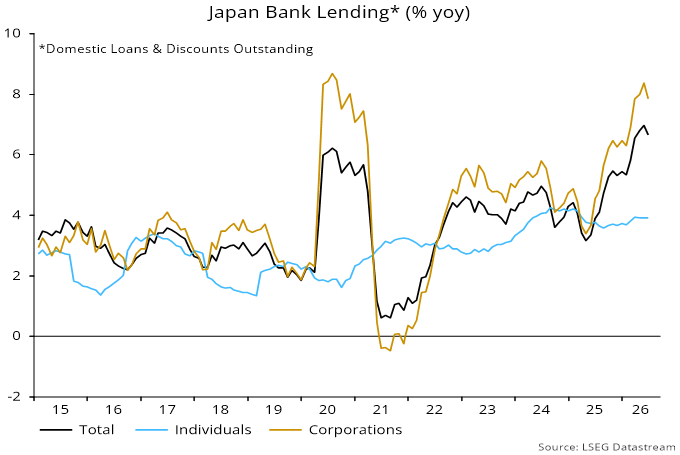
New Federal Reserve Chair Kevin Warsh has inherited a solid US economy currently enjoying a growth boost from the enormous capex on AI compute. Our analysis suggests a rate rise is justified in the US but is not necessary in the Eurozone, the UK or Japan, where money growth is much weaker. Inflation pressures globally should remain contained and we expect the economy to slow in the second half of the year. In the UK, Prime Minister Keir Starmer has accepted the inevitable and resigned after his main rival for the leadership of the Labour Party, Andy Burnham, returned to parliament by winning a by-election. Favoured by the membership and less unpopular with the wider public Burnham was highly likely to win any leadership contest with the much-maligned Starmer.

The dominant feature in stock markets remains AI with day to day moves seemingly binary between ‘AI on’ days, when stocks related to AI infrastructure spending perform well while the perceived disrupted names suffer, and alternative ‘off’ days, when the disrupted recover and the infrastructure names decline. Examples of the potentially disrupted can be found in software, business and professional services, data vendors and IT services and outsourcing. Infrastructure winners include semiconductors and their equipment makers, data centre related businesses, power generation and electrical equipment, cooling, networking and optical equipment, and some automation companies. Leadership within the infrastructure group shifts with perceptions of where bottlenecks might develop. More neutral areas include banks, which stand to gain from cost savings but may be disrupted, along with healthcare and staples, although the latter has been negatively impacted by GLP1 weight loss drugs. Headline volatility for the whole market remains subdued but the divergence of returns between subsectors is, in some cases, extreme.

Portfolio relative performance was better in Q2 with added value from stock and sector selection and a positive impact from emerging market exposure. The overweight in IT was a significant contributor with Japanese stocks such as Murata Manufacturing (+233%), and Screen (+98%) making substantial gains while unowned German software giant SAP (-6%) fell, although we re-introduced the stock late in the quarter. Other AI related holdings include Australian real estate play Goodman and Hong Kong listed power tools maker Techtronic (+30%) – both are seen as beneficiaries of high demand for data centres, with the latter also boosted by spending on infrastructure and energy projects.

In communications conglomerate Softbank is the AI play of choice in Japan, reflecting its 86% holding in UK chip designer Arm and roughly 13% stake in OpenAI acquired in return for a commitment to invest $65bn. Not owning Deutsche Telecom was also a positive as telecoms came under pressure from the competitive threat posed by SpaceX’s Starlink offering. In financials the strength of the Spanish economy continues to support Caixabank (+27%), which raised guidance over the quarter, while UK-listed Asian focused bank Standard Chartered (+34%) has been benefiting from stronger earnings growth partly due to improved cost efficiencies.

On the downside some unowned IT stocks posted big positive moves such as German chip maker Infineon (+117%), Japanese IT bellwether Tokyo Electron (+106%) and flash memory card maker Kioxia (+368%). In financials the London Stock Exchange continues to suffer from concerns that generative AI could weaken the value of financial data terminals and analytics platforms, while in healthcare unowned Novo Nordisk (+37%) recovered on an easing of supply constraints and signs that oral obesity treatments are stabilising the company’s market share in the US. More defensive stocks such as East Japan Railway (-7%) and food retailer Kobe Bussan (-24%) tended to lag the market, with the latter also hit by a poorly received acquisition of an airline catering business with few obvious synergies. In an underperforming Hong Kong, casino operator Sands China (-17%) suffered from continued weakness in Chinese consumer trends while insurer AIA (-13%) was impacted – unfairly in our view – by recent Chinese regulatory actions aimed at clamping down on online brokers and offshore securities sales.

Activity over the quarter has raised exposure to IT, consumer discretionary and industrials with reductions in energy, materials and utilities. In Japan, we have introduced Murata Manufacturing, which is no longer simply a smartphone component supplier, now representing a leveraged play on AI infrastructure, data centres and vehicle electrification. We have also added Lasertec, which is effectively the only meaningful supplier of EUV photomask inspection systems. In industrials we have bought Italian cable specialist Prysmian, which will benefit from renewable energy build-out driven by electrification of transport and industry, as well as the installation of new interconnectors between countries and data-centre power requirements. We have also added building equipment company Belimo and valve specialist VAT, both in Switzerland. The former provides critical flow control and HVAC components for liquid cooling systems in hyperscale AI data centres, while the latter manufactures high-precision vacuum valves used in semiconductor fabrication equipment and benefits from rising chip complexity.

In consumer discretionary we have re-introduced Sony, which has lagged the recent strength in the Japanese market, and UK food services company Compass – the US business is exceptionally strong and margins are recovering back to historic levels. On the sell side we have taken some profits in miner Rio and exited engineer Weir Group in industrials. Other disposals include Thales, reflecting a loss of momentum of the defence buy case, and Kone, where weak China new-build remains an overhang. In utilities we have exited SSE in the UK after the stock re-rated and sold Sartorius in healthcare, where a recovery in sales after customer de-stocking is taking much longer than expected.

The portfolio remains focused on broad exposure to the different layers of the ‘AI stack’ with the current emphasis on semiconductors and manufacturing, infrastructure and energy and smaller exposure to models and applications. We are net overweight the theme, acknowledging that in the longer term the applications area may be the best place to be but focusing for now on where the money is being spent. This approach leads us to be overweight IT, real estate, communications and industrials while also liking healthcare for its defensive qualities. Financials are an underweight, with a preference for banks over insurance and services. Our emerging market checklist is still net positive but we are mindful of the strength year to date and the dominance of the tech heavy Taiwanese and Korean markets. The focus is on companies with continued positive earnings revisions as markets have already experienced strong profit upgrades and may be vulnerable to a weaker second half economic and liquidity backdrop.

The Composite rose by 13.7% (13.54% Net) versus a 10.82% rise for the benchmark.

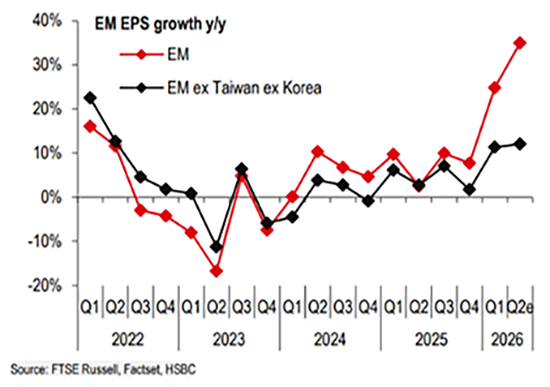
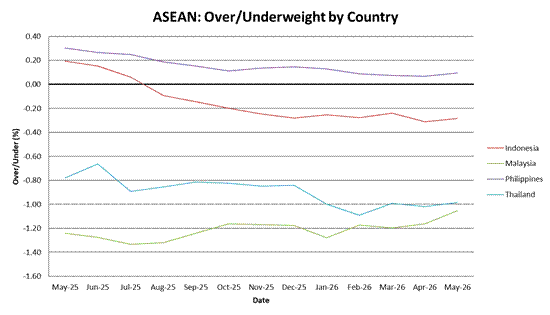
Emerging markets shrugged off concerns over the US-Iran conflict during the second quarter to focus on the AI picks and shovels earnings boom. The quarter caps a strong period for EM equities, nearly doubling since the beginning of 2025. Overweight positioning in companies which harnessed tailwinds from both AI hardware demand and corporate Value-Up reform led outperformance in South Korea. Taiwan exposure was a negative contributor, with our overweight in AI supply chain niches positive but offset by selling our position in Mediatek after a strong rally, which subsequently went on to more than double in a month. In China, strong relative performance came from the rotating out of consumer exposure and into technology and industrials names while remaining underweight a weak market overall. Defensive exposure in India was a negative as the market bounced. In Latin America, Argentinian shale oil producer Vista Energy was a detractor and overweight positioning in Brazil was negative. Banking exposure in the GCC underperformed as the oil price fell, offset by underweight positioning in Saudi Arabia, Kuwait and Qatar. We added to Saudi Arabia, UAE, China, India and Taiwan; trimmed Hong Kong, Malaysia, Philippines, Greece, Brazil and South Africa.

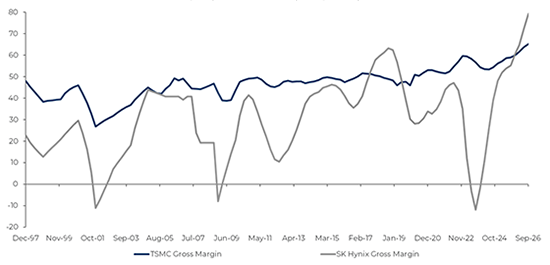
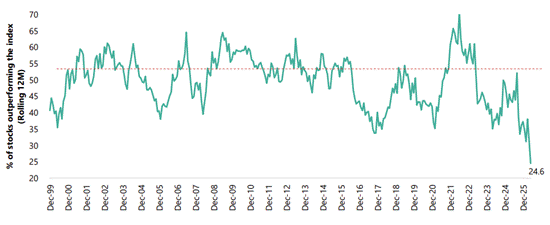
Performance in EM this year has been incredibly narrow with only 25% of stocks outperforming the benchmark with most of this coming from the AI capex beneficiaries in South Korea and Taiwan. Over the last 12 months the portfolio has generated significant alpha largely from strong stock selection across the tech supply chain, with an added boost from modest overweight positioning in these countries. Our holdings control bottlenecks across memory, advanced logic, packaging, networking, connectors and thermal cooling, capturing extraordinary cash flows as US hyperscalers race to expand compute. Portfolio activity in the region has been aimed at sweating the capital through stock picking and disciplined risk control helping to generate stronger risk-adjusted returns.

An underweight and stock selection in China was a positive. Current positioning reflects a view that authorities in Beijing are content pursuing exchange rate stability and investment in strategic industries over domestic reflation. Our response has been to tilt the portfolio away from companies being squeezed by weak domestic demand and towards companies leading efforts to bolster energy security, industrial upgrades, and technological sovereignty. Our consumer exposure in Tencent and Alibaba underperformed. Market doubts over the ROI from AI investment, concerns their LLM models lag behind AI-native disrupters like Deekseek and Zhipu, and the potential for agentic technology to disrupt traditional ecommerce and consumer apps are weighing on these stocks. However, we opted not to exit as we believe there are arguments for both companies being beneficiaries of AI deployment.

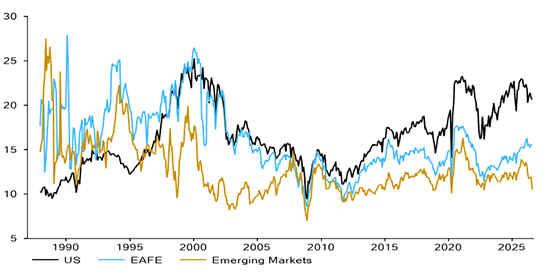
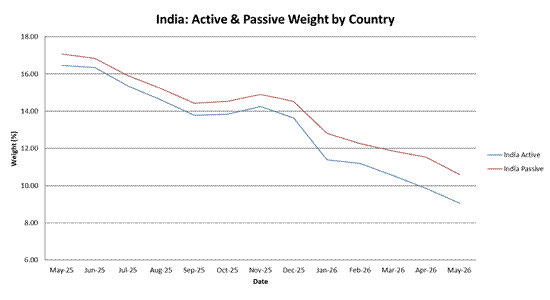
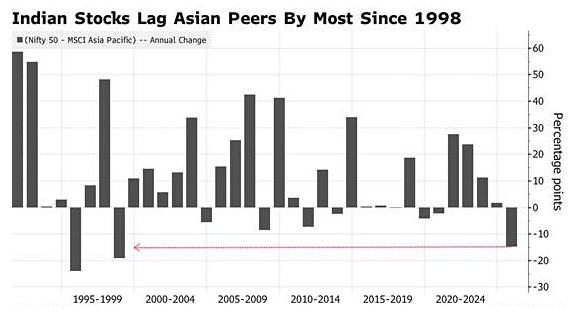
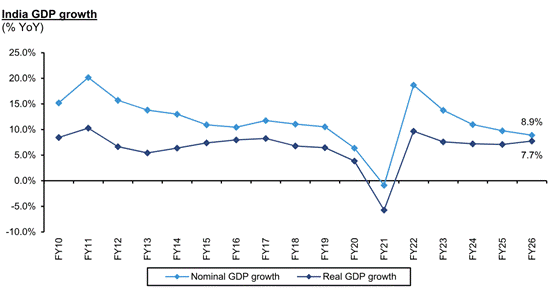
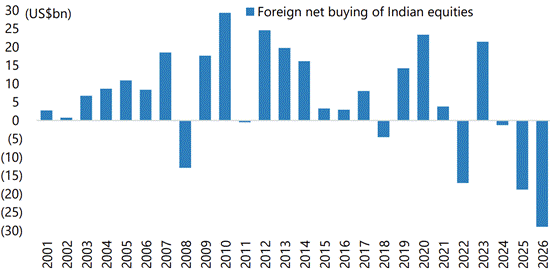
Defensive positioning in India was a detractor as the market rallied. Telecoms infrastructure provider Indus Towers was the worst performer as a period of favourable economics fades with a large volume of site renewals due over the next 12 months, exposing the company to greater competitive pressure from rivals. Foreign investors have abandoned Indian equities having been designated an “AI loser” due the disruption of its 5 million strong IT services sector. Since the end of 2024, India’s weighting in the MSCI EM benchmark has fallen from nearly 20% to 9% today, as Taiwan and South Korea have surged from a quarter to almost half the benchmark. On a price to earnings basis MSCI India trades one standard deviation above a 20-year average premium to MSCI EM of 1.5x. However, there are pockets of value and positive earnings revisions across financial services, banks, real estate, software, healthcare and retail staples.
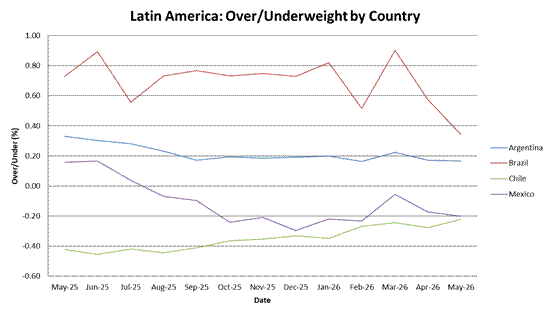
In Latin America, contributions from stock selection and an overweight to Brazil were negative as concerns over government fiscal policy, inflation, high debt levels and a slowing economy weigh on sentiment. Portfolio companies sensitive to the rate environment such as residential developer Cyrela and Sao Paolo water utility SABESP underperformed. Despite the backdrop, the operating performance of our core holdings in Brazil has been robust. The market is among the cheapest in the world on a forward P/E of 8x, and domestic allocator positioning is at record lows. Argentinian shale oil producer Vista was the largest single detractor in the region as oil plunged on the news of a US-Iran deal to end their conflict. Underweight positioning in Mexico was a contributor as the market underperformed. Domestic demand is weak, remittance payments from the US have been falling, and corporates are delaying investment decisions due to uncertainty over the outcome of upcoming USMCA negotiations.

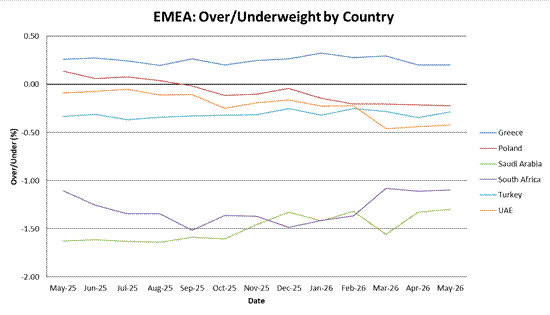
An underweight in South Africa was a positive contributor, while at the stock level outperformance by Firstrand was offset by a poor period for Goldfields. Firstand was boosted by country level credit upgrades from Fitch and Moodys, along with a positive reception to news that it may sell its UK operations. Miner Goldfields was sold as a combination of headwinds are building including a peaking stockbuilding cycle (gold is positively correlated with the cycle), the excess monetary environment becoming less favourable and extreme prior gains in the gold price. Exposure in Egypt was the largest beneficiary of conflict easing in the Middle East with the broader market rising over 20%.

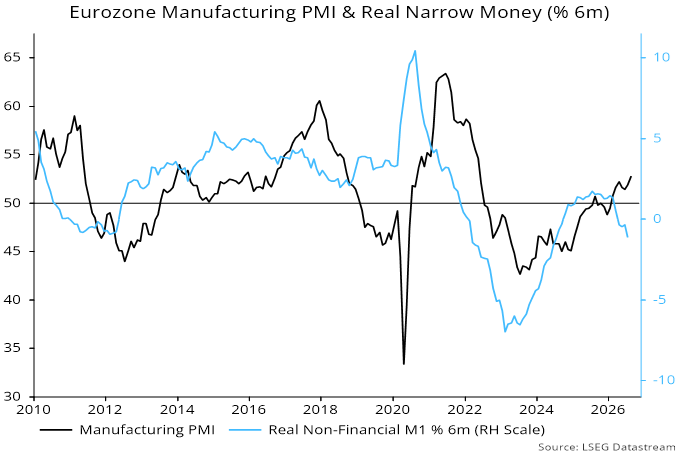
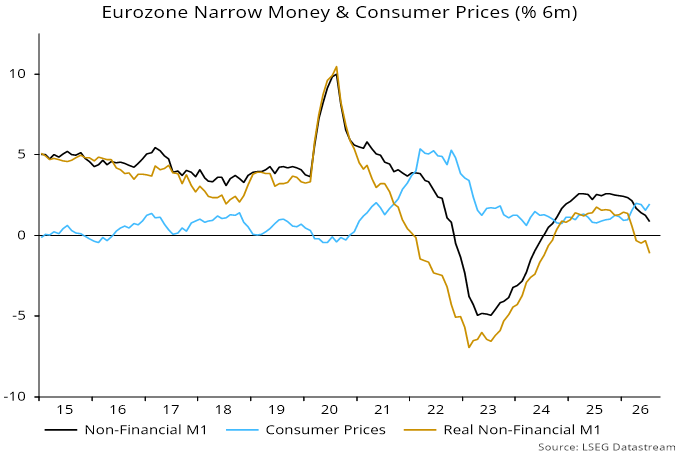
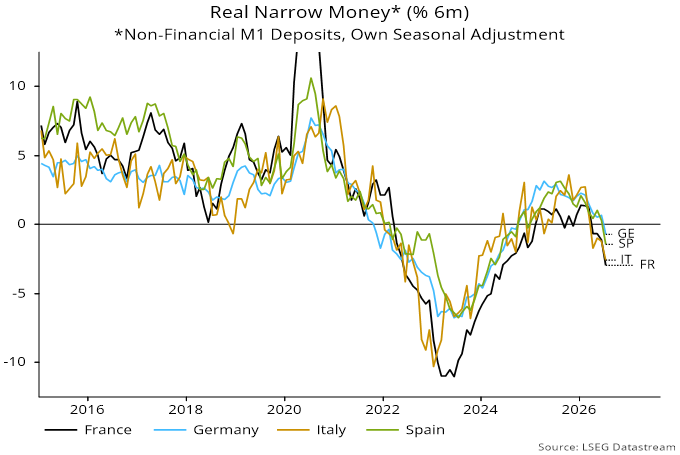
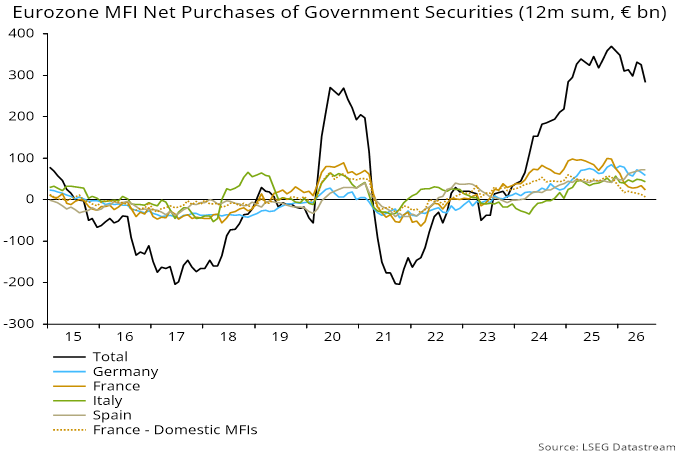
Global monetary data suggests economic weakness ahead. Rather than fade the short term spike in inflation stemming from the US-Iran war which appears to be cooling as energy prices fall, central banks risk fighting the last war by keeping monetary policy tight with negative consequences for economic activity and equities. These traditional drivers of economic and market weakness appear partially offset by a frenzy of investment and activity as AI is rolled out across industries. The process of AI diffusion is in its very early stages, but we have already had a taste of its potential for creative destruction in areas like software coding. Just as railways, automobiles and the internet created new industrial ecosystems that were hard to envisage when these technologies were in their infancy, investors face the difficult task of imagining how AI will create new sources of demand and arenas for wealth creation. The portfolio today is focused on critical infrastructure providers where earnings and margins are surging and where new supply will be difficult to bring online. While these companies trade on reasonable valuations relative to their growth and profitability, we participate with healthy scepticism based on a view that transformative innovation is rarely a linear process.

The Composite rose 28.73% (28.48% Net) versus a 24.05% rise for the benchmark.

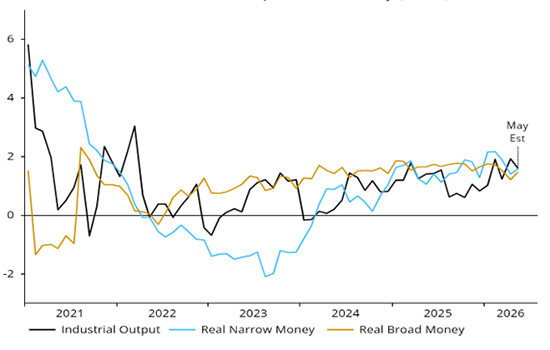
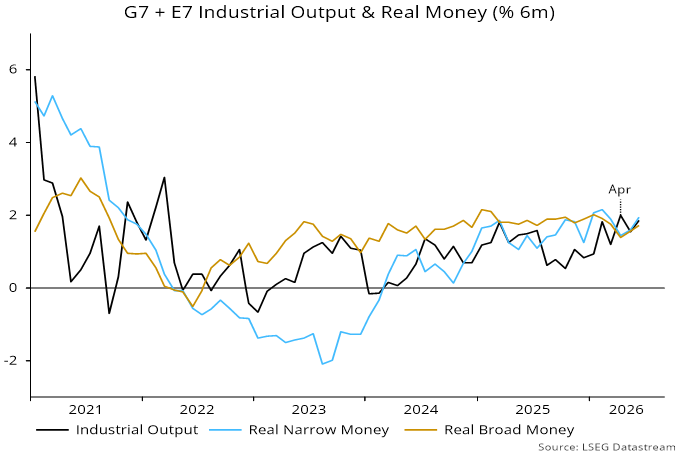
Global six-month real money growth has fallen back since early 2026, crossing below industrial output expansion in April – see chart 1. This suggests that the global economy will lose some momentum during H2, while the monetary backdrop for markets has become less favourable, at least temporarily.

Chart 1

G7 + E7 Industrial Output & Real Money (% 6m)

From a cyclical perspective, housing indicators remain weak, while the stockbuilding cycle appears to be reaching a peak, with a downswing likely to extend well into 2027.

The optimistic case is that real money growth will be supported by a reversal of the H1 boost to inflation from higher energy prices, assuming that the reopening of the Persian Gulf proves lasting, while the business investment cycle remains in an upswing driven by seemingly insatiable demand for AI compute. Still, upward pressure on financing costs from the vast spending could start to constrain momentum soon, while the disinflation lift to real money growth could be offset by slower nominal expansion, reflecting H1 interest rate rises.

A conservative view of equity market prospects, therefore, appears warranted, as least until monetary indicators give an “all-clear” signal. The cyclical framework employed here suggests that equities will perform poorly over the medium term: weak phases in the three investment cycles are scheduled to coincide at some point in 2027-28,  a condition historically associated with major bear markets.

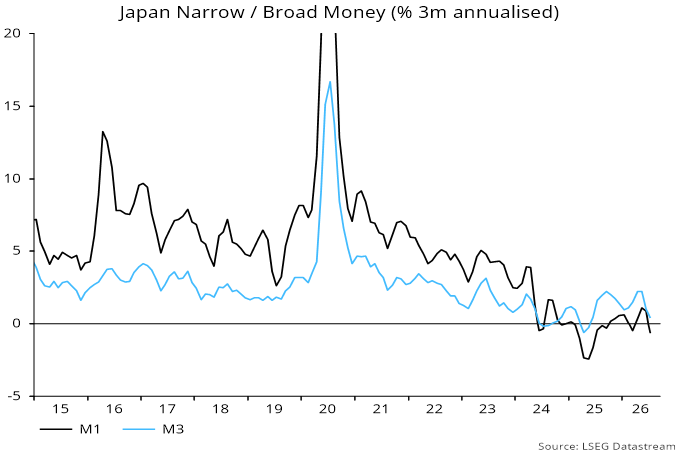
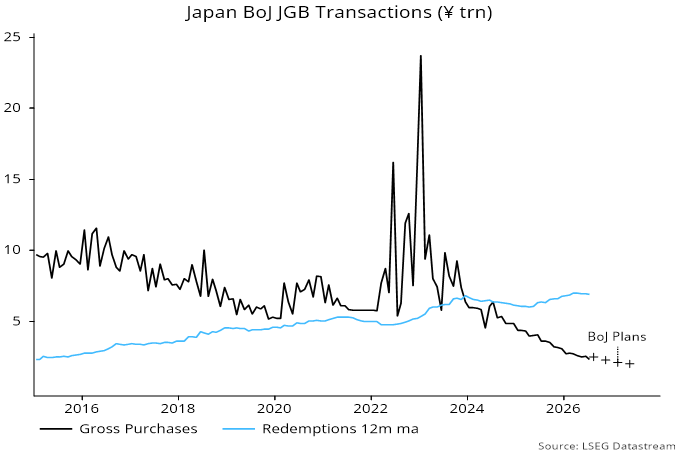
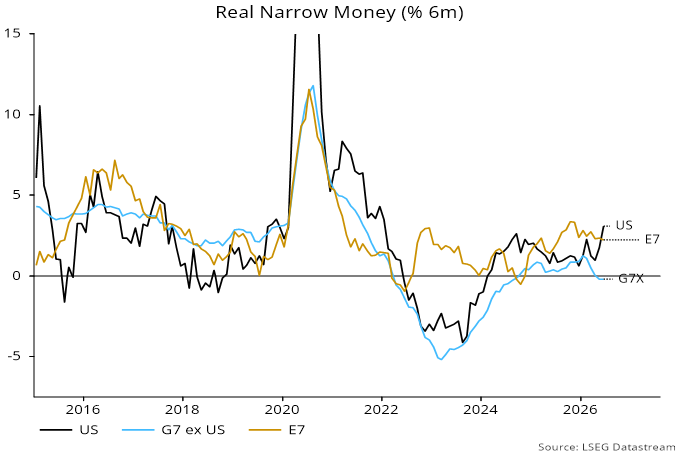
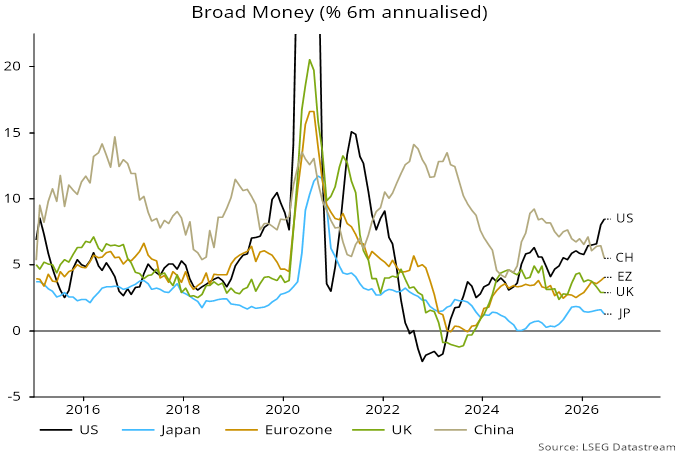
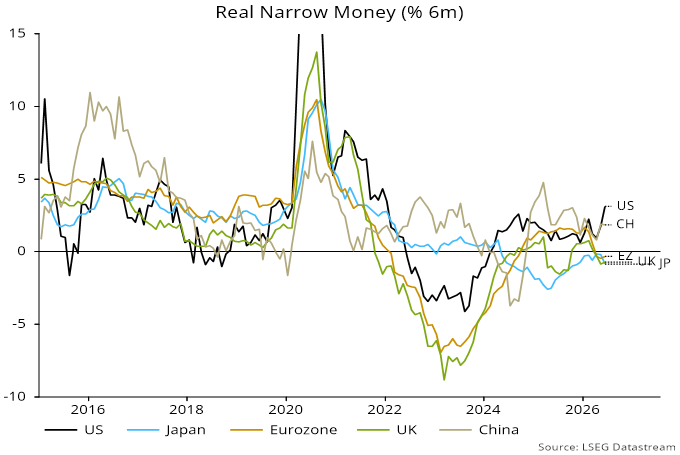
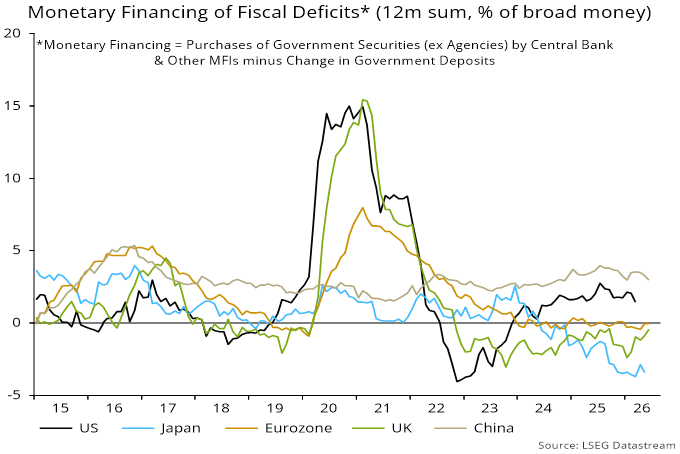
An important recent change has been a divergence of money growth across major economies, with US expansion picking up to a level inconsistent with 2% inflation, in contrast to weakness in Europe and Japan – see charts 2 and 3. This suggests superior US near-term economic prospects and a need for opposite monetary policy adjustments. If forthcoming, these could sustain a recent recovery in the US dollar, likely acting as another headwind for markets.

Chart 2

Narrow Money (% 6m annualised)

Chart 3

Broad Money (% 6m annualised)

US monetary acceleration gathered pace after the Fed’s December decision to resume balance sheet expansion, a policy that Chair Warsh wants to reverse. Action is unlikely before late 2026 but – if combined with a near-term interest rate rise – could cause money growth to slow sharply in H1 2027.

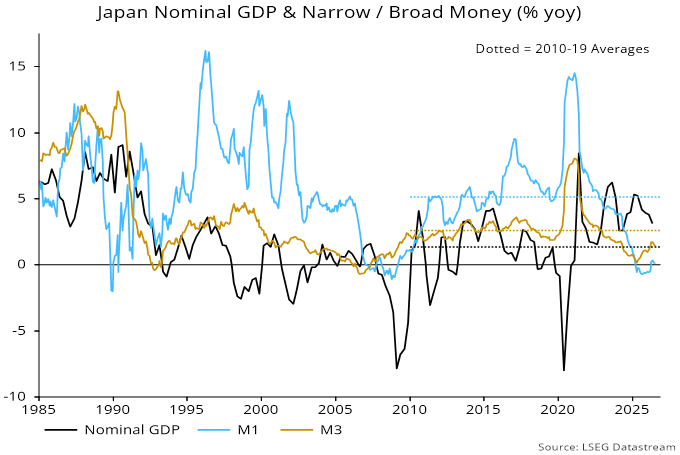
Despite US strength, global annual broad money growth is below its pre-pandemic (i.e. 2015-19) average, reflecting softness in China as well as Europe / Japan. This suggests that inflationary pressures globally will remain contained, even if US medium-term risks are rising.

The judgement that the stockbuilding cycle is peaking is supported by the global manufacturing purchasing managers’ survey, with an average of the finished goods inventories and stocks of purchases indices reaching its fifth highest level on record in May – chart 4. Downswings in the cycle were historically associated with underperformance of cyclical sectors – notably materials, financials and communication services – versus defensive sectors, especially health care and consumer staples.

Chart 4

Global Manufacturing PMI Inventories Average of Finished goods Inventories & Stocks of Purchases

Cycle fluctuations were also reflected in prices of production inputs including electronic components as well as industrial commodities. A coming downswing could challenge optimistic forecasts for medium-term earnings growth of chipmakers and other hardware suppliers.

Small caps are earning another look

Manarola village at dusk. Cinque Terre National Park, Italy.

This is the second in a two-part series on small caps. Last week, we looked at historical small caps performance, recent small caps performance and the reasons behind the unexpected. This week, we dive into what this means for allocators and skeptics.

Small caps have captured the attention of allocators, what with their outperformance of large caps, their durability through economic surprises and the access they offer outside of the crowded top ten mega caps. How does this information impact portfolio allocations?

Implementation: where the allocator’s choices can make a difference

The case for small caps is strongest when implementation is treated as part of the allocation decision. In a broad and inefficient universe, choosing active over passive, quality over the index, and a global opportunity set can make a meaningful difference. What needs to be considered when it comes to portfolio allocation?

Active over passive

We’ve previously discussed eVestment peer universe data showing the median active manager added value in Global and EAFE small cap. As of May 31, 2026, according to eVestment peer universe data the median EAFE small-cap manager has delivered 1.75% higher returns than the  MSCI EAFE Small Cap index, since the inception of our respective strategies.

BofA Global Research notes that small-cap active managers have posted better hit rates than large-cap active managers in seven of the last 11 years through 2025. The opportunity set supports it: BofA shows the long-run annualized Quintile 1 versus Quintile 5 spread for the FCF/EV factor within the Russell 2000 is approximately 20 percentage points, versus 7 within the Russell 1000.
Quality over the index

As we argued in our December 2025 commentary, “Time to take out the trash – Why high ROE matters in the long run,” the global small-cap universe contains over 12,000 names and the dispersion between the best and worst businesses is enormous.

Global breadth, with a regional lens

EAFE small caps are, in our view, the strongest within-asset-class call today. The European valuation gap to long-term averages is wide, the regional economies are at different points in their cycles, and the structural themes – German fiscal deployment, European industrial policy, Japanese reform – sit disproportionately in this universe.

Four objections to small caps, and what the evidence actually shows

If the historical evidence supports investing in small caps, and allocators have the opportunity to actively make a difference within portfolios, why aren’t small caps more heavily weighted? The four objections below come up most often in our conversations with allocators.

“Small caps are too volatile in this environment.”

But BofA Global Research’s May 2026 data documents that the realized volatility of the Russell 2000 has been lower than the S&P 500 during this decade’s worst weeks – a reversal of the prior pattern. The same has held year to date through the Iran war, and through several recent stress episodes (Brexit 2016, Taper Tantrum 2013, COVID 2020, tariffs 2025).

Reality is the dispersion in S&P 500 names has compressed as concentration has risen, while small-cap volatility no longer carries the size premium it once did. Volatility is no longer the reason to avoid the asset class.

“The small-cap index has become a junk bucket of non-earners and unprofitable biotechs.”

This was true through 2022. It is becoming less true. The median ROE of the Russell 2000 has been rising off multi-decade lows, the share of non-earners has begun to decline, the Russell 2000 saw more upgrades to the Russell 1000 than downgrades in the 2023 and 2024 rebalances and the share of US IPOs with negative earnings has fallen from roughly 80% during the 2020–22 bubble to approximately 60% year to date.

The S&P 600, which applies a profitability screen, currently has only about 10% non-earners against approximately 32% in the Russell 2000 – a structural choice available to any allocator concerned about index composition. As we argued before, high-ROE small caps have, over multi-year horizons, materially outperformed their lower-quality peers; quality selection is the answer to this objection, not avoidance of the asset class.

“Active managers can’t beat the small-cap index – look at 2025.”

2025 was the worst year on record for active small cap managers, with roughly 15% beating the Russell 2000 (BofA). It was also one of the most extreme low-quality rallies of the past decade. Active small cap managers tend to be structurally tilted toward quality, which is precisely the wrong tilt during a junk-led move. The longer-run picture is different. As above, active small cap managers have posted better hit rates than active large cap managers in seven of the last 11 years. The 2025 episode is best understood as an extreme drawdown in a strategy that has otherwise compounded reliably, not as evidence that the asset class is too efficient for active management.

“We should wait for rate cuts before adding small caps.”

Two pieces of evidence cut against this. First, per Kepler Cheuvreux, the historical correlation between European small-cap relative performance and the German Bund yield has materially weakened since early 2025. The asset class has been outperforming through rising rates, not waiting for them to fall. Second, per BofA, what matters more for small-cap performance than rates per se is the corporate profits cycle: in periods of accelerating EPS growth, US small caps have averaged 18–19% annual returns regardless of whether GDP was accelerating or decelerating, with the highest average and best hit rate in accelerating EPS combined with decelerating GDP.

The current Russell 2000 forward P/E of approximately 16.9x implies roughly 8% annualized 10-year returns based on the historical regression (BofA, R-squared 0.46). The setup does not require a particular rate path to work.

The case against small caps often rests on backward-looking assumptions: higher volatility, weaker quality, poor active outcomes and rate dependence. But recent evidence is showing us that those assumptions need to be revisited.

Sizing: the wrong question, asked the right way

Clients regularly ask how much small cap is the right amount. In our September 2025 article, “Why small caps are built for what’s next,”* we shared that our typical recommendation falls between 5% and 15%, and the precise figure matters less than the choice to size the allocation meaningfully in the first place. A four-asset mean-variance optimization on EAFE and US large and small caps – using eVestment median manager returns from January 1999 to June 2025 – produces an efficient frontier on which an all-large-cap portfolio does not sit. The closest efficient point combines roughly 30% small caps with 70% US large caps at the same volatility level, with higher expected returns. The number will vary with assumptions; the qualitative conclusion does not.

The harder question for most allocators is not 5% versus 15%. It is whether the strategic underweight that has accumulated over a decade of large-cap dominance gets revisited at all. The structural arguments stand on their own.

The recent evidence – small-cap outperformance through a genuinely difficult macro backdrop, broad-based across sectors, decoupled from bond yields, supported by a valuation gap that has if anything widened, and an index whose quality composition is improving from its 2022 lows – reinforces the timing. The objections can keep coming, but we can see through them with evidence-backed rebuttals. Allocators can make a clear difference. We think the case for revisiting the underweight is as clear as it has been in years.

Global Alpha was founded on the conviction that small caps are an inefficient asset class in which an experienced team can generate alpha across a full cycle. We are happy to discuss how a small-cap allocation can be sized within a particular plan’s constraints, and how our Global and International Small Cap strategies have navigated the recent environment.

* Contact us for a copy of this article.

Global equities have lost momentum. The MSCI World index is little changed since mid-May. The equal-weight version of the index remains below a high reached in late February – see chart 1.

Chart 1

Chart 1 showing MSCI World & MSCI World Equal Weighted in USD 31 December 2024 = 100

The stall could be explained by a less favourable “excess” money backdrop. Six-month growth of global (i.e. G7 plus E7) real money – on both narrow and broad definitions – crossed below that of industrial output in April. Narrow money growth was higher over August-March, while the broad money gap had been positive in most months since end-2022 – chart 2.

Chart 2

Chart 2 showing G7 + E7 Industrial Output & Real Money (% 6m)

Real money growth rates appear to have recovered in May but may not have moved back above output expansion, based on partial information.

Prospects for a restoration of excess money support are mixed.

The real money slowdown reflected an energy-driven rise in six-month CPI momentum. This should reverse if recent commodity price relief is sustained – chart 3.

Chart 3

Chart 3 showing G7 + E7 Consumer Prices & Commodity Prices (% 6m)

Yield curves, however, remain higher than before Gulf conflict, reflecting tighter actual and expected monetary policies. Higher rates could dampen nominal money growth.

Meanwhile, solid June flash PMI results suggest that six-month industrial output expansion will hold up near term.

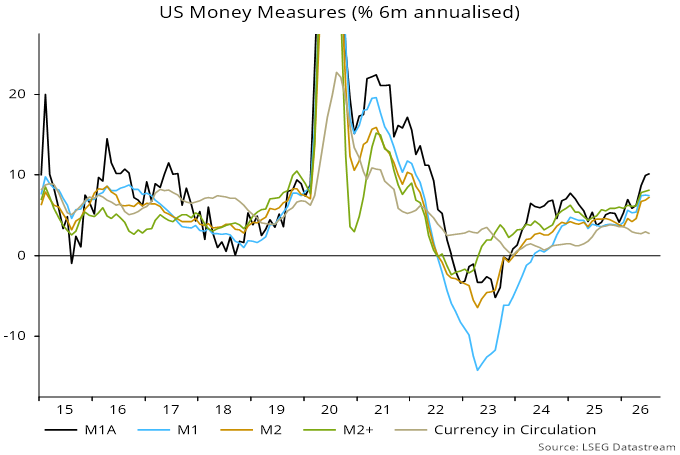
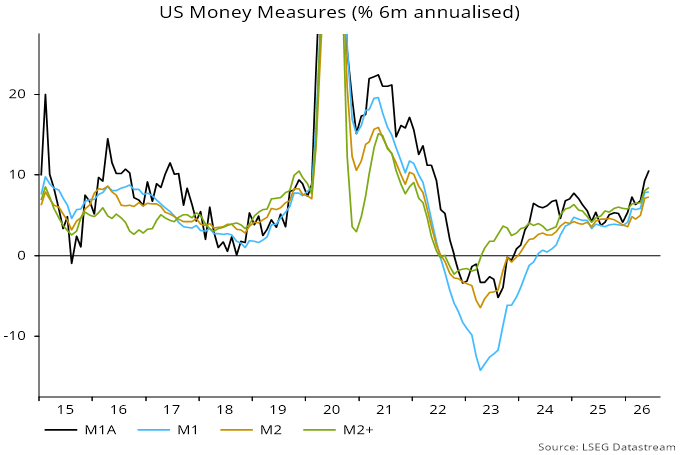
As previously discussed, global money growth has been supported recently by faster US expansion. Six-month growth of the preferred US narrow and broad measures here – M1A and M2+ respectively – rose further to 9.3% and 8.2% annualised respectively in May – chart 4. (The M1A series has been adjusted for a reclassification of some savings deposits as demand deposits in November.)

Chart 4

Chart 4 showing US Money Measures (% 6m annualised)

By contrast, six-month growth of Eurozone and UK broad money – as measured by non-financial M3 / M4 – was just 3.7% and 3.4% annualised respectively in April. May numbers are released next week.

The break-out of US six-month money growth above a January 2025 high coincided with a resumption of Fed balance sheet expansion. Chair Warsh wants to reverse this policy, suggesting a future downside risk to money trends.

Think big. Buy small caps

Colorful houses sit on a cliff in Cinque Terre (meaning “Five Lands”), in Liguria, Italy.

This is a two-part series on small caps. This week, we look at historical small caps performance, recent small caps performance and the reasons behind the unexpected. Next week, we’ll dive into what this means for allocators and skeptics.


The case for a meaningful small-cap allocation in institutional portfolios

Small caps have just done something the textbook says they should not have. Since the Middle East conflict began at the end of February 2026, small caps have outperformed large caps on both sides of the Atlantic – through an oil-price spike, a sharp re-pricing of European front-end rates and deeply negative eurozone economic surprises. Inside those headline numbers, that is not the behaviour of an asset class to be avoided.

GACM_COMM_2026-06-17_Chart01
Source: Bloomberg


Small caps have outperformed large caps on both sides of the Atlantic for the last two years.

GACM_COMM_2026-06-17_Chart02
Source: Bloomberg


Crowded at the top, despite a universe of options

MSCI’s classification methodology defines small caps as roughly the bottom 14% of free-float market capitalization in each country it covers. This creates a universe that spans over 12,000 listed companies and the institutional allocation to that universe has, if anything, contracted. Even within the S&P 500, long-only funds remain overweight the largest quintile by market cap and underweight the smallest. The result is a public-equity allocation that, for all its sophistication, is structurally tethered to the same fifty or so mega-caps that everyone else owns.

As we observed in our September 2025 article, “Why small caps are built for what’s next,”* three of the four episodes of extreme S&P 500 top-ten concentration over the past century – the Go-Go conglomerate years, the Nifty Fifty, and the dot-com boom – were each followed by extended periods of small-cap leadership. Top-ten concentration at the dot-com peak reached 37.0%; today it stands at roughly 40%. The fourth episode, today’s AI-and-Mag-7 configuration, has not yet resolved. An allocator who treats the current setup as permanent is implicitly betting that this time is different, despite repeated historical evidence.
 

Why small caps matter through the cycle, not just at the turn

Small caps earn a place in the policy mix on three grounds independent of timing the next rotation.

  1. Breadth of opportunity.
    The small-cap universe is where most listed companies actually live, offering diversified factor and theme exposure that a mega-cap-dominated large-cap book does not provide. Further, the sector composition is materially different from large caps; US small caps carry more industrials, financials and real estate than US large caps, against an underweight in technology.
  2. Direct, undiluted exposure to the themes that matter.
    Reshoring, European fiscal expansion, defence, grid and AI-infrastructure build-out and Japanese corporate reform all get expressed more purely through small caps than through the large-cap index, because the pure-play, picks-and-shovels companies in these themes are typically not listed at large-cap market capitalizations.
  3. Differentiated economic exposure.
    According to research by Kepler Cheuvreux, European small caps generate roughly 60% of revenues from within Europe, versus roughly 33% for the blue-chip 50. This domestic tilt has become a feature rather than a bug in a world of recurring trade frictions, and the pattern broadly extends across EAFE.Bloomberg data indicate that Japanese small caps generate roughly 65–75% of their revenues domestically, compared with about 45% for TOPIX large caps. That domestic exposure leaves them well positioned to benefit from the emerging global order.


Unexpected outperformance: How are small caps doing it?

The cyclical setup we identified previously – technological disruption, top-of-market concentration, valuations well above long-run averages – remains in place. The conditions since end-February 2026 have been textbook unfavourable for small caps. Per Kepler, European front-end rate expectations re-priced sharply higher, eurozone economic surprises turned deeply negative, and oil spiked before partially retracing. Kepler’s analysis of monthly relative returns since 1994 shows European small caps have, on average, underperformed large caps by roughly -0.29% per month in OECD-defined “downturn” phases and -0.43% per month in “slowdown” phases. That headwind has not materialized.

And yet, small caps are outperforming large caps. Two features of the outperformance are worth flagging:

  1. Outperformance has been broad-based across sectors rather than carried by a narrow theme: Kepler’s sector-level data since February 27, 2026 shows positive median small-cap performance against negative median large-cap performance, with European small caps outperforming large caps in nearly every sector.
  2. Small caps’ historical sensitivity to bond yields has visibly weakened – per Kepler, the relative performance of European small caps versus large caps has materially decoupled from the German Bund yield since early 2025, breaking a relationship that had held for most of the post-2021 period.

The asset class is no longer waiting for rate cuts.

The valuation picture is the cleanest piece of the case. On Kepler’s data, European large caps trade at roughly 15.2x forward earnings against a long-term average since 2009 of 13.2x. European small caps trade at 14.4x against an average of 14.8x. The US picture is similar: BofA Global Research reports the relative forward P/E of the Russell 2000 versus the Russell 1000 is approximately 0.82x, and historically the relative forward P/E explains roughly 46% of the variability in subsequent 10-year relative returns.
 

Next week: turning the case into allocation

Small cap performance has been unexpected, but not entirely surprising. As investment managers specializing small caps, we know what small caps are capable of. Now that this market segment is regaining the attention of investors, what does this information mean for portfolio allocations? How can allocators adjust their underweight? We’ll discuss those details in next week’s commentary.

Global Alpha was founded on the conviction that small caps are an inefficient asset class in which an experienced team can generate alpha across a full cycle. We are happy to discuss how a small-cap allocation can be sized within a particular plan’s constraints, and how our Global and International Small Cap strategies have navigated the recent environment.

* Contact us for a copy of this article.

Seoul Tower during spring in South Korea.

Last month, we wrote to investors about how the outperformance of EM equities was the product of a very narrow rally driven by a boom in South Korean and Taiwan tech companies. We noted that despite parabolic moves in semiconductor stocks, valuations have actually become cheaper due to a massive acceleration in earnings growth underpinned by rising US hyperscaler investment seeking to power frontier AI models.

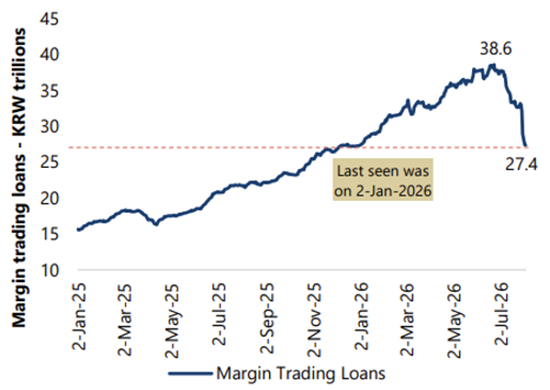
In the weeks since, tech stocks continued to surge in feverish trading led by leveraged retail investors in South Korea. Jefferies Global Head of Equity Strategies, Chris Wood, flagged in early April that margin lending in South Korea had doubled from W15.8 trillion at the end of 2024 to an incredible W32.7 trillion this year.

Korea margin loan balance (Kospi + Kosdaq)
Graph showing Korea margin loan balance increasing over time.
Source: Jefferies Global Equity, April 2026.

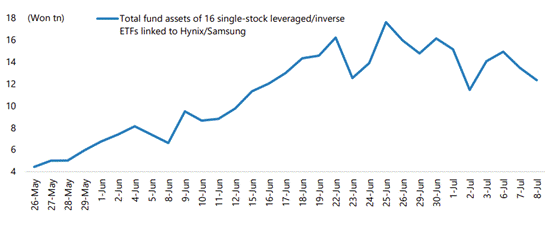
Investors also rushed to gain exposure through passive vehicles including leveraged ETFs.

 CSOP SK Hynix daily 2X leveraged product
Two graphs illustrating the purchasing trend of CSOP SK Hynix daily 2x leveraged product over time.
Source: Bloomberg

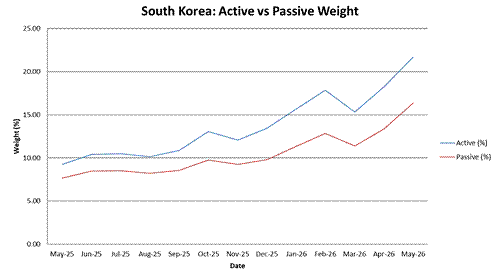
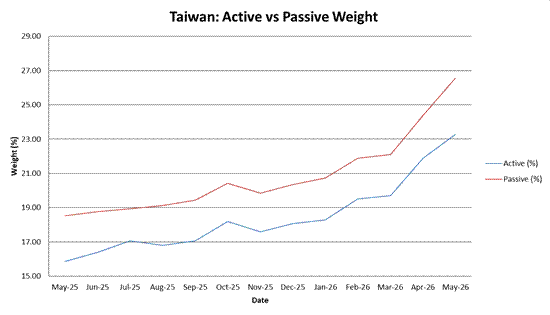
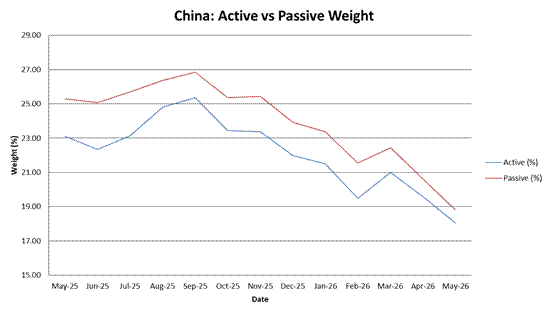
Among GEM managers, overweight positioning has been steadily rising since the beginning of 2025.

A line graph illustrating that global emerging markets managers have been increasing overweight positioning through 2025-2026, for both active and passive South Korea.

Source: NS Partners & EPFR (date to end-April 2026).


The only game in town

The acceleration in fundamentals for stocks in the AI supply chain has been so dramatic that it has swamped the broader EM investment universe. The economic drag created by the US–Iran conflict has hit markets with higher sensitivity to rising energy prices. As these markets weather the economic turbulence, AI looks increasingly like the only game in town. In response, many investors have sold down areas hit by these tailwinds to fund larger weightings in AI-exposed names.

This shift in allocation resembles Charlie Munger’s “Lollapalooza Effect,” where extreme, disproportionate outcomes arise when multiple cognitive biases and incentives converge and reinforce each other simultaneously. In this case, a shift by investors, attracted by a sharp acceleration in fundamentals, has been magnified by systematic strategies, passives and leverage chasing the momentum. As a result, the IT sector now accounts for over 40% of the benchmark.

A line graph illustrating MSCI EM weights, showing that as investment in IT has been increasing, so has investment in Korea and Taiwan.
Source: NS Partners & LSEG Datastream.


Deteriorating monetary backdrop another source of fragility

Our Chief Economist, Simon Ward, has been writing about a global monetary squeeze which began in the months leading up to Gulf War III. This was exacerbated by the war sending commodity prices and CPI momentum higher, leading to a slowdown in real money growth.

Deterioration in real money growth due to high CPI momentum
Line graph illustrating the deterioration of real money growth across G7 and E7 due to high CPI momentum.
Source: Money Moves Markets, May 2026.

Nominal money expansion to counteract the liquidity squeeze is unlikely in the near term, with most major central banks now making more hawkish noises in response to price pressures. This means less liquidity support for markets, especially in pockets which have run hard such as semiconductors.

Broken story or a reset in overbought technicals?

In early June, crowded positioning and an itch to take profits collided with rising macro uncertainty arising from the release of strong US payroll data which topped market forecasts, igniting fears the US Federal Reserve would be forced into tightening monetary policy. It is also possible that forthcoming blockbuster IPOs of SpaceX, OpenAI and Anthropic placing a strain on market liquidity further unsettled investors sitting on large gains. This culminated in a sharp selloff on the 5th of June, with winning trades in the tech sector suffering the most.

Line graph illustrating the daily change of the MXEF Momentum Index over time to April 2026.
Source: Bloomberg data


Behavioural discipline

As noted in last month’s commentary, Rallying EM equities reflect an AI-powered earnings surge, we had been trimming AI exposure into strength on a view that parabolic stock moves would inevitably run into a pullback. We have also been re-allocating within our IT exposure (a modest c.3% overweight as at the end of May), from companies where stock performance risks becoming detached from reality and into niches benefiting from the same demand drivers but where investor enthusiasm has not been so frenzied.

Over the past few years, we have worked to sweat our risk budget within the AI-supply chain, tweaking the portfolio as data and conviction changes by rotating through a number of segments outlined below.

AI exposure across layers
Image showing NSP's exposure to AI across five layers: energy, chips, infrastructure, models, and applications. The image contains several company logo examples for each of the five layers.
Source: NS Partners, June 2026.

The aim of this activity is to maximise risk-adjusted returns by maintaining a healthy exposure to AI supply chain companies, but in an allocation that is cheaper, less crowded, more positively skewed and with more independent catalysts than a static allocation to the original winners.

RealTruck product posters displayed on the exterior of Rack Attack store - a Banyan Capital Partners portfolio company.

Rack Attack, a Banyan Capital Partners portfolio company, today announced its partnership with RealTruck, bringing RealTruck products and expertise to all 45 Rack Attack retail locations. The partnership is designed to expand customer access to premium truck accessories, supported by in-store expertise and installation services.

“The launch of official RealTruck store-in-store retail shops within our Rack Attack locations will elevate our partnership and create the ultimate customer experience. Together, we are offering truck owners and outdoor enthusiasts the greatest choice of products, combined with the best service across all our markets in North America,” says Alexander Welbers, CEO, Rack Attack.

OECD leading indicator data and survey evidence on stocks support the forecast of a H2 loss of industrial momentum.

Global manufacturing PMI new orders edged down in May from April’s four-year-plus high. The expectation here has been for a further decline in H2, reflecting a slowdown in global six-month real narrow money momentum from a February peak – see previous post.

Two recent releases support this forecast. First, one-month growth of the OECD’s G7 leading indicator fell again in May. Growth peaked in December and has led PMI new orders by three months on average historically, suggesting that April’s orders high will prove lasting – see chart 1.

Chart 1

Chart 1 showing Global Manufacturing PMI New Orders & OECD G7 Leading Index (% mom)

Secondly, the PMI stocks of purchases index indicates that stockpiling of inputs accelerated further last month, likely marking a cycle peak – chart 2.

Chart 2

Chart 2 showing Global Manufacturing PMI Stocks of Purchases

Growth in new orders is related to the rate of change of stockbuilding, implying a slowdown even in the unlikely event that the stocks of purchases index remains at its current extended level – chart 3.

Chart 3

Chart 3 showing Global Manufacturing PMI New Orders & Stocks of Purchases vs 11m ma

An LNG tanker at a gas terminal.

AI infrastructure investment has moved upstream. The advent of ChatGPT, Claude and other AI applications fueled demand for semiconductor chips that enable the software to “think.” The demand concurrently brought about record capital expenditures to build out hyperscale data centres housing those chips. Now the bottleneck is even more basic: power. For AI, electricity is no longer a utility input; it is strategic infrastructure.

Data centre growth needs energy – a lot of it

That shift is colliding with a US grid whose expansion is constrained at multiple points: new generators are stuck in interconnection queues; interstate transmission still requires approvals across multiple jurisdictions; transformer shortages are delaying grid upgrades; and local opposition is increasingly slowing or cancelling data centre projects. North American Electric Reliability Corporation’s 2025 long-term reliability assessment warned that 13 of 23 North American assessment areas face resource-adequacy challenges over the next decade, underscoring that the issue is not only energy volume, but deliverability and reliability.

Electric Power Research Institute’s Powering Intelligence 2026 report makes the same point from the data centre side. Its “Generation and Capacity Impacts of Data Center Load” analysis finds that data centre growth could require large additions of generation and transmission capacity, but that supply-chain, siting and permitting constraints may limit how fast those additions arrive. In least-cost scenarios, incremental data centre load is met primarily by new and existing gas generation rather than carbon-free resources.

Getting power to where it’s hard to get

That naturally explains the recent order flow into large reciprocating engines. In April, the Finnish vessel engine manufacturer Wärtsilä Oyj Abp announced a 790 MW off-grid power solution for a new Texas data centre facility, using its 50SG natural gas engines. Wärtsilä explicitly framed the order around fast access to reliable power in a region where the grid cannot adequately meet urgent AI-infrastructure demand. Around the same time, the Korean shipbuilder HD Hyundai Heavy Industries Co. Ltd. disclosed that it had signed a US data centre power generation equipment contract based on its 20 MW-class HiMSEN engines, citing total capacity of 684 MW.

The appeal is straightforward. Large reciprocating engines are modular, dispatchable, fast-starting, scalable in increments and deployable closer to load than central-station plants. Compared with combined-cycle gas turbines, nuclear projects or major transmission upgrades, they can often be installed in shorter phases and avoid waiting years for grid interconnection. For a data centre developer, speed-to-power can be as important as cost-of-power.

Maintaining engine power at sea and on land

HD Hyundai Marine Solution Co. Ltd. (443060 KS) in our Emerging Markets Small Cap Strategy is the sole authorized provider of maintenance, repair and overhaul (MRO) aftermarket services to HiMSEN engines worldwide. As a HD Hyundai-affiliate, the company benefits from having HD Hyundai Heavy Industries – the world’s second largest shipbuilder and the largest manufacturer of medium-speed 4-stroke vessel engines – as a captive market. Of approximately 17,000 HiMSEN units in operation globally (most of them generating power for over 4,000 ships at sea), roughly 2,000 units are generating power on the ground.

Could data centres move offshore?

Mitsui O.S.K. Lines and Karpowership’s Kinetics have already signed a memorandum of understanding to develop what they describe as the world’s first integrated floating data centre platform, hosted on a retrofitted vessel and supplied by a powership capable of using LNG. In that scenario, vessel-engine makers are also powering the physical layer of AI.