After a roaring start to the year for EM equities, the outbreak of Gulf War III in early March saw the asset class stumble. This was despite market de-risking in crowded trades hitting exposure in large cap technology stocks and gold miners. While these stocks fell in March, stock picking across defence companies, AI supply chain leaders specialising in power efficiency, and a lift in exposure to oil producers (ahead of the conflict breaking out) were positive contributors, helping to preserve relative gains made through January and February. Trading activity over the period reflects a cautious view that the negative effects of the energy shock will not be swift to reverse, negative for EM commodity importers. Whipsawing markets provided opportunities to tilt the portfolio toward areas that are more insulated from the energy shock including battery and solar power names in China and banks in Saudi Arabia.
Exposure across the GCC was a negative contributor to performance. The largest drag came from being underweight a rally in Saudi Arabia which despite the conflict is under-owned by EM investors, a beneficiary of the stronger oil price, and supported by domestic allocators. Our overweight to the UAE was negative, driven largely by the decline in Dubai property developer Emaar. Elsewhere in the region, holdings in Egyptian property developer TMG and Comi Bank fell on fears a sustained oil spike will undermine the recent trend of falling inflation, rates, tourism boom and investment from GGC countries.
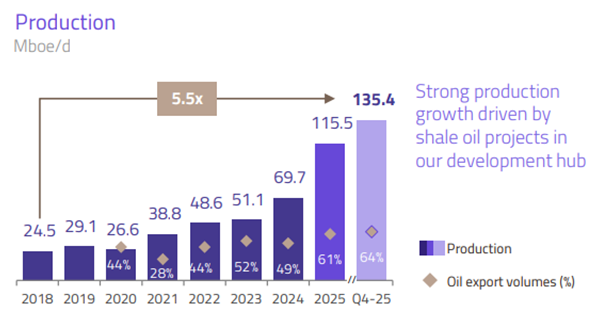
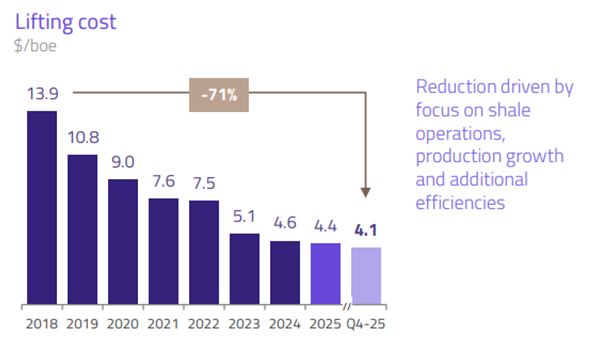
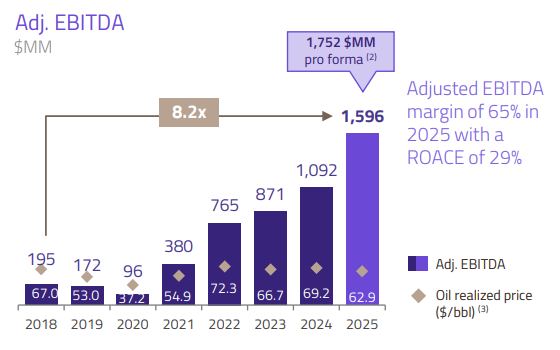
At the end of 2025, our only Energy holding was uranium miner CGN. While we remain structurally cautious on the long term prospects for oil as an investment, we were conscious that the absence of any oil exposure had become a highly consensus position and was becoming uncomfortable given the weak oil price and news of a US naval build up in the Persian Gulf. We lifted our Energy exposure to an equal weight in high quality names with assets outside of the Persian Gulf, including Argentinian shale oil producer Vista Energy and Petrochina. Both companies boast healthy returns on invested capital, sustainable even through weak pricing environments, underpinned by growing production profiles, capital discipline and low lifting costs. Contributions from other commodities including gold and copper were positive over the quarter but suffered a pullback in March. Following strong rallies and with a deteriorating global economic backdrop we decided to start reducing copper and gold exposure, including exiting Grupo Mexico, Chifeng Gold and Aura Minerals.
South Korean equities began 2026 by continuing rapid ascent powered by semiconductor companies including holdings SK Hynix and Samsung Electronics. This was further buoyed by progress in Value Up corporate reform efforts which saw the KOSPI double from mid-2025 levels. Investors were quick to take profits in winners on the outbreak of conflict in March, exacerbated by concerns that South Korea would be vulnerable to an energy shock as an export driven economy and oil importer. Memory names have been more insulted from the conflict than other exporters geared to consumer demand and rising materials costs. Supply of high bandwidth memory remains a bottleneck for AI training and inference as model sizes and context lengths grow. The supply/demand mismatch in memory has been so great that Samsung Electronics and SK Hynix are now the second and fourth ranked companies by operating profit (2026 estimates) globally according to KB Securities. In Taiwan, strong stock picking contributions based around AI’s energy bottleneck drove outperformance in niche supply chain names such as Asia Vital Components and Delta Electronics.
Our exposure to the power bottleneck for AI development was at the heart of a positive contribution from China exposure, which was resilient through the market turbulence. We increased our position in the world’s largest battery maker CATL, and bought back into leading solar invertor and energy storage producer Sungrow. Last year China added an enormous 500 GW of power capacity to its grid, more than the rest of the world combined. Much of this comes from rapid growth of solar energy, which by some measures is now cheaper than coal power in China. The battery and power management technology supplied by CATL and Sungrow is crucial to this revolution. Meanwhile, consumer internet holdings Trip.com and Tencent Music were key detractors. Both face pressure from margin compression and subdued earnings growth as they invest in longer term opportunities—Trip.com through overseas expansion, and Tencent Music via its offline concert and ticketing. These investment headwinds have been amplified by a regulatory investigation into Trip for alleged monopolistic behaviour, and by intensifying competition for Tencent Music from Douyin (TikTok), which is aggressively building its streaming user base. While both remain high quality businesses, we opted to exit Trip and reduce Tencent Music in absence of potential catalysts in the medium term.
Underweight positioning in India (held since late 2024) continues to be a positive contributor. The market is suffering from an exodus of foreign capital and an IPO pipeline as far as the eye can see which is soaking up liquidity, only partially mitigated by growing domestic mutual fund flows. India also resembles a “reverse AI trade,” lacking exposure to hardware and infrastructure components of the AI supply chain. HDFC Bank continued to struggle as a large liquid name and hence vulnerable to foreign outflows, along with slower deposit growth, falling rates hitting net interest margins, and increased provisions weighing on profitability. Telecoms infrastructure provider Indus Towers was a relative outperformer in India on signs that the monetisation of its tower base is accelerating relative to new tower additions. Indonesia was the only other Asian market which underperformed India during the quarter. As noted in previous commentaries, rising governance risks and fiscal profligacy under President Prabowo led to us downgrade our macro score for the country and cut exposure. Consequently, we held a zero weight as the market plummeted in January when MSCI flagged its concerns over market liquidity and governance quality.
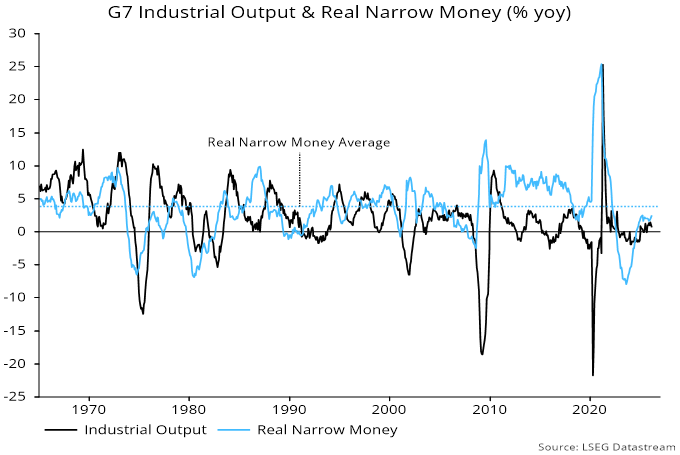
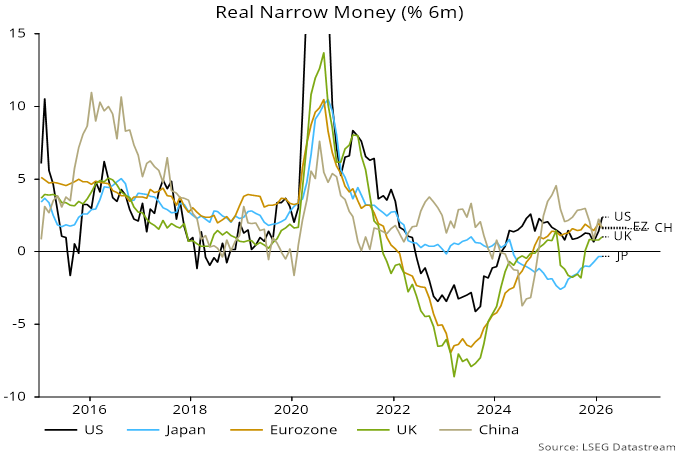
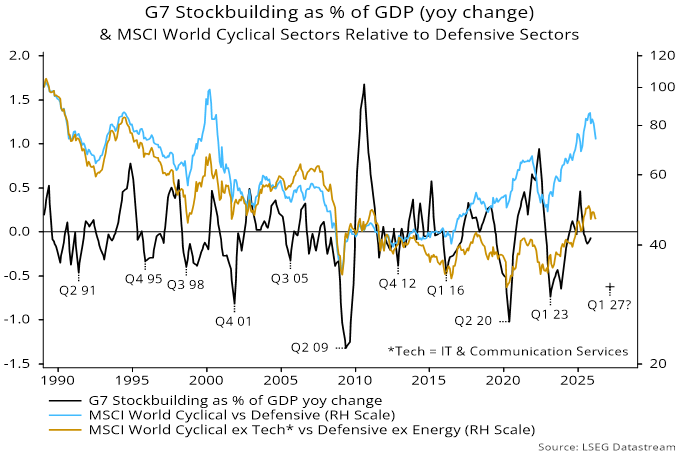
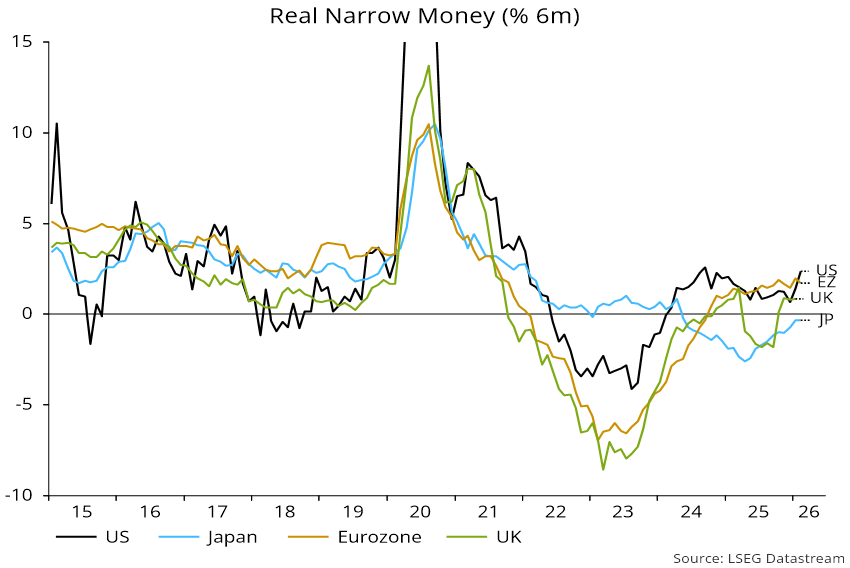
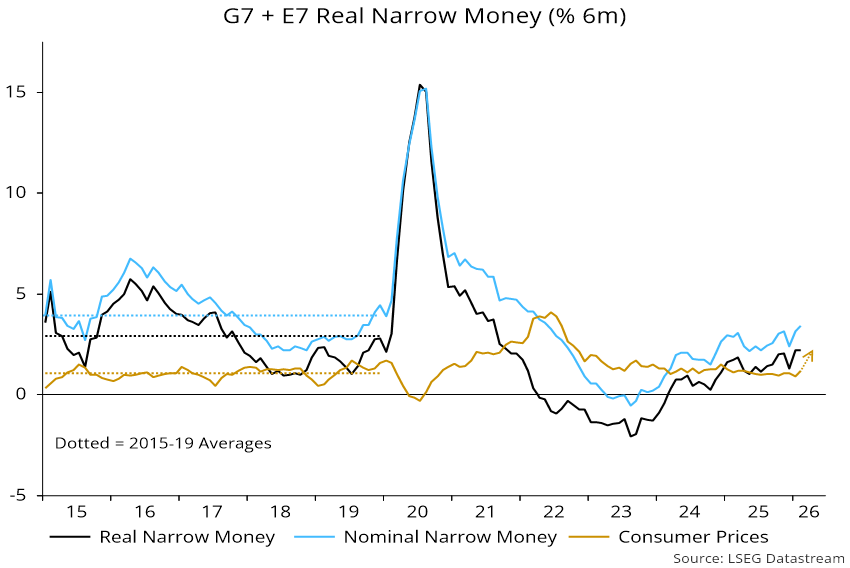
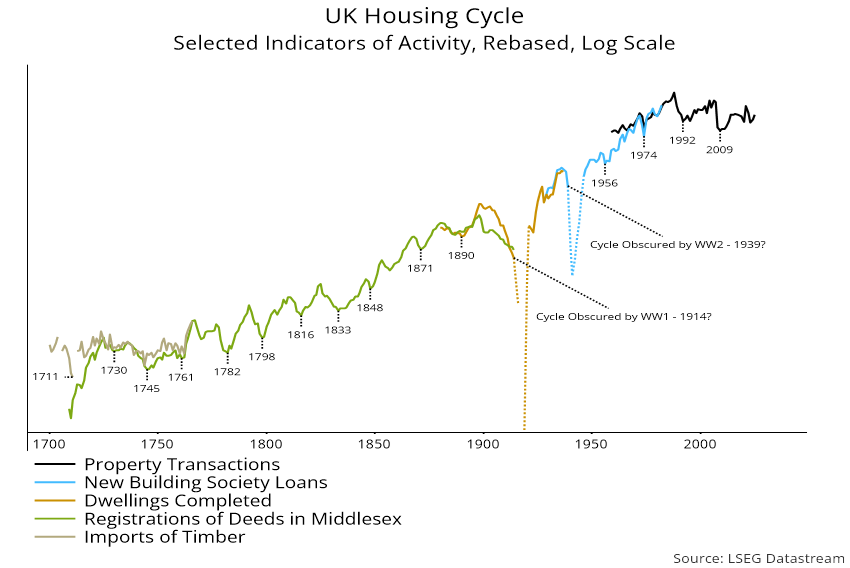
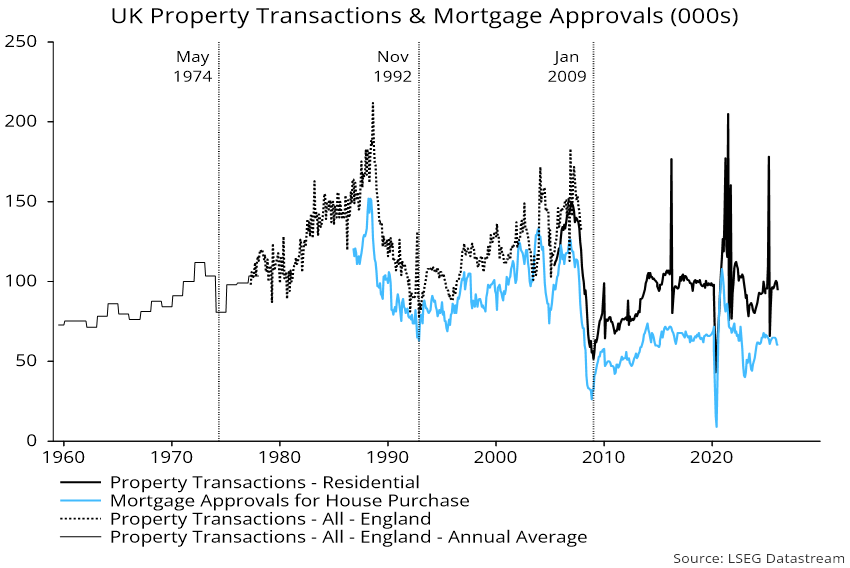
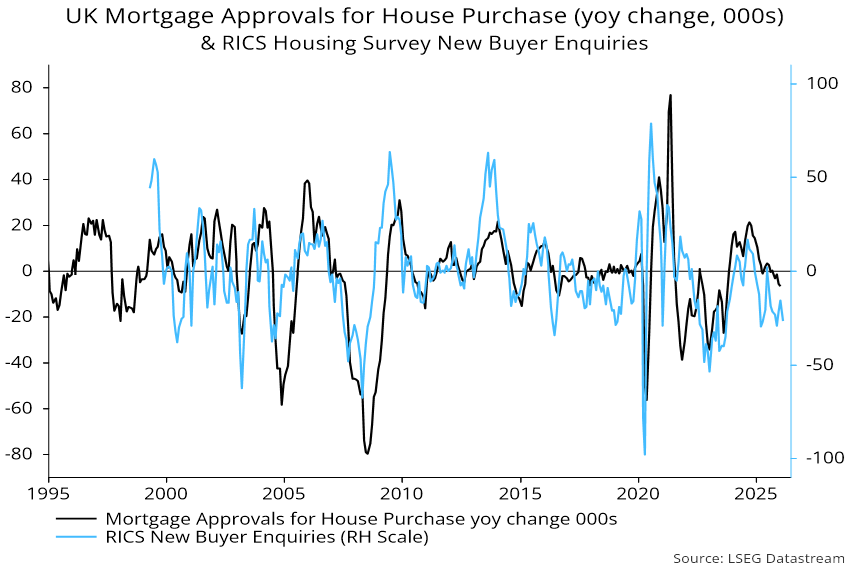
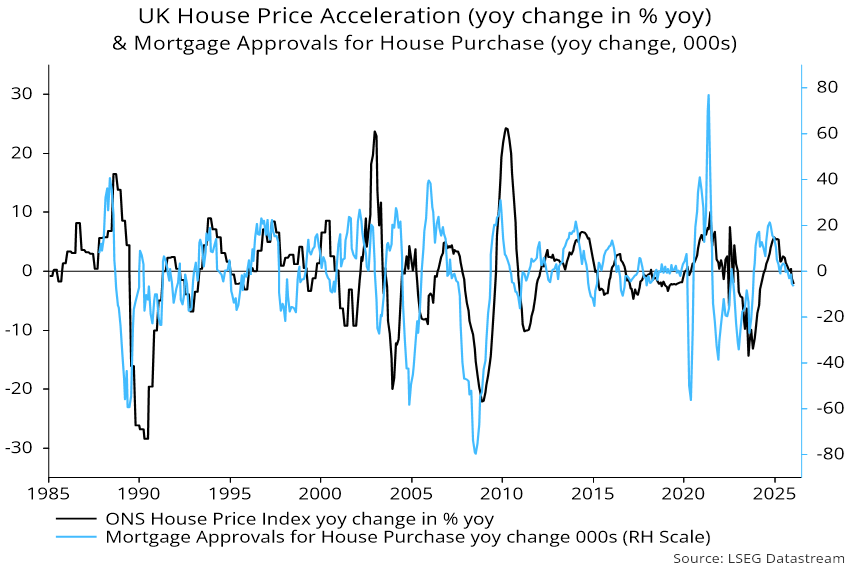
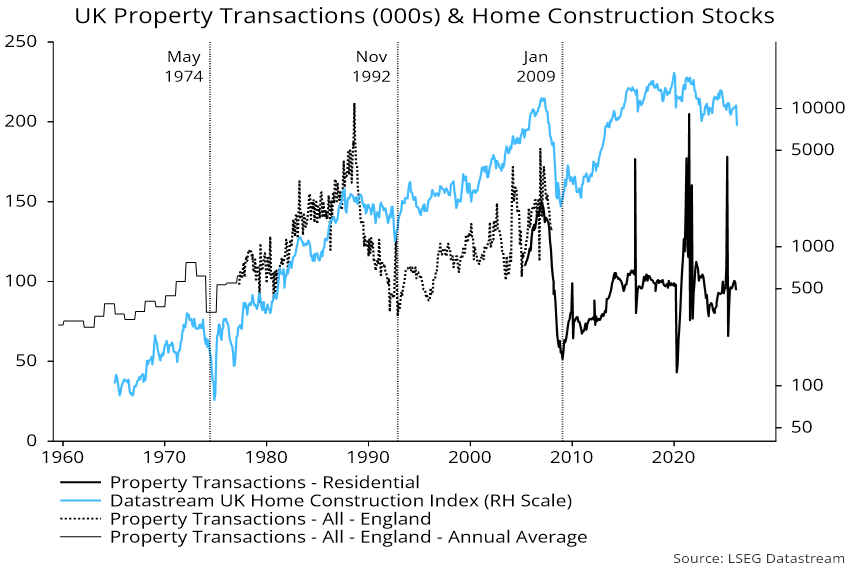
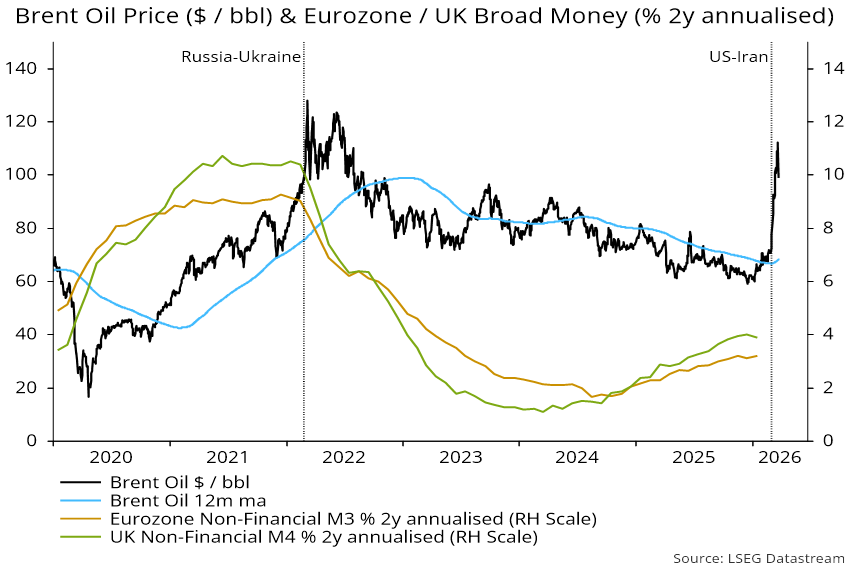
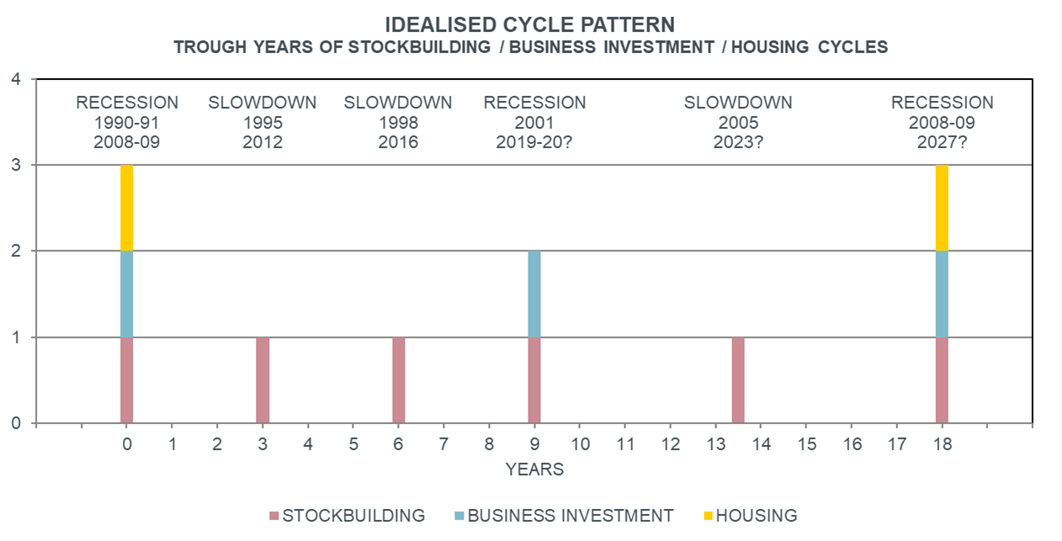
Central banks shifting to a tightening bias as a kneejerk response to the Gulf War III energy shock is likely to be yet another policy mistake. Broad money growth remains weak, suggesting that inflation over the medium term is not the key risk. We are focused on the potential for energy-related demand destruction coming at the same time as housing and stock building cycles roll over. Rallies on positive headlines from US-Iran negotiations may present good opportunities to continue trimming exposure where upside is most dependent on cyclical strength.
The Composite rose 2.17% (1.96% Net) versus an 0.17% fall for the benchmark.