A modest upside inflation surprise in March has been portrayed as confirming that inflationary pressures remain sticky, warranting further delay in policy easing.

The stickiness charge is bizarre in the context of recent aggregate data. The six-month rate of change of core consumer prices, seasonally adjusted, has fallen from a peak of 8.4% annualised in July 2023 to 2.4% in March – see chart 1.

Chart 1

Chart 1 showing UK Consumer Prices & Broad Money (% 6m annualised)

Six-month momentum, admittedly, has moved sideways over the last four months. This mirrors a pause in the slowdown in six-month broad money growth in early 2022, with the relationship suggesting a resumption of the core downtrend from around May.

Claims of stickiness focus on measures of core services momentum. Such measures gave no forewarning of the inflation upswing and are unsurprisingly also lagging in the downswing.

“Monetarist” theory is that monetary conditions determine trends in nominal spending and aggregate inflation, with the goods / services split reflecting relative demand / supply considerations.

Global goods prices have been under downward pressure because of rising supply and falling input costs (until recently), resulting in a diversion of nominal demand and pricing power to services.

So a monetarist forecast is that a recovery in goods momentum is likely to be associated with faster services disinflation within a continuing aggregate inflation downswing.

A subsidiary argument to the sticky inflation view is that the MPC can afford to be cautious about policy easing because the economy is regaining momentum.

Monetary trends have yet to support a recovery scenario. Of particular concern is a continued contraction in corporate real money balances, which chimes with weakness in national accounts profits data and suggests pressure to cut investment and jobs – chart 2.

Chart 2

Chart 2 showing UK Business Investment (% yoy) & Real Gross Operating Surplus of Corporations / Real PNFC* M4 (% yoy) *Private Non-Financial Corporations

The latest labour market numbers hint at negative dynamics. LFS employment (three-month moving average) fell sharply in December / January and is now down 346,000 from a March 2023 peak. Private sector weakness has been partly obscured by solid growth of public sector employment – up by 140,000 or 2.5% in the year to December.

Ugly unemployment headlines have been avoided only because of a sharp fall in labour force participation. The unemployment rate of 16-64 year olds would have risen by 1.2 pp rather than 0.3 pp over the last year if realised employment had been accompanied by a stable inactivity rate – chart 3.

Chart 3

Chart 3 showing UK Unemployment & Inactivity % of Labour Force, 16-64 Years

Claims of labour market resilience rest partly on the HMRC payrolled employees series but this fell for a second month in March, although numbers are often revised significantly. (A previous post argued that this series has been distorted upwards by rising inclusion of self-employed workers in PAYE.)

A recent revival in housing market activity, meanwhile, could prove short-lived unless mortgage rates resume a downtrend soon. The latest Credit Conditions Survey signalled that banks plan to expand loan supply in Q2 but the balance (seasonally adjusted) expecting stronger demand fell back sharply – chart 4. Majorities continue to report and expect higher defaults, consistent with gathering labour market weakness – chart 5.

Chart 4

Chart 4 showing UK Mortgage Approvals for House Purchase (yoy change, 000s) & BoE CCS Future Demand for / Availability of Secured Credit to Households

Chart 5

Chart 5 showing UK Unemployment Rate (3m change) & Net % of Banks Reporting Increase in Default Rate on Secured Credit to Households

Upper left: Mt. Fuji and Tokyo skyline. Lower right: Panoramic skyline of Shanghai.

I recently spent six weeks in Asia, including four weeks travelling to Sapporo and Tokyo in Japan to attend two major investor conferences hosted by SMBC Nikko and Daiwa and meet with over 50 Japanese-listed companies.

My trip also included two weeks in China to celebrate the start of the Year of the Dragon, plus a week in Shanghai and nearby Jiangsu province visiting various companies and doing due diligence on existing and prospective holdings.

Japan’s investment appeal

Many may be surprised to learn that our highest country allocation is to Japan at over C$2.3 billion of our approximately C$9 billion total AUM. Across our Global, International and sustainable strategies, we own around 25 Japan-based companies in 10 different sectors, from Asics and Sega Sammy (Sonic) to Hoshino Resorts and Sakata Seed.

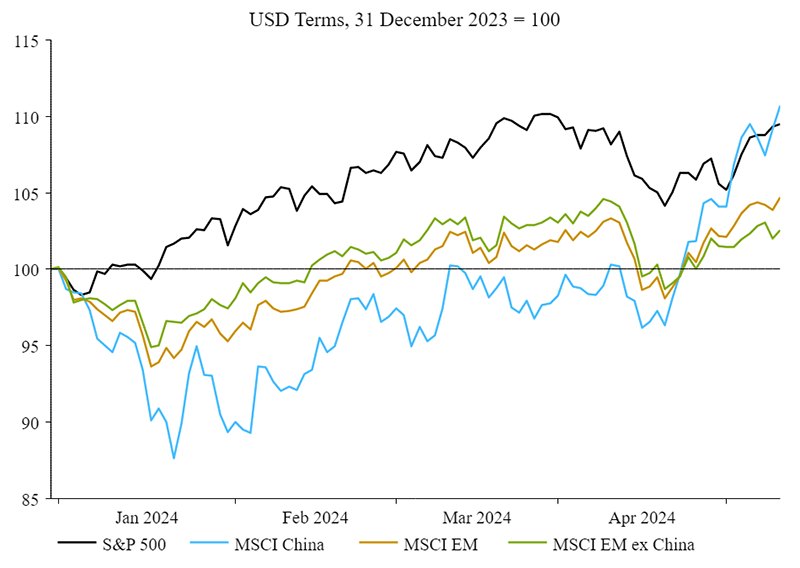
Year-to-date, the Nikkei Index is one of the top-performing developed market, up 13% in JPY or 3% in US$. The Nikkei recently broke its previous record set in December 1989. Yes, over 34 years ago. Was Warren Buffett onto something when he invested in Japan’s five largest trading companies back in August 2020?

Skepticism about the country due to its apparent structural weaknesses suggests that this rally is unsustainable. However, as anyone who reads our weeklies knows, we are optimistic on Japan and have made a point of visiting many times over the years. In the past year alone, five of us have travelled there for onsite company visits and conferences.

A resurgence in corporate Japan

Our January 25th weekly explored Japan’s improved corporate governance. Corporate reforms are gaining significant momentum. Since mid-January, 54% of listed companies have disclosed initiatives to reduce capital costs and enhance valuation. This topic was often on the first page of investor presentations at the two conferences I was at.

Companies announcing buybacks exceeded 1,000 in 2023 and amounted to over ¥9.6 trillion, with dividend payments also seeing notable increases to more than ¥15 trillion last fiscal year and growing. Stock splits are becoming common, cross-shareholdings are being sold and M&A is on the rise, albeit with private equity players still having a small role (less than a quarter of all transactions).

The Nippon Individual Savings Account (NISA) boost

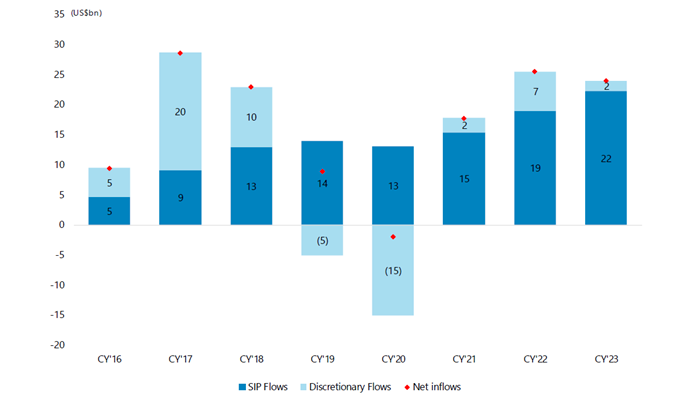
The revamped NISA now allows for an annual contribution limit of ¥3.6 million (US$24,300) per person, up from ¥1.0 million, and a total balance of ¥18 million to be permanently tax exempt. As of June 2023, there were 19.4 million NISA accounts, a modest number given Japan’s population and that households were holding a record ¥2,115 trillion in financial assets, more than half of it in cash. Approximately 1 million NISA accounts are opened each month.

Foreign investment and demographic shifts

Japan is experiencing a considerable wealth transfer set to continue over the next decade due to its aging population, especially notable among Gen-Z (1997-2012) who are more open to equity investments compared to older generations. Foreign investors are still underweight.

Deflation forever?

Japan seems to have finally escaped deflation. Core inflation rose to 2.8% year-on-year in February and should continue to stay above 2% if the latest wage increase is an indication. In March, Japan’s union group announced its biggest wage hike in 33 years at 5.85%. We believe that higher wages will ultimately encourage consumption. Most companies we met told us that their reluctance to raise prices to their customers is no more, with many now doing just that or walking away from low-margin businesses. As an example, the country’s largest beer and beverage company, Asahi, raised its prices for the first time in 14 years in October 2022 and three times since for a total increase of around 20%.

I encourage you to re-read some our previous comments on Japan as far back as 2009:

Japan’s visa policy changes and their impact on immigration

Another was about Japan’s updated visa policy, from August 3, 2018: Japan’s new visa policy. We touched on the view that Japan was closed to immigration and that its low birth rate would lead to a significant population decrease and inexorable decline.

What struck us visiting Japan this time was how many non-Japanese people work in the hospitality industry. They hail from many countries, including China, India, Sri Lanka and Vietnam and all speak Japanese and English. Back when we wrote the comment in 2018, there were 1.3 million foreign workers in Japan, compared to 486,000 a decade earlier and the goal was to increase by 500,000 by 2025. Japan achieved this goal much sooner, with 2.1 million foreign workers there in 2023. The country is entering an era of mass immigration and half of Japan’s prefectures saw net population increases last year. According to the Japan International Cooperation Agency, Japan needs 6.8 million foreign workers by 2040 to meet its growth targets. New immigration and visa policies being introduced this year will make it much easier for foreign workers to permanently settle in Japan and eventually obtain citizenship.

Observations from China

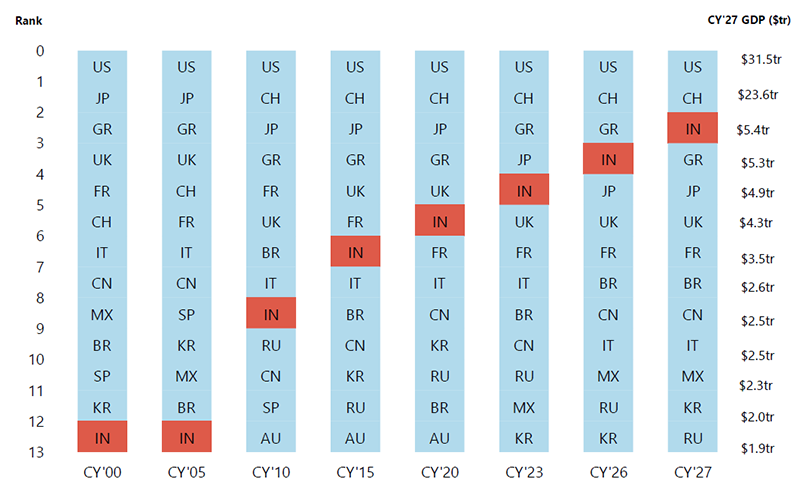
Turning to China, we believe the negative sentiment towards the country is at an extreme. India’s market capitalization recently surpassed China’s despite having an economy a sixth of the size.

We see emerging market funds exclude China and the geopolitics are at their worst in my career as an investor.

Yet, the sentiment in China is slowly improving. I spent a month there last May when the shock of the COVID-19 lockdown was fresh in people’s memory. This February, although still subdued, sentiment seemed slightly better.

Economic indicators like the PMI Composite Index – now above 50 – are improving. CPI is still negative, but with rising commodity prices, China will likely avoid a deflationary spiral. Industrial production and exports are also on the rise and retail sales are growing faster than GDP.

The property market will probably never be an engine of growth again, but the service sector, led by healthcare and hospitality, may very well take the baton.

The negative news cycle about China that we see in North America is much different than in Asia. Japan’s relations with China are improving and China’s trade with its neighbours is increasing rapidly. Indonesia’s president-elect, Prabowo, visited China in early April, mentioning the importance of maintaining good ties with China and the US and condemning the China bashing. China is now the largest trading partner to over 120 countries, including Indonesia and also Japan, South Korea, Taiwan and Vietnam.

Despite the Western media’s negative rhetoric, China is a very important market for many large US and foreign multinational brands, including Apple, BMW, Uniqlo and Zeiss. In the past few weeks, many American CEOs have visited China and met with President Xi. Janet Yellen was also there recently and President Biden is scheduled to talk to China in the coming days. Let’s hope that they can restore the productive dialogue.

China’s green revolution

China’s spent 40% more on clean energy in 2023 compared to 2022, or $890 billion – equivalent to the GDP of Switzerland or Turkey.

Also last year, China installed 217 GW of solar power, up 55% over 2022 and more than the US has in its entire history. Total solar power capacity in China is now over 609 GW. Canada has 4.4 GW; the US, 179 GW. Wind power installation increased 21% to more than 441 GW. Canada has 19 GW and the US has 141 GW.

BYD overtook Tesla as the largest NEV car company in 2023 and Xiaomi has now reclaimed a #2 position in the Chinese smartphone market.

So, regardless of the negative news, we are generally constructive on China, have made a number of investments in the country and continue to find attractive investment ideas there.

Reflecting on a phase of resilience and renewal

Our travels through Asia reinforce an evolving narrative not just of growth but of transformation. The confluence of Japan’s market performance and its emerging immigration landscape paints a picture of a nation redefining itself. Meanwhile, China’s quiet resurgence, often obscured by geopolitical noise and prevailing sentiments, is creating an environment of untapped opportunities that invites a deeper understanding beyond surface-level perceptions. We are ready to embrace the potential of these markets to generate alpha for our clients.

Loupe focusing on the text "Emerging Market" on financial newspaper.

Calling for the turn in EM performance has long been dismissed by sceptics as investing’s tribute to Samuel Beckett’s play, Waiting for Godot. The story centres on two strangers who both happen to be waiting for a man named Godot to appear, and pass the time by contemplating the meaning of life in a seemingly endless cycle of anticipation and uncertainty.

Defenders of the asset class argue this is too harsh for such a diverse subset of countries and companies, providing ample room for stock pickers to seek out alpha.  On the other hand, EM investors have largely struggled to escape the gravitational pull of a dollar bull market that has lasted for over a decade, illustrated in the charts below.

USD has been both a key signal and driver for emerging market equities
Line graph of the MSCI EM Price Index relative to the MSCI World Index from 1970 to 2024.
Source: NS Partners & Refinitiv Datastream


Was October 2022 a USD secular peak? The recent rally has yet to breach that high
Line graph of the real US dollar index compared to advanced foreign economies, pre-1970 to 2024.
Source: NS Partners & Refinitiv Datastream

 
US equities have been ascendant for nearly a decade and a half, led by the superior earnings growth and profitability of the tech titans. Many large EMs have had to work through sharp recessions, deleveraging, balance of payments issues, foreign capital exodus and related currency weakness. The dynamics create a reflexive vicious circle where these negatives feed on each other, providing a poor backdrop for EM equities.

The result is global allocators herding into US stocks at the most concentrated levels since at least 1929 (see chart below), and within that weighting to the US, we saw the seven largest stocks in the S&P500 grow from 21% of the index to 30% by the end of 2023.
 

The current concentration of US stocks helped to drive an exceptional period of market returns

Line graph showing growth of market cap of the S&P 500 Index between 1980 and 2024.
Source: Goldman Sachs, February 2024. Universe consists of US stocks with price, shares, and revenue data listed on the NYSE, AMEX, or NASDAQ exchanges. Series prior to 1985 estimated based on data from the Kenneth French data library, sourced from CRSP, reflecting the market cap distribution of NYSE stocks.

Going long US equities has been the winning trade for a long time. However, sticking solely with what has worked can risk falling into the behavioural trap of recency bias, and letting opportunities slip by.

Emerging markets have been left out in the cold, and we have hardly been banging the table over the last year or so. Everyone has heard the contrarian bull case of troughing EM economies, earnings, currencies and valuations.

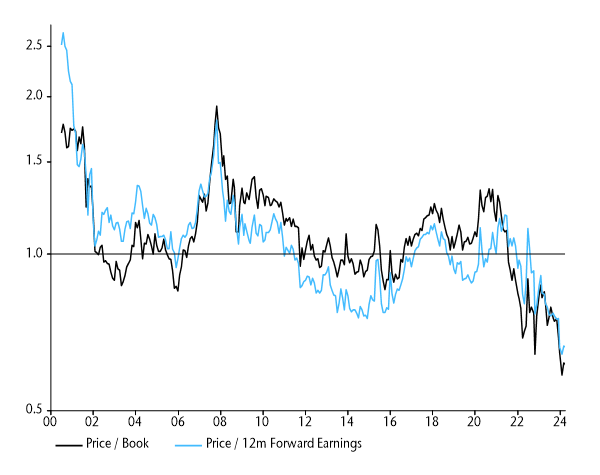
Valuations are compelling
Line graph comparing forward PE and price-to-book ratios for the MSCI EM and MSCI World indicies from 1995 to 2024.
Source: NS Partners & Refinitiv Datastream


EM currencies look cheap (Brazil and Mexico are outliers)
Line graph comparing exchange rates between Brazil, Mexico, China, Taiwan, India, South Africa, Korea and Indonesia from 2015 to 2024.
Source: NS Partners & Refinitiv Datastream

We have emphasised their superior money numbers and better inflation management by EM central banks, providing plenty of room to ease from very high levels of real rates.

However, the clincher in our view is a potential shift globally to positive excess money growth (real narrow money growth in excess of economic growth). This “double positive” condition of stronger money growth in EM than DM combined with positive global excess money has historically been correlated with EM outperformance.

This dynamic is illustrated in the charts below, the first mapping our two monetary indicators to periods of EM out- and underperformance (shading highlights double positive readings), while the second reinforces this with a hypothetical EM portfolio that moves to cash whenever either of the monetary indicators is negative.

Excess money measures mixed, double positive soon?
Line graph comparing MSCI EM Cumulative Return Index, MSCI World Index and excess money measures from 1990 to 2024.
Source: NS Partners & Refinitiv Datastream


Hypothetical performance of excess money switching rule
Line graph showing hypothetical performance of excess money switching rule from 1990 to 2024.
Source: NS Partners & Refinitiv Datastream

As you can see, that blue line for global excess money has been trending less negative and could be about to enter positive territory.

While it may be some time yet for the money and dollar signals to fall firmly in favour of emerging markets, our view is that point is getting closer.

With EM positioning plumbing the depths, catching the upswing in sentiment will reward those non-conformists with the stomach to embrace the uncomfortable.

Woman visiting beautiful town in Cinque Terre coast, Italy.

Despite ongoing macroeconomic uncertainties and some softness in business activity, financial results published from our holdings for 2023 reassured us. On average, both margins and earnings held up relatively well. Here are two examples of holdings that contributed positively during the first quarter of 2024.

Sopra Steria Group:

Sopra has historically managed mid-single digit organic growth in addition to consistent quality M&A to enhance topline growth. Its historical margins, however, have lagged larger peers like Accenture or CapGemini due to the acquisition of Steria in 2014 which was dilutive to margins [Steria was 350 basis points (bps) below Sopra’s margin], as well as some segments and geographies where management has somewhat sacrificed margins for growth. In 2023, despite additional margin dilution from recent acquisitions, Sopra achieved a 9.4% operating margin, its highest since 2011, and much closer to the 10% to 12% expectation for a major European IT service firm. This was driven by increased pricing, operational efficiencies and scale. We expect Sopra to reach and maintain this improved margin profile in the next couple of years, while maintaining a defensive end-market profile than peers. As such, we remain optimistic on the name.

Melia Hotels International:

After the initial collapse of travel in 2020, when Melia saw its sales drop 70% year over year, the resort hotel operator enjoyed explosive revenue growth due to what analysts coined “revenge travel.” While 2023 saw more normalized 14% topline growth after two years of high double-digit growth, there is still plenty of room for sustainable growth on both the top and bottom line. Despite reaching peak EBITDA from 2018, margins remain a full 200 bps before pre-COVID and there is no reason to believe pre-COVID margins cannot be reached again as the inflationary environment normalizes. Furthermore, the company announced earlier this year the sale of 38% of three of its hotels to Santander for €300 million, strengthening Melia’s balance sheet through deleveraging, while highlighting the bank’s confidence in Melia’s growth prospects. Overall, the company appears quite confident in its 2024 outlook. Despite concerns that inflation could impact discretionary spending including travel and lodging, Melia expects low double-digit RevPAR growth driven equally by price and occupancy, which seems supported by strong January and February data.

Over the next weeks, European companies will start publishing their Q1 revenues, and with it, their outlooks for 2024. The comparison basis with Q1 of 2023 could prove challenging, but we are still projecting companies to generate positive earnings growth for this calendar year. Here are some observations that tend to support our view that the economic improvement could continue:

Real wage growth and savings rates are supportive: After experiencing negative mid-single digit growth in 2022, the Eurozone and the UK are now back to positive real wage growth. As a result, saving rates have started to climb and the gap with the US has widen. As shown below, EU and UK gross savings rates are very supportive compared to the US. The economic activity could react positively to a scenario where households decide to shift a portion of that disposable income into consumption.

Savings rates across the US, the UK and the Eurozone

Chart 1: Line graph showing EU, UK and US gross savings rates, 2015 to 2024.
Source: Berenberg.

European optimism is growing: Business surveys and confidence indices are showing early signs of recovery, as indicated by the latest release on the German business outlook. Although it may not immediately translate into new orders, it could play an important role in how the second half of this year develops.

The housing market is stabilizing: Mortgage approvals in the UK bounced back in February to a level not seen since September 2022. A similar picture can be observed in Germany after two years of excessive contractions. Although corporate loans were still declining in the first quarter of 2024, we are starting to see credit conditions easing for mortgages, a first since 2021.

The destocking cycle is coming to an end: The destocking cycle that started in early 2023 has contributed to a very low level of stocks. Some industries might even carry too low a level of stocks in the event that pent-up demand returns in the second half. Any uplift in order intake would require a higher level of stocks, which would revitalize the manufacturing sector.

Valuation discount: The wide valuation gap that exists between Europe and Global could be narrowing as economic indicators and confidence improve. As shown by the 12-month forward earnings index below, small and mid-cap stocks are still trading at discount vis-a-vis Global. A potential rate cut, expected in June, combined with a reacceleration of demand, would likely drive small and mid-cap companies.

Forward 12-month earnings for European companies vs. the Global market

Chart 2: Line graph showing 12-month forward earnings index for Europe and Global small, mid- and large-cap indicies, 2019 to 2024.
Source: Berenberg.

In a world where the unexpected has become the norm, our holdings’ resilience through last year’s ups and downs offers a sense of stability and growth potential amid uncertainty – and an opportunity to think beyond the immediate to what could be on the horizon.

Upper left: Riyadh skyline at night in Saudi Arabia. Lower right: Dubai skyline and cityscape at sunrise in UAE.

In February, we travelled to Saudi Arabia and Dubai to meet with a long-time holding in Jeddah, attend the second instalment of the Saudi Capital Markets Forum in Riyadh, and visit a newer addition to the portfolio in the United Arab Emirates (UAE).

1. Company visit in Jeddah

Our last research visit to Jeddah was in 2019, a time when the world looked remarkably different, and markets were not accounting for the successful execution of Saudi Arabia’s Vision 2030 transformation.

Located on the country’s Western coastline, Jeddah enjoys a more temperate climate and serves as both a gateway to the holy cities and a bustling commercial port. It has historically been more liberal than the capital, Riyadh, which has recently advanced at the forefront of the Kingdom’s social and cultural evolution.

The Saudia Dairy and Foodstuff Company (SADAFCO), established in 1976 in Jeddah, manufactures and sells Long-Life (UHT) milk, tomato paste, and ice cream under its flagship brand, Saudia. Leading the market in Long-Life Milk (64% market share), tomato paste (56%), and ice cream (31%), the company boasts strong distribution channels with three factories, 23 depots, and almost 1,000 trucks, generating annual revenues of $700 million.


SADAFCO factory, Jeddah.

During our visit, we toured the ice cream and milk factories within the HQ compound, built in 2020 and 1976, respectively. Both facilities impressed us with their high levels of automation and operational efficiency, producing over 50,000 ice cream products and 10,000 litres of milk per hour. The company’s approach to reconstitute milk from skimmed milk powder (SMP) instead of producing fresh milk is advantageous in Saudi Arabia due to limited renewable water resources and recent subsidy removals on cattle feed. Water consumption for UHT milk production is significantly lower compared to fresh milk (under 1.9 litres of water per litre of UHT milk versus over 600 litres for fresh milk). Management have been proactively economising water usage through a water recovery system that collects hot water, cools it to an ambient temperature, and recirculates it in a closed system. This has led to savings of 45 million litres of water per year at an average cost of over $200,000.

Total water withdrawl/production volume

Source: Sustainability Report.

Competitors relying on fresh milk have seen their production costs increase, leading to pressure to raise prices. This situation, along with recent SMP price declines, has supported SADAFCO’s margins.

Gross margins vs. average SMP price vs. product prices

Source: Company, CIAL.

The business has diversified over the years, with the ice cream segment showing rapid growth and recent extensions into out-of-home (OOH) markets, doubling the potential addressable market. We are confident in the brand’s strength, the company’s wide distribution reach, and a strong management team focused on long-term value creation.

2. Saudi Capital Markets Forum in Riyadh

We spent three days in Riyadh, attending the second Saudi Capital Market Forum (SCMF), and conducting site visits across retail, fitness centres, and pharmacies.

The 2024 SCMF hosted twice the number of investors as in 2023, indicative of the growing interest in the market. Many participants were new to the country, and the diversity of the attendees was a notable shift from previous years. On recent flights to Riyadh, we have noticed more tourists visiting for music and sporting events, as well as creatives capitalising on the boom in media spending and domestic tourism – a distinct experience from past trips when we saw mostly business travellers and locals.

There is an appetite to accelerate the learning curve on the country given Saudi Arabia’s weighting in the Emerging Markets (EM) index and historically low involvement with the region. Saudi is not your typical EM, with a per capita GDP comparable to Czechia and Slovakia and a modest population of 36 million people.

GDP per capita (purchasing power parity)

Source: World Bank.

From a socioeconomic perspective, the country lags in terms of human development measures, especially relative to income per capita levels as shown in this chart:

Beyond the country’s cross-sectional nuances, there are well-documented economic and social changes taking place, underpinned by Vision 2030. Each of our visits to the country serves as a snapshot of the remarkable transformation taking place. Even with all the commentary about it, nothing compares to seeing the changes firsthand.

Notable developments in civil liberties include the dilution of the religious police’s power as early as 2016, allowing music concerts, female gyms, and cinemas since 2017, and 2018’s lifting of the ban on women driving. Whilst evident in 2019, it is only more recently that cumulative change alongside growing internal conviction in the country’s evolution have aided a lighter and more liberated atmosphere.

Female participation in the workforce has increased (up to 40% vs. 33% in 2016), impacting sectors differently. Since many women live with their husbands or parents, the rise in disposable income is largely discretionary. Concurrently, growth in leisure options is cannibalising the time previously spent in shopping malls. There is huge excitement for the tourism sector given the government’s willingness and fiscal capability to drive the industry. In healthcare and education, the government once held both regulatory and provisional roles, but is now focusing on the former and setting ambitious privatisation targets.

So, while the typical analyses of conventional EMs may not fully apply to Saudi Arabia, there are plenty of industries with promising growth prospects reflecting the leadership’s long-term goals.

3. Company visit in Dubai

Our final stop was Dubai, where we visited Taaleem, a recent addition to the portfolio.

Taaleem is one of the UAE’s largest K12 school operators, with 16,500 students across 14 private schools offering British, International Baccalaureate, and American curricula. Positioned in the ‘Premium’ market segment, with tuition fees from $15,000 to $20,000, Taaleem also partners with the government in operating 18 schools comprising 19,000 students, where the company earns fixed fees per student as well as variable fees based on academic attainment.


Greenfields International School (GIS).

Unlike Saudi Arabia (16% private education penetration), the UAE has a high private education penetration, driven by a large expat population. The market is expanding, with private enrolments expected to reach 570,000 by 2027. The demand for high-quality schools is increasing as more expats establish roots in the country.

Private education market in KSA is still the lowest in GCC

Source: NCLE Presentation 1Q24.

We visited Greenfields International School, a 1,500 student International Baccalaureate (IB) school in Dubai Investment Park. A substantial proportion of the students are expats from within the region, yet the school is home to 75 different nationalities, reflecting the IB diploma’s broad appeal. Fees average $15,000 but vary widely, ranging from $8,900 for pre-school to $21,400 for the upper grades. Contributing 10% to Taaleem’s total revenues, the school (est. 2007) has improved its performance and ratings under new leadership.

Historically, Greenfields underperformed the rest of Taaleem’s portfolio in Dubai’s Educational Ratings, earning a ‘Good’ and scoring IB exam results below the UAE average. Since a new Principal took over in mid-2021, IB scores and pass rates have improved, and the school’s rating is now ‘Very Good.’ Most recently, Greenfields was recognised as one of Dubai’s top-5 IB schools.

GIS average IB score & pass rate (%) vs. UAE average IB score

Source: KHDA.

Our experience suggests that for private education providers, financial results often correlate with academic achievement and student/parent satisfaction. In the first quarter of this year, the school increased its utilisation rate to 98% from the mid-70% range pre-2023. Construction is underway to add 500 more seats for the next academic year and management feels confident about filling this increased capacity.

GIS utilisation (%)

Source: Company/KHDA.

We believe there is embedded average fee growth as the student base graduates to higher grades from pre-school. The main cash costs for the business are staff, and there is more interest from teachers in the UK and Europe due to lifestyle and earnings advantages. Taaleem benefits from government partnerships and is playing a role in improving education standards. Land is scarce in both Dubai and Abu Dhabi but as an education provider, Taaleem benefits from the government’s earmarking of space for schools and hospitals.

Despite potential risks, such as the UAE’s shifting appeal as an expat destination, we are confident in the quality-price ratio of Taaleem’s schools and expect them to be less impacted, so long as academic achievement and parent satisfaction remain high.

From the strides in Jeddah’s industrial sector to Riyadh’s evolving market landscape and Dubai’s educational innovation, our trip illuminated the swift changes and emerging opportunities within these economies and how tradition and modernity are coming together to shape the future.

Jeff Wigle discusses Banyan’s 12-year partnership with Purity Life and the world of private equity on the Purity Pulse podcast.

Two businessmen shaking hands in an office.

The fluctuation in mergers and acquisitions (M&A) activity in 2021 followed a typical cyclical pattern, echoing broader economic trends. The initial surge in M&A was propelled by low interest rates and a swift reopening from the COVID-19 pandemic that encouraged companies to pursue strategic acquisitions. This led to the highest M&A volumes since 2007.

However, several factors dampened the momentum in 2022-23. Aggressive interest rate hikes, rising inflation, geopolitical tensions such as the war in Europe, and an overall economic slowdown contributed to a decline in M&A activity. Additionally, decreasing confidence among C-suite executives and a wider bid-ask spread between buyers and sellers further reduced dealmaking.

As a result, total M&A volumes dropped by 18% to approximately $3 trillion in 2023, according to data from Dealogic. This marked the lowest level of M&A activity since 2013 when deal volumes were at $2.8 trillion, indicative of the challenges and uncertainties faced by global dealmakers amidst shifting economic conditions and geopolitical risks.

All of this changed when the Federal government started hinting about lowering interest rates in 2024. This week, we look at how this trend stands to benefit our portfolio.

Global M&A volumes
Global mergers and acquisitions volumes from 1998 to 2024.
Source: Bloomberg

Starting bell sounding for an upswing in M&A activity

Despite ongoing macroeconomic and geopolitical uncertainties, signs are pointing to a potential turnaround for dealmaking in 2024. Three key factors support this optimism:

  1. Financial markets have rebounded significantly since the previous year, with expectations for declining interest rates.
  2. Considerable “dry powder” is waiting on the sidelines, coupled with a rise in board confidence.
  3. There is pent-up demand for deals, alongside an ample supply, reflecting a readiness to engage in M&A activity.

Global non-financial listed companies hold $5.6 trillion in cash, while private market investors possess $2.5 trillion in dry powder, providing substantial resources for dealmaking. Additionally, depressed small cap valuations along with structural factors such as advancements in AI, the transition to clean energy, innovation in life sciences, reshoring initiatives and geographic diversification are further driving demand for M&A.

The dismal performance of 2023, marked by the lowest completed M&A volumes in a decade relative to nominal US GDP, underscore the potential for a rebound in deal activity in 2024. So, how big can it get?

We could see up to $9.5 trillion of M&A in 2024

Based on Dealogic’s data, global M&A volume has averaged around $5.5 trillion per year since 2014. With corporations potentially aiming to catch up on the $2 trillion shortfall from the last two years, M&A volumes for 2024 could range from $5.5 trillion to about $9.5 trillion. Actual figures will depend on various factors such as economic conditions, geopolitical stability and corporate strategies.

The underlying drivers are especially visible in markets like Europe that have seen a drought in M&A activity.

Western Europe M&A volumes
Mergers and acquisitions volumes in Europe from 1999 to 2024.
Source: Bloomberg

Looking at Japan, the structural shift towards greater corporate efficiency and activity is notable and expected to drive further M&A activity in the market. Despite the challenges faced by global markets, Japan has managed to maintain positive M&A volumes, demonstrating a resilience and proactive approach among Japanese companies.

Rising costs, stricter governance rules and mounting shareholder pressure are compelling companies in Japan to explore strategic options, including M&A. This trend is part of a broader effort to enhance corporate performance and unlock shareholder value.

Moreover, the potential wave of management buyout (MBO) activity in Japan is bolstered by recent reforms in the Tokyo Stock Exchange and guidelines by the Ministry of Economy, Trade and Industry (METI) for corporate takeovers. These reforms and guidelines are meant to promote shareholder earnings and increasing corporate value, aligning with the goals of enhancing efficiency and profitability.

For Japanese companies, especially those with lower capital efficiency, MBOs present an attractive way to streamline operations, improve governance and maximize shareholder returns. As a result, we can anticipate more M&A and MBO activity in Japan as companies adapt to evolving market dynamics and regulatory environments.

Japan M&A volumes
Mergers and acquisitions volumes in Japan from 1999 to 2024.
Source: Bloomberg

Many other markets like Australia, India, Korea and ASEAN are also expecting heightened M&A activity this year.

How does this impact the portfolio?

The accelerating M&A environment can be positive for smaller companies as their larger counterparts are willing to pay to acquire agile and innovative companies that can provide positive long-term growth perspectives. Furthermore, big companies seem to be diversifying by acquisition type. Larger, maturing companies can lack the same innovation capabilities as small companies to adjust, create and develop faster due to their nimble structure.

How else do we participate in the M&A cycle? 

Another way to capitalize on this trend is by investing in a M&A advisory firm. These companies provide advice on corporate mergers, acquisitions and divestitures as well as debt and equity financing, acting as intermediaries in business sale transactions for either the selling company or the buyer.

We have profited from the M&A theme via Rothschild & Co., a France-based merger and acquisition boutique firm that has generated solid returns for our clients. Also, we recently initiated a position in Evercore, a name we have owned in the past and decided to repurchase because it is poised to outperform its competitors in the M&A space.

Founded in 1995, Evercore is an independent investment bank and asset manager, ranking #1 among independent firms and #4 among all M&A boutiques, including well-known players like Goldman Sachs. The company has a strong and liquid balance sheet, making it an excellent example of an investment that should benefit from the exciting uptick in M&A activity.

Cityscape at sunset captured from a residential skyscraper in downtown NYC.


Michael Mormile, former Citadel portfolio manager, along with Jonathan Hartofilis and Richard Li, are partnering with Connor, Clark & Lunn Financial Group Ltd. (CC&L Financial Group) to jointly launch FortWood Capital (FortWood), a new emerging markets credit investment manager. In connection with the launch, CC&L Financial Group will provide seed capital along with investment from other clients.

FortWood seeks to capitalize on opportunities presented by structural inefficiencies in global emerging markets credit through a diverse portfolio of debt instruments. Michael Mormile explains, “Our approach combines thorough macroeconomic and fundamental analysis with a rigorous risk management framework to effectively manage the complexities of the emerging markets credit landscape and turn inherent market volatility into portfolio strength.”

FortWood’s absolute return and active long-only emerging markets strategies target corporate and sovereign external currency debt. These strategies are designed for clients looking to capture the attractive yields and value discrepancies found in under-researched markets.

“Partnering with Michael, Jonathan and Richard to expand into emerging markets credit is an exciting development for us. The FortWood team’s expertise in these regions and markets provides clients with the opportunity for additional diversification complementary to our existing offerings, along with potentially higher returns,” says Warren Stoddart, CC&L Financial Group’s CEO.

“By joining forces with CC&L Financial Group, we gain not only institutional operational support and global distribution but also a shared culture of excellence that will undoubtedly enhance our ability to focus on what we do best and achieve outstanding results for our clients,” says Michael Mormile.

This partnership, rooted in a strong team and shared principles, positions FortWood and CC&L Financial Group to exploit a growing asset class and new opportunities to deliver better client outcomes.

About FortWood Capital

FortWood Capital specializes in actively managed emerging markets credit strategies. Leveraging its investment expertise and a robust risk management framework, FortWood navigates complex markets and challenging environments to uncover value. Headquartered in Greenwich, Connecticut, FortWood is a part of CC&L Financial Group. For more information, please visit fortwoodcapital.com.

About Connor, Clark & Lunn Financial Group Ltd.

CC&L Financial Group is an independent, employee-owned, multi-boutique asset management firm that partners with investment professionals to build and grow successful asset management businesses. CC&L Financial Group offers through its affiliates a wide array of traditional and alternative investment management products and solutions to institutional, high-net-worth and retail clients. With offices in the US, the UK, India, and across Canada, CC&L Financial Group has over 40 years of history and its affiliates collectively manage approximately US$90 billion in assets. For more information, please visit cclgroup.com.


Media contact:

Rebecca Jan
[email protected]

Global sales contacts:

USA
Eric Hasenauer
[email protected]

Europe & EMEA
Carlos Stelin
[email protected]

Canada
Brent Wilkins
[email protected]

The quarterly commentary in mid-2023 noted that the cycle and monetary analyses were giving conflicting signals. The stockbuilding cycle appeared to be tracing out a low, a development usually associated with stronger performance of equities and other cyclical assets. However, greater weight was accorded to continued weakness in global real narrow money momentum, which suggested downside risk to economic activity and insufficient liquidity to support market gains.

The cycle signal has so far proved the correct one, with cyclical assets rallying strongly over the past five months. Monetary conditions have been more permissive than expected, probably reflecting continued deployment of “excess” money balances left over from the 2020-21 monetary surge, as well as unusual US deficit-financing operations.

What now? Valuations of some cyclical assets appear already to discount a solid and sustained economic upswing. Global real narrow money momentum has recovered slightly but remains negative, while the level of money balances may now be below “equilibrium”. Until money growth normalises, the risk is that an initial stockbuilding cycle recovery will prove disappointingly weak or even fail, with a retest of the 2023 low. A monetary revival, meanwhile, may have been pushed back by major central banks’ caution in reversing 2022-23 policy restriction, although an easing trend is under way in EM.

Commentaries in 2022 argued that the stockbuilding cycle was likely to bottom in 2023, probably in H2, based on the cycle’s 3.33-year average length and the prior low having occurred in Q2 2020. The possibility of an earlier trough was considered, on the view that the current cycle could be shorter than average to compensate for a longer prior cycle (4.25 years).

The key indicator used to monitor the cycle – the annual change in the stockbuilding share of G7 GDP – appears to have reached a major low in Q1 2023. A secondary indicator based on business surveys confirmed this trough in July – see chart 1.

Chart 1

Chart 1 showing G7 Stockbuilding as % of GDP (yoy change) & Business Survey Inventories Indicator

Stockbuilding cycle lows historically were usually associated with nearby major or minor lows in cyclical asset prices. Chart 2 shows the relationship with the relative performance of equity market cyclical sectors, excluding IT and communication services. A cyclical rally gathered pace from April 2023, consistent with a H1 cycle trough.

Chart 2

Chart 2 showing G7 Stockbuilding as % of GDP (yoy change) & MSCI World Cyclical ex Tech* Relative to Defensive ex Energy Sectors *Tech = IT & Communication Services

Why was a scenario anticipated in 2022 sadly underplayed in commentaries last year? The difficulty was that stockbuilding cycle lows historically were preceded by an upturn in global real narrow money momentum – chart 3. A marginal recovery in annual momentum occurred between February and June last year but a relapse to a lower low ensued. With no monetary improvement, and major central banks continuing to tighten into H2, it seemed unlikely that economic news and fund flows would support outperformance of cyclical assets.

Chart 3

Chart 3 showing G7 Stockbuilding as % of GDP (yoy change) & Global* Real Narrow Money (% yoy) *G7 + E7 from 2005, G7 before

One explanation for the disconnect is that real money momentum, while a reliable indicator historically, failed to capture the availability of money to support activity and markets because of an overhang of “excess” balances created by earlier monetary strength. The ratio of the stock of global real narrow money to industrial output at end-2022 was still 4% above its steeply rising pre-pandemic trend – chart 4.

Chart 4

Chart 4 showing Ratio of G7 + E7 Real Narrow Money to Industrial Output* & 1995-2019 Log-Linear Trend *Index, June 1995 = 1.0

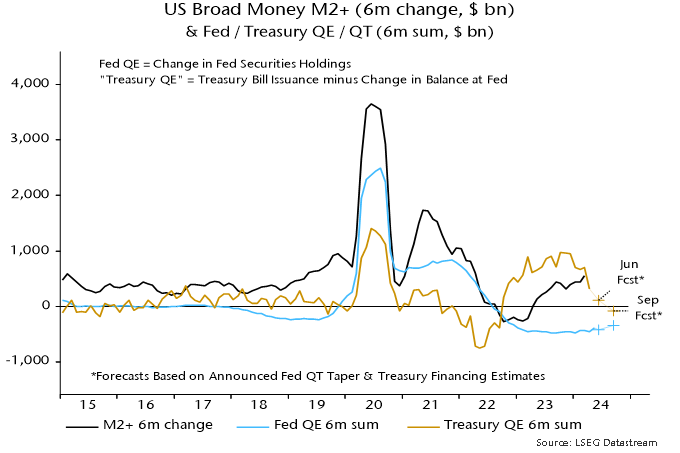
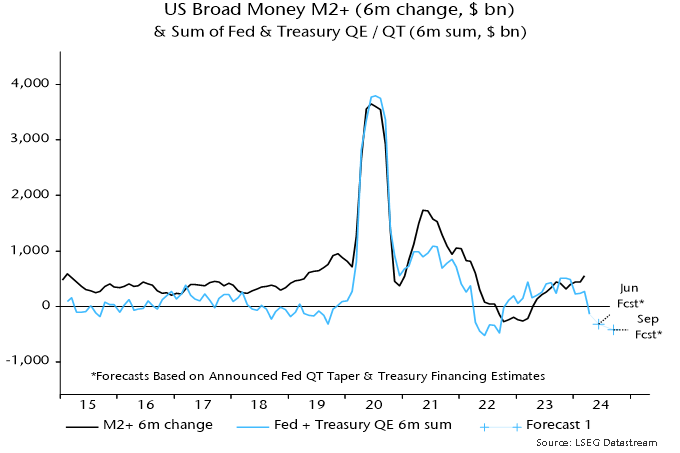
The strength of US equities may also have partly reflected the US Treasury’s decision, following the suspension of the debt ceiling in June, to “overfund” the federal deficit via issuance of bills, which were purchased mainly by money-creating institutions. This had the effect of more than offsetting the monetary drag from the Fed’s QT, while low coupon issuance created space in investors’ portfolios for additional purchases of credit and equities.

Support from these influences should be at or close to an end. The ratio of global real narrow money to industrial output returned to its March 2020 level in mid-2023, moving sideways since and now 4% below the pre-pandemic trend – chart 4. The Treasury’s financing plans, meanwhile, envisage a reduction in the bill float in Q2, raising the possibility of renewed monetary US weakness unless the Fed swiftly tapers QT.

Global real narrow money momentum has firmed again since Q3 2023 but remains negative, in both annual and six-month terms. A revival could, in theory, continue even if major central banks delay policy easing: rising economic confidence could be reflected in a switch out of time deposits and money funds into demand / overnight deposits, while EM money trends may improve further in response to recent policy easing. More likely, a normalisation of money growth will require a significant reversal of 2022-23 DM policy rate hikes.

Without a further rise in real money momentum, the initial stockbuilding cycle recovery may prove disappointingly limp or even fizzle altogether, revisiting the H1 2023 low. Such a scenario would pose a major risk to some cyclical assets now apparently discounting solid / sustained economic growth, such as the DM cyclical equities sector basket – chart 5.

Chart 5

Chart 5 showing MSCI World Cyclical ex Tech* vs Defensive ex Energy Sectors Valuation Z-scores *Tech = IT & Communication Services

How could investors sharing the latter concern and favouring a defensive bias hedge against the possibility that a stockbuilding cycle upswing unfolds normally, implying economic acceleration into 2025? Some cyclical assets have lagged, including industrial commodity prices, the DM materials sector and EM cyclical sectors, which – unlike in DM – are at a low valuation versus defensive sectors relative to history.

Chart 6 shows six-month real narrow money momentum in major countries. The US remains above Europe but the gap has narrowed, while, as argued above, the US recovery could go into reverse into Q2. The UK, meanwhile, has crossed above the Eurozone, suggesting improving relative economic prospects following GDP underperformance in the year to Q4.

Chart 6

Chart 6 showing Real Narrow Money (% 6m)

China was a significant contributor to the recent rise in global real narrow money momentum, following record PBoC lending to banks in Q4. Such lending, however, contracted in January / February and a decline in term money rates has stalled, raising concern that the recovery in money growth will falter.

Other notable features include a pick-up in Australia, continued relative weakness in Switzerland and a relapse in Sweden. The suggestion is that the Australian economy will outperform, delaying rate cuts; by contrast, the Swiss National Bank has already embarked on easing, with the Riksbank expected to follow in Q2.

G7 inflation has continued to moderate in line with a simplistic monetarist forecast based on the profile of broad money growth two years earlier. A note in November 2022 suggested that annual consumer price inflation (GDP-weighted average), then at 7.8%, would fall below 3% by December 2023. The latest reading, for February, was 2.9%.

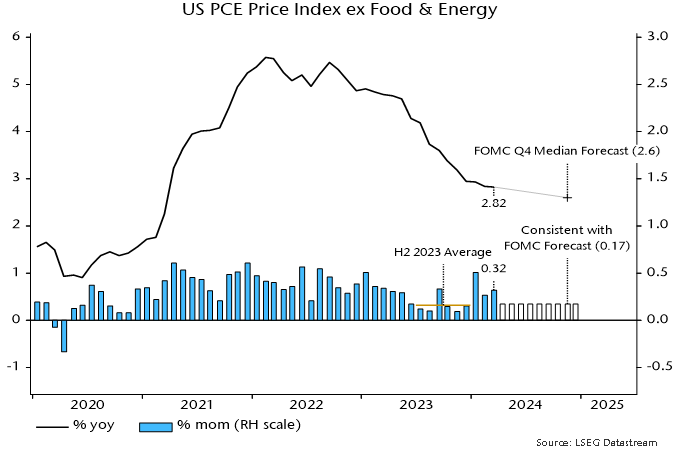
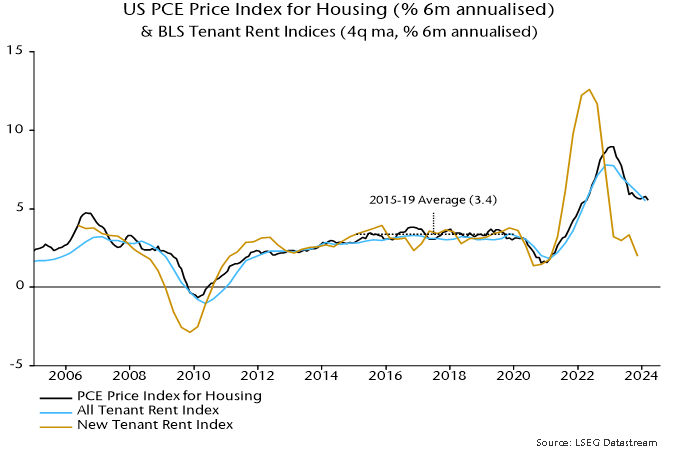
US annual core inflation on the Fed’s favoured PCE measure was 2.8% in February or 2.2% excluding lagging rents. Market concerns about inflation remaining “stubborn” are based on a rebound in shorter-term momentum measures but this has been mainly due to an outsized January gain, possibly reflecting residual seasonality (which could also explain unexpected weakness in late 2023), i.e. these measures are likely to fall back sharply as the January effect drops out.

G7 annual broad money growth continued to decline into April 2023, suggesting that the primary inflation trend will remain down into H1 2025. The reduction to date, however, was accelerated by post-pandemic normalisation of supply chains and weakness in commodity prices – the former effect is over and commodity prices usually rise during stockbuilding cycle upswings. The baseline view here remains that inflation rates will return to target by H2 2024 with significant risk of a subsequent undershoot and no sustained rebound before H2 2025.

Smiling woman holding mobile phone shopping in grocery store.

Food banks in Canada are expecting an 18% increase in demand in 2024 as consumers continue to face cost of living concerns. Last week, Liberal members of the House of Commons finance committee supported an NDP motion to implement an excess profits tax on large grocery retailers to address rising food prices.

Seeking efficiencies in retail

In response, grocery retailers are likely to seek new efficiencies. VusionGroup (Ticker: VU.FP and formerly called SES-imagotag), a recent addition to our portfolio, is positioned as a key player in this scenario, offering cutting-edge digital equipment and software services to help retailers digitalize and optimize their points of sale. The company offers an extensive range of IoT devices, such as electronic shelf labels, video displays, sensors, wireless shelf cameras and smart rails designed to streamline operations and reduce labour for low value-added tasks. Vusion’s in-house software solutions automate pricing and enable efficient inventory management, enhancing the shopping experience and brand marketing efforts.

The shift to electronic shelf labels (ESLs)

Switching to ESLs presents several advantages for retailers, including operational cost reduction and improved pricing flexibility, which can boost revenue and profitability. Changing paper-based labels in stores is labour-intensive and many staff are paid low or minimum wages, a sector that has seen significant raises. Prices displayed on ESLs can be automatically and quickly updated using Vusion’s software, allowing retailers to either reduce staff or reallocate them to higher value-added and customer-facing tasks.

Enhancing efficiency and the retail experience

The automatic pricing feature of ESLs offers additional benefits. Retailers can be more flexible with pricing, quickly adjusting to inflation and the competitive environment, thereby maximizing revenues and profitability. This flexibility also facilitates pricing adjustments, such as promotions on fresh produce, to limit waste. In general, fewer pricing errors improve the overall customer experience.

Another aspect of improving the customer experience is ensuring product availability on shelves. Industry experts estimate sales lost due to lack of products on shelves are around 8% of total revenues for a point of sale. By integrating ESLs and smart cameras, Vusion enables store managers to be automatically notified if a product is running low, prompting shelf replenishment from store inventory or triggering an order for more products. Optimizing inventory management maximizes cash generation at the store level.

Leveraging technology for inventory and online order efficiency

The COVID-19 pandemic accelerated online grocery sales in the US, a trend expected to grow at a rate of over 20% annually. Vusion’s products allow for efficient processing of online orders, with most being fulfilled directly from the stores. ESLs enable “pickers” to be more efficient by providing the fastest route to collect all items in an order. ESLs even flash to indicate where a product can be found, reducing the time employees spend on each order and minimizing the risk of incomplete or incorrect orders. Retailers and fast-moving consumer goods companies can also use ESLs as a marketing tool by implementing targeted promotions and offering coupons to customers.

Conclusion: Vusion’s promising long-term growth

Despite initial challenges due to concerns over battery life, technological improvements have addressed these issues and significant milestones, such as Walmart’s recent large-scale ESL deployment, signal a promising growth trajectory for the technology. Vusion’s leadership in the global ESL market suggests a strong growth outlook, with the potential for widespread ESL adoption and market penetration to the tune of 20% to 30% from approximately 7% today, or up to three billion labels by 2027. Adding replacement labels, smart camera installation opportunities, and cloud and software subscriptions only increases the potential addressable market.

With a dominant market share, a top-tier and broad product range, and strong relationships with major retailers, Vusion is an exciting long-term growth story in our view.