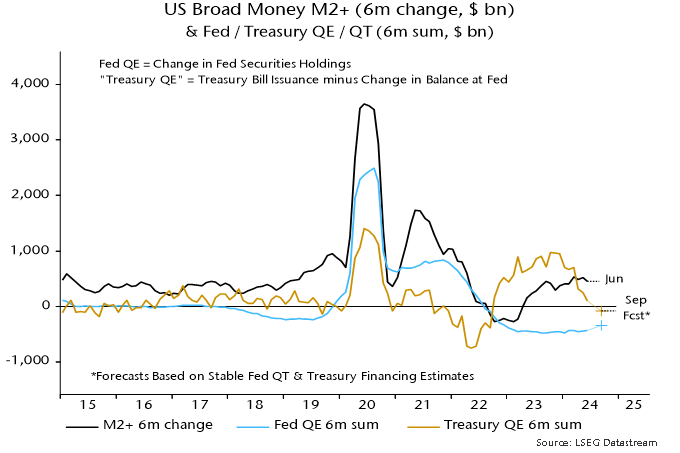
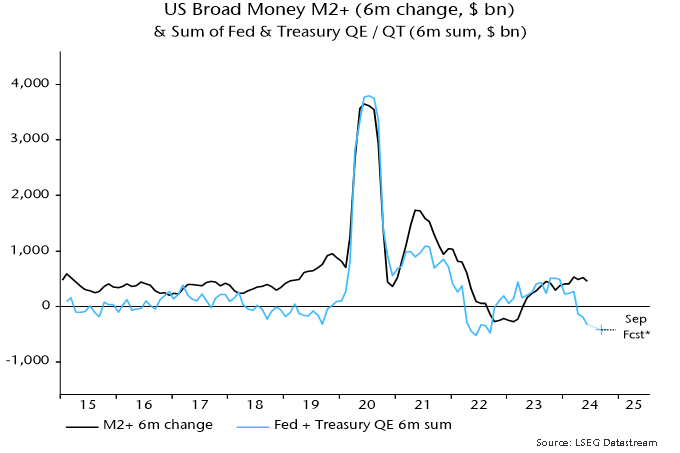
Previous posts suggested that a recovery in US money growth would stall in Q2 / Q3 as Fed QT was no longer offset by monetary deficit financing (at least temporarily).

The broad M2+ measure – which adds large time deposits at commercial banks and institutional money funds to published M2 – fell by 0.1% in April, with available weekly data suggesting marginal growth in May.

Unexpectedly, however, the narrow M1A measure tracked here – comprising currency in circulation and demand deposits – rose by a bumper 1.8% in April. This follows a 1.3% gain in March – see chart 1.

Chart 1

Chart 1 showing US Broad / Narrow Money (% mom)

Positive narrow money divergence typically occurs when rates are falling. Lower rates encourage a shift of money holdings from time deposits and savings accounts to demand deposits and cash. Such a shift is usually a signal of rising spending intentions.

Are money-holders front-running rate cuts? The narrow money pick-up is a hopeful signal but there is a risk that it goes into reverse if the Fed continues to delay.

The impact of the US April rise on the global aggregate calculated here was offset by a large monthly drop in Chinese narrow money, as measured by “true M1”, which corrects for the omission of household demand deposits from official M1.

So the six-month rate of change of global real narrow money was little changed in April, following a move back into positive territory in March – see prior post for more discussion.

US six-month momentum moved to the top of the ranking across major economies in April, while China returned to negative territory – chart 2.

Chart 2

Chart 2 showing Real Narrow Money (% 6m)

Falling interest rates suggest that the Chinese relapse will prove temporary – chart 3 – but the signal for near-term economic prospects is negative.

Chart 3

Chart 3 showing China Narrow Money (% 6m) & 2y Government Bond Yield (6m change, inverted)

Eurozone / UK real narrow money momentum continued to recover in April but remains negative. The current UK lead may prove temporary unless the MPC follows the ECB in cutting rates soon.

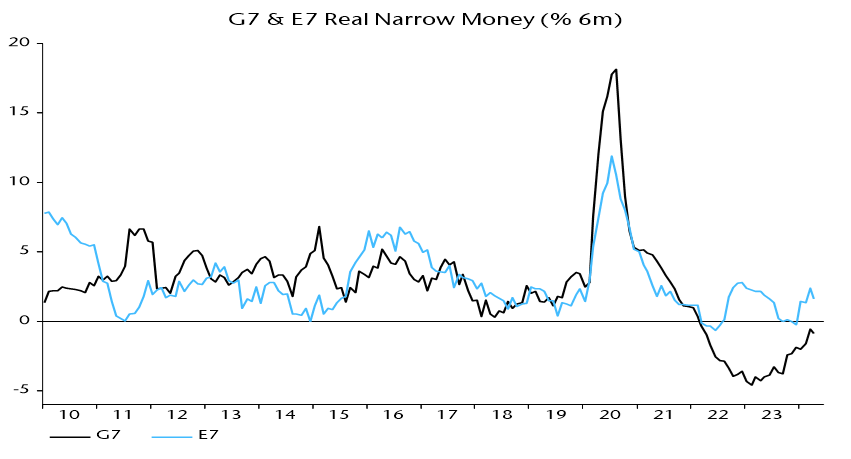
The Chinese relapse resulted in E7 real money momentum falling back in April, while G7 momentum crossed into positive territory – chart 4.

Chart 4

Chart 4 showing G7 + E7 Real Narrow Money (% 6m)

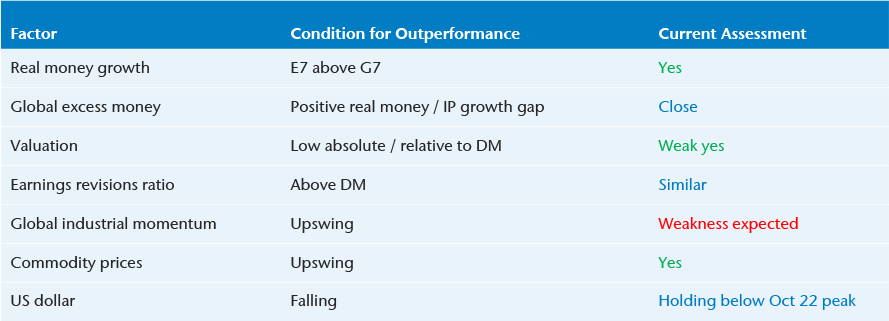
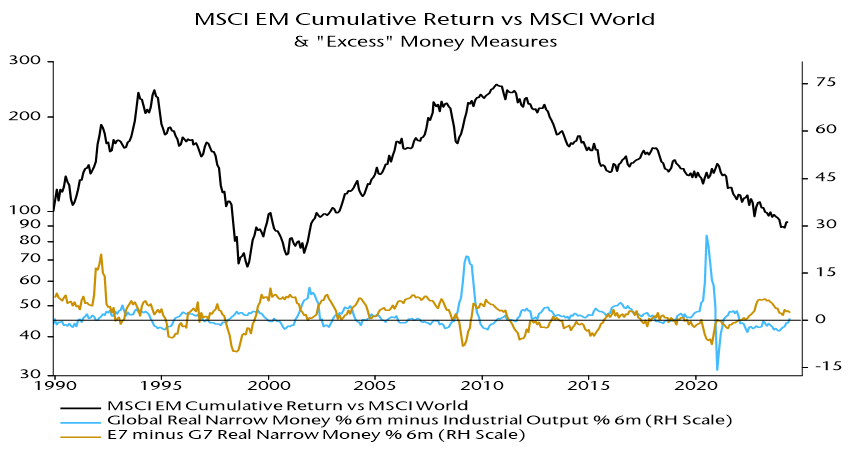
The still-positive E7 / G7 gap coupled with a recent cross-over of global six-month real narrow money momentum above industrial output momentum could signal improving prospects for EM equities. The MSCI EM index outperformed MSCI World by 10.5% pa on average historically under these conditions.

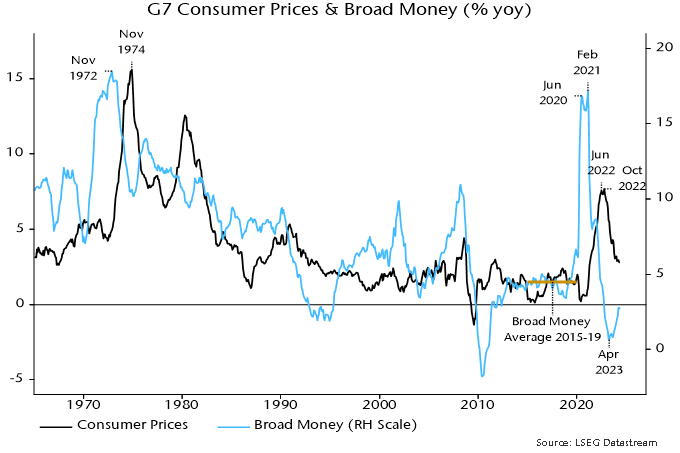
G7 annual broad money growth recovered further in April but, at 2.8%, remains well below a 2015-19 average of 4.5% – chart 5.

Chart 5

Chart 5 showing G7 Consumer Prices & Broad Money (% yoy)

The roughly two-year leading relationship suggests that annual inflation will bottom out in H1 2025 but remain at a low level into H1 2026.

Silhouette of high voltage towers and a colourful sky.

As we approach the start of summer, the need for cooling adds additional pressure to the grid, especially at peak hours. The Electricity Reliability Council of Texas (ERCOT) recently warned that reserve margins will be squeezed as temperatures are expected to rise. Last year, ERCOT asked customers multiple times throughout the summer to reduce their power consumption to limit the risks of blackouts. Many other states across the US face similar situations, and there are ways for individuals and corporations to alleviate the stress of heightened energy demand on the grid, namely through energy efficiency retrofits. Energy efficiency is often referred to as the low-hanging fruit of the energy transition and is a theme we are paying attention to.

The role of energy efficiency

Energy efficiency is the act of using less energy to perform the same function, such as heating a home or running a dishwasher. Reducing energy demand not only allows the grid to run more smoothly but also enables cost savings for consumers. To promote the quicker adoption of energy efficiency retrofits, the US has been taking both a carrot and stick approach through incentives along with regulations. To date, there are over 1,072 rebate programs in place in the US for both individuals and corporations to take advantage of. Over the next few years, it is expected that the investment in energy-efficient buildings and initiatives will double, providing many interesting investment opportunities.

HVAC: A major energy savings opportunity

One way that we are exposed to the energy efficiency theme is through commercial and industrial HVAC (heating, ventilation and air conditioning) solutions and equipment. Within a home or a building, heating and cooling uses the most energy. Typically, by upgrading equipment to state-of-the-art models, energy savings can be anywhere from 20% to 50%. Every year in the US, over $14 billion is spent on HVAC equipment either through new installations or repair and replacement. In April 2024, the Department of Energy (DOE) announced four consensus-based efficiency standards that are expected to save Americans billions on utility bills. A recent addition to the portfolio is poised to benefit from the stricter standards.

AAON’s commitment to innovation

While decarbonization and energy transition are secular trends that have gained popularity in the last few years, our holding AAON (AAON US) has been delivering HVAC equipment since 1988. Since then, AAON has focused on providing commercial and industrial customers with the highest quality equipment, saving them both energy and dollars. As the DOE released updated guidance on spec requirements for HVAC equipment, AAON was not required to update any of its equipment as it already met all the minimum requirements. Innovation and R&D have always been at the heart of company, which have led it to develop some of the most efficient and best-performing equipment on the market. Compared to peers, AAON spends the highest percentage as a proportion of sales on R&D, which we believe is an important piece of the company’s competitive advantage.

Efficiency today, savings tomorrow

Investing in energy efficiency brings multiple benefits. By adopting HVAC solutions and other retrofits, we can reduce the strain on the grid, lower costs and contribute to a more sustainable future. We believe making these changes now can lead to long-term gains for both individuals and businesses.

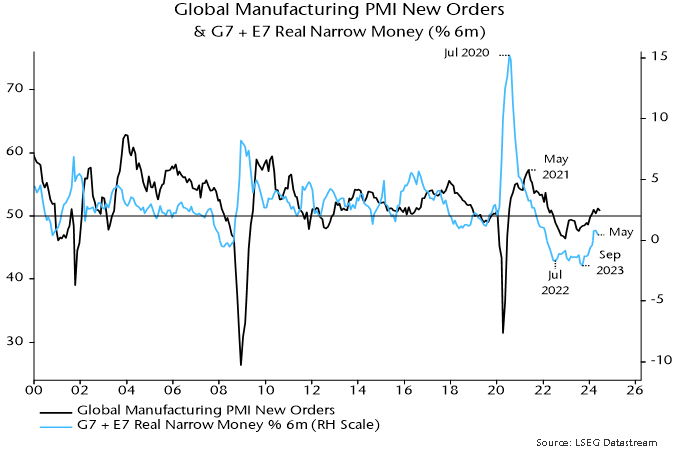
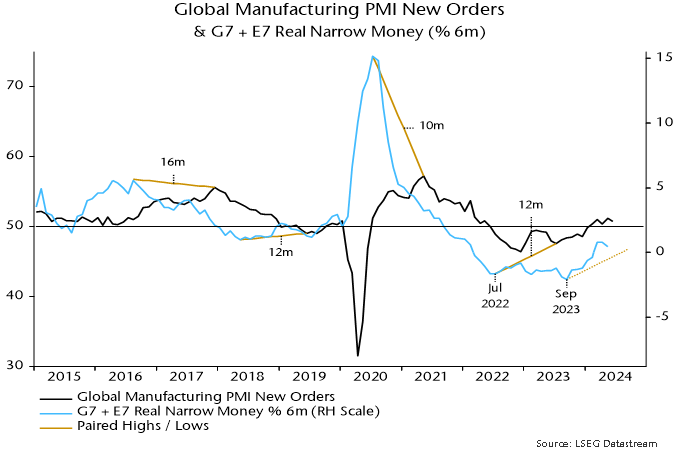
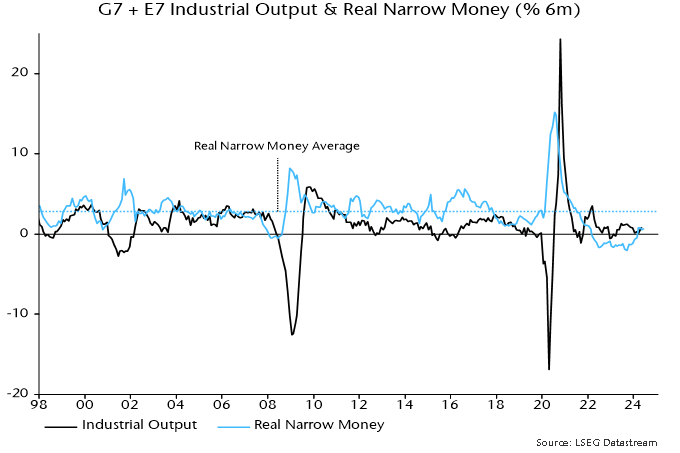
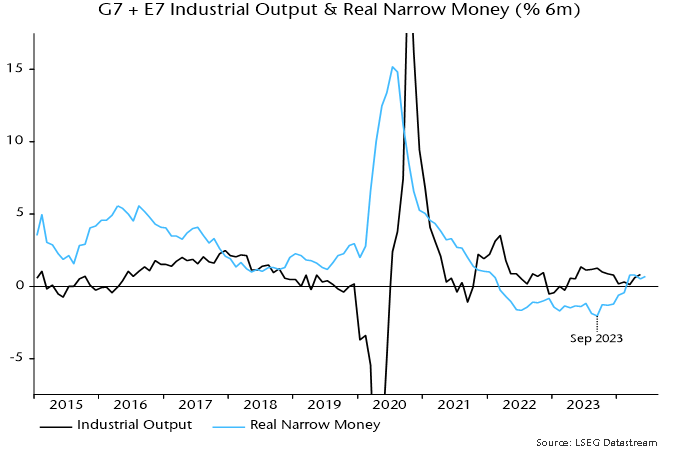
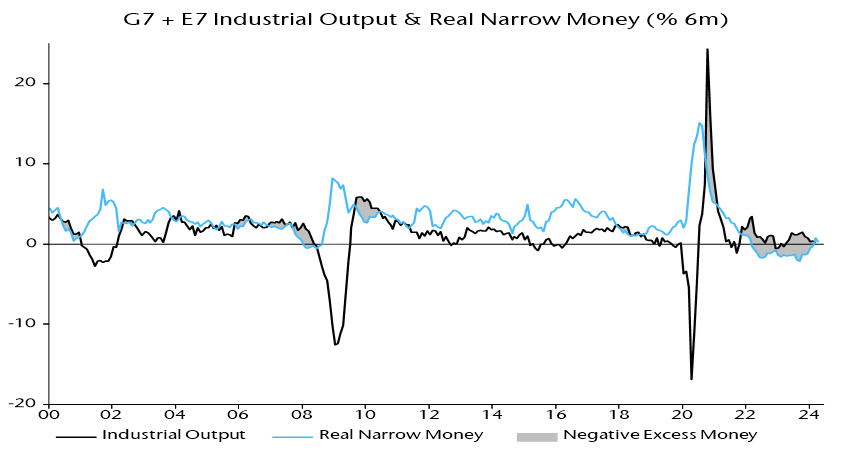
Global (i.e., G7 plus E7) six-month real narrow money momentum returned to positive territory in March, consolidating in April. It has also crossed above six-month industrial output momentum, turning one measure of global “excess” money positive – see chart 1.

Chart 1

Chart 1 showing G7 + E7 Industrial Output & Real Narrow Money (% 6m)

Should investors, therefore, adopt a positive view of economic and market prospects? The judgement here is no – or at least, not yet.

Six-month real narrow money momentum bottomed in September 2023 and lows have preceded those in industrial output momentum by between four and 14 months so far this century. This suggests that a recent decline in output momentum will bottom out by December.

The lag may be at the top end of the range on this occasion, for three reasons.

First, lags tend to be longer when real money momentum reaches extremes, and the September reading was the weakest since 1980.

Secondly, the real money stock is below its long-run trend relationship with industrial output – chart 2. A prior overshoot cushioned the impact of a negative rate of change in 2022-23; the reverse effect could apply in 2024-25.

Chart 2

Chart 2 showing Ratio of G7 + E7 Real Narrow Money to Industrial Output* & 1995-2019 Log-Linear Trend *Index, June 1995 = 1.0

Thirdly, prior recoveries in real money momentum from negative to positive were followed by a recovery in output momentum always in the context of a positively-sloped yield curve (10-year government bond yield minus three-month money rate) – chart 3. The curve is still inverted.

Chart 3

Chart 3 showing Global* Industrial Output (% 6m), Real Narrow Money (% 6m) & Yield Curve *G7 + E7 from 2005, G7 before

The recovery in real narrow money momentum is a hopeful signal for H1 2025 but there remains a risk of surprisingly negative economic data over the next six months. A pessimistic bias will be maintained until real money momentum returns to its long-run average and the yield curve disinverts.

The cross-over of real money momentum above industrial output momentum is similarly judged to be a necessary but not sufficient condition to adopt a positive view of market prospects.

Global equities have outperformed cash on average historically only when a positive real money / industrial output momentum gap partly reflected above-average real money expansion (measured as a 12-month rate of change). The latter condition is unlikely to fall into place before late 2024 at the earliest.

The current combination was associated with mixed equity market performance with some notably bad periods, e.g. mid-2001 and late 2008 / early 2009 – chart 4.

Chart 4

Chart 4 showing MSCI World Cumulative Return vs USD Cash & Global “Excess” Money Measures

Decoration.

Banyan Capital Partners (“Banyan”), a leading Canadian middle-market private equity firm, is pleased to announce its acquisition of Stagevision Inc. (“Stagevision” or the “Company”). Stagevision marks Banyan’s third platform investment through Banyan Committed Capital LP, an evergreen investment vehicle established in December 2021.

Founded in 1984, Stagevision is one of the largest Canadian-owned providers of audiovisual, staging and event management services for live, virtual and hybrid events. While headquartered in Mississauga, Ontario, the Company maintains a well-recognized customer base in both Canada and the United States.

Banyan is partnering with the Company’s CEO, Scott Tomlinson, who has served in this role since 2021. As part of the investment, Scott and the management team will acquire a minority ownership in the Company.

“We are thrilled to be partnering with Banyan Capital Partners. This partnership represents a significant milestone in our company’s history and Banyan’s dedication to a long-term investment philosophy aligns with our objectives to continue to grow our business throughout North America,” said Scott Tomlinson, CEO of Stagevision.

“Our partnership with Stagevision underscores the exceptional business it has built on the foundation of quality service and technical expertise. Banyan is excited to partner with Scott and his team as they enter a new phase of growth,” said Matthew Segal, Managing Director and Partner at Banyan Capital Partners.

About Stagevision

Founded in 1984, Stagevision provides a range of services in professional audiovisual production and management, including the assembly of sets and soft good products, short-term rental of audiovisual equipment, and simultaneous interpretation services to businesses and related agencies across both Canada and the United States.

About Banyan Capital Partners

Founded in 1998, Banyan Capital Partners is a leading Canadian private equity firm investing in middle-market companies throughout North America. Banyan’s long-term investment approach and successful track record in providing full or partial liquidity to founders, families and entrepreneurs helps take businesses to the next level. For more information, please visit banyancapitalpartners.com.

Banyan is part of Connor, Clark & Lunn Financial Group Ltd., an independent , employee-owned, multi-boutique asset management firm with over 40 years of history and offices across Canada and in the US, the UK and India. Collectively managing over C$127 billion in assets, CC&L Financial Group and its affiliate firms offer a diverse range of traditional and alternative investment products and solutions to institutional, high-net-worth and retail clients. For more information, please visit cclgroup.com.

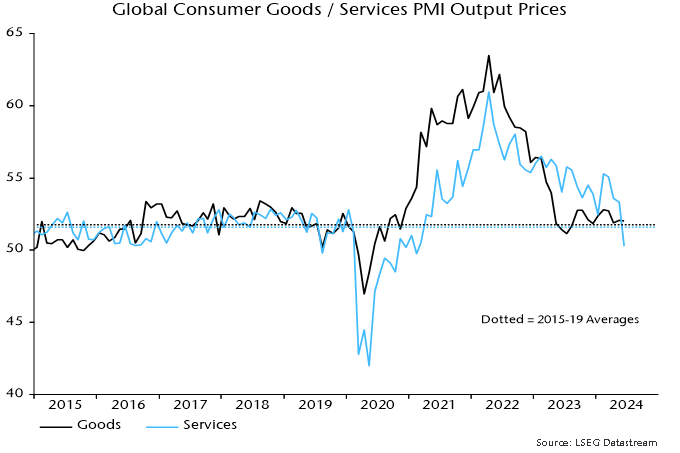
The MPC’s forecast in November was that annual CPI inflation would average 3.5% in Q2 2024 (November 2023 Monetary Policy Report (MPR), modal forecast assuming unchanged 5.25% rates). April’s drop to 2.3%, therefore, might be considered cause for celebration.

The negative market response reflected stronger-than-expected services price inflation, with the Bank of England’s “supercore” index rising by an annual 5.7%, a disappointingly small drop from 5.8% in March. This measure strips out “volatile and idiosyncratic” components, namely rents, package holidays, education and air fares.

The MPC has encouraged a focus on services inflation, citing it as one of three key gauges of “domestic inflationary persistence”, along with labour market tightness and wage growth. This prioritisation, however, is questionable, as there is no evidence that supercore leads other inflation components, whereas those components appear to contain leading information for supercore.

Chart 1 shows annual rates of change of three CPI sub-indices: supercore services (34% weight); other components of the core CPI index, i.e. core goods and non-supercore services (43%); and energy, food, alcohol and tobacco (22%).

Chart 1

Chart 1 showing UK Consumer Prices (% yoy)

Correlation analysis of this history suggests that supercore follows the other two series: correlation coefficients are maximised by applying a five-month lag on the other core components measure and a four-month lag on energy / food inflation.

Granger-causality tests show that inflation rates of the other core components sub-index and energy / food are individually significant for forecasting supercore. By contrast, supercore terms are insignificant in forecasting equations for the other two sub-indices*.

These results admittedly are strongly influenced by post-2019 data: supercore lagged the inflation upswing and peaked later than the other components.

A notable finding is that supercore inflation has been more sensitive to changes in energy / food prices that the rest of the core index, conflicting with the notion that it is a purer gauge of domestic inflationary pressure. This is partly explained by the one-third weight of catering services in the supercore basket: the associated price index is strongly correlated with food prices.

A forecasting equation for supercore including both other sub-indices predicts a fall in annual inflation to 4.7% in July.

The latest MPR claims that monetary trends are of limited use for inflation forecasting over policy-relevant horizons. Lagged terms in broad money growth, however, are significant when added to the above forecasting equation. The July prediction is lowered to 4.5% with this addition.

A fall in annual supercore inflation to 4.7% in July would imply a dramatic slowdown in the three-month annualised rate of change (own seasonal adjustment), from over 6% in April to below 3%.

A “monetarist” view is that aggregate inflation trends reflect prior monetary conditions, with the distribution among components determined by relative demand / supply considerations. From this perspective, supercore strength is partly the counterpart of weakness in the other sub-indices. Headline CPI momentum continues to track the profile of broad money growth two years ago, a relationship suggesting a further easing of aggregate inflationary pressure into H1 2025 – chart 2.

Chart 2

Chart 2 showing UK Consumer Prices & Broad Money (% 6m annualised)

*The regressions are based on 12-month rates of change and include lags 3, 6, 9 and 12 of the dependent and independent variables.

Shelves of medicines in a pharmacy.

It’s springtime and, although most Global Alpha employees are close to putting Q1 earnings season behind them, some of us are getting ready to start dealing with allergy season. Trying to make the most of our situation, we tried to see if we could profit from this annual annoyance.

What’s the problem with allergies?

For most people who suffer from allergies, this only implies a runny nose and watery eyes, but it also impacts millions of people more significantly through sleepless nights, shortness of breath and asthma. A recent European survey found that 80% of respondents suffering from allergies mentioned the condition affecting their daily activities considerably. Additionally, untreated or poorly treated allergies can lead to serious health complications.

The ramifications of allergies are amplified by the fact that it affects children disproportionately, impacting sleep schedules and consequently school performance. Multiple studies have found that children who are allergic to pollen can see their grades drop an entire level if their condition strikes during exams. There is also a clear, although not properly explained, positive correlation between higher GDP per capita and the proportion of population with some form of allergy. This suggests that its effects on society are likely to get worse over time if nothing is done to address it.

Allergies as an investment opportunity

Given all this, it makes sense why allergy treatment is getting more attention and resources from pharmaceutical companies. The global allergy treatment market was $20.8 billion in 2022, with expectations to reach $38.9 billion in 2032. The Asia-Pacific region is expected to experience the fastest growth given its quickly growing middle class and increasing awareness of treatment options.

According to the WHO, allergies are now the fourth-largest pathological condition after cancer, AIDS and cardiovascular diseases. Over 500 million people globally have some form of allergy, with the majority self-treating with over-the-counter medicine without seeing a medical professional. This has driven massive investments in allergy treatments among virtually every major pharma company.

Curing allergies with a simple tablet?

In comes one of our holdings: ALK-Abello (ALKB DC). It is the world’s largest provider of allergy immunotherapy solutions with more than 35% market share. It provides its products in three different formats: injections, sublingual drops and tablets (the latest addition to the product line and largest opportunity). Most of its revenue is from Europe, with the rest coming more or less evenly from North America and APAC. Its market share in Japan is 97%, but adoption has yet to catchup to Europe standards.

Immunotherapy is one of the most exciting treatment methods for allergies, as it attempts to rebalance the immune system to avoid triggering the undesired reaction and thus provides a more permanent solution than alternatives. ALK’s products treat the five most common respiratory allergies (dust mites, grass, trees, ragweed, Japanese cedar), which together account for close to 80% of allergy cases in the world. The company differentiates itself from peers with its unique clinical data sets that not only assist in developing new products, but also help increase penetration by providing evidence-based insights to prospects and customers.

Where will the growth come from?

  • Obtaining full approvals for its tablet portfolio for young patients, especially the pediatric segment.
  • An ongoing trial for peanut allergy treatment opens the opportunity for a new business segment.
  • Increasing awareness of treatments for allergies in various geographies.
  • New partnerships for distribution.

Spirit Island and Maligne Lake at dusk. Jasper National Park, Alberta, Canada.

Our annual Responsible Investment (RI) Report outlines our Affiliates’ ongoing commitment to sustainable investment practices and efforts to have a positive impact on people and planet through how we manage our own business.

2023 key achievements and initiatives

  • Active owners: Encourage companies to effectively manage material ESG risks and opportunities through our stewardship and engagement efforts.
  • Industry collaboration: Active participation in initiatives like the Canadian Coalition for Good Governance and Climate Engagement Canada that support effective capital markets operations and promote a unified industry voice.
  • Corporate Social Responsibility commitment: Strong commitment to societal impact through CSR policies prioritizing work environment, employee health and wellness and environmental stewardship.
  • Affiliate achievements: Notable successes include Crestpoint’s Zero Carbon certification of Arthur Erickson Place, CC&L Infrastructure’s Energy Transition Strategy and our Affiliates’ continued efforts to enhance their approach to incorporating ESG risks and opportunities in the investment process.


For further details on how our Affiliates are implementing their responsible investing approach, please visit their websites.

A Canadian ten dollar bill on a background of dollar bills

This summary provides a perspective of the modern-day history of Canadian-US dollar exchange rate fluctuations. Figure 1 shows the level of month-end exchange rates from 1953 to March 31, 2024.

Figure 1: History of Canadian-US Exchange Rates


1953-1960 The Canadian dollar spent much of 1953 to 1960 in the $1.02 to $1.06 (US) range. It topped out at $1.0614 (US) on August 20, 1957. Until 2007 this was considered the modern-day peak for the Canadian dollar versus the US currency. The Canadian dollar was at $2.78 (US) in 1864 during the US Civil War, but in those days, it was pegged to the gold standard, a practice the US had already abandoned.
1961-1969 In the early 1960s, the Bank of Canada governor James Coyne and Prime Minister John Diefenbaker were on different economic paths. The government wanted expansion while Coyne wanted to maintain a tight money supply. Coyne subsequently resigned and in May 1962, the government pegged the Canadian dollar at 92.5 cents (US) plus or minus a 1% band.
1970-1972 In May 1970, with rising inflation and serious wage pressures, the Trudeau government allowed the Canadian dollar to float. It drifted to parity with the US dollar by 1972.
1974 On April 24, 1974, the Canadian dollar reached $1.0443 (US). This was the high point for the dollar from when it entered its most recent float period and would not trade at these levels again for another 30 years.
1976- 1986 In November 1976, René Lévesque became Premier of Quebec with a platform that promoted political independence for Quebec. A slide in the Canadian dollar resulted, lasting into the first half of the 1980s. This was a period characterized by rising inflation and interest rates. The Bank of Canada’s key interest rate reached 21.2% in 1981, and the Canadian dollar hit an all-time low of 69.13 cents (US) on February 4, 1986.
1987- 1997 The Canadian dollar rose through the latter part of the 1980s and early 1990s, and on November 4, 1991, reached 89.34 cents (US). This was the high point for the 1990s.
1998-2002 Budget deficits, weaker commodity prices and the aftermath of the international crisis in 1998 in the emerging markets of Russia and Latin America, saw a downward path for the Canadian dollar. On January 21, 2002, the Canadian dollar hit its all-time low against the US dollar dropping to 61.79 cents (US). At this level it cost $1.62 CDN to buy $1 US.
2003- 2006 Through 2003 to 2006, the Canadian dollar started to appreciate sharply driven by a robust global economy that boosted prices of Canada?s commodity exports and pushed the Canadian dollar above 90 cents (US).
2007 On September 20, 2007, the Canadian dollar reached parity with the US dollar for the first time in close to 31 years, with a 62% rise in less than six years driven in part by record high prices for oil and other commodities. The Canadian dollar was named the Canadian Newsmaker of the Year for 2007 by the Canadian edition of Time magazine.
2008- 2009 The Canadian dollar continued to trade near parity in the first half of 2008, but then started a decline that saw it drop below 80 cents (US).
2010 After a strong bounce back, the Canadian dollar reached parity for the first time in 20 months in April 2010.
2011 At the height of the commodity boom, the Canadian dollar reached $1.06 (US) on July 21, 2011. It then experienced its fastest decline in modern-day history as commodity prices rapidly deteriorated.
2016 The Canadian dollar fell to 68.68 cents (US) on January 19, 2016, approximately 7 cents (US) from its historic low, before starting to strengthen against the US dollar and finishing the year at 74.57 cents (US).
2017- 2024 Currency fluctuations have been somewhat muted since 2016, although the Canadian dollar dipped back down to around the 70 cents (US) mark in March 2020 during the outset of the COVID pandemic. The Canadian dollar subsequently strengthened and stood at 73.90 cents (US) at the end of March 2024.


Figure 2 shows the history of exchange rates from 1970 and therefore captures the modern-day experience with respect to the Canadian dollar versus the US dollar relationship.

Figure 2: Canadian-US Exchange Rates


Over the period, there have been three major declines in the value of the Canadian dollar, which from peak to trough were each down a little over 30%. The first two declines took around 10 years, while the most recent experienced the fastest decline, which was in part due to the swift collapse in oil prices.

Since the last trough in 2016, the Canadian dollar has moved in a relatively narrow range even accounting for the uncertainty associated with the COVID-19 pandemic and the current high levels of inflation. The Canadian dollar was valued at 73.90 cents (US) at the end of March 2024 and would have to fall below 68.68 cents (US) to test what was previously thought to be the low point for the most recent peak to trough.

Sources: Bank of Canada, CBC, Globe & Mail.

Highways and metro trains in Jaipur, the Pink City.

Given the trend towards increasing deglobalization, friend-shoring, diversity and the acceleration of these themes post-pandemic, the focus on efficient and robust supply chains has intensified. Moving manufacturing plants to reduce risk, India is one of the main beneficiaries of the China+1 strategy.

The bottleneck of logistics infrastructure

India’s main issues are its logistic infrastructure and overall spending as a percentage of GDP. Currently, India spends approximately US$400 billion, 15% of GDP, compared to around 10% for the US/Europe and 9% for China. The logistics sector has a major impact on India’s cost, efficiency and manufacturing and exporting capacity. India is a major exporter of agricultural products, pharmaceuticals and textiles.

Government interventions

One of the major steps was the introduction of the Goods and Service Tax (GST) across India in July 2017. This moved the unorganized market to the organized market (an ongoing process), helping to reduce tax evasion and increase the traceability of merchandise from origin to destination. Today, a GST-registered operator cannot transport goods in a vehicle whose value exceeds Rs.50,000 without an eWay bill.

Revolutionizing toll payments with FASTag

Wait times between states were a major bottleneck due to the collection of taxes, verification and bribes. To solve the problem, the National Highway Authority of India (NHAI) implemented an electronic toll system called FASTag that enables drivers to pass through toll plazas without stopping for transactions. Using RFID technology, toll payments are made directly from the prepaid account linked to the toll owner. In 2016, 70% of tolls had the technology implemented; however, only 4.8% of total payments were collected via FASTag. To increase adoption, NHAI increased the non FASTag cost to 200%, which pushed users to adopt it to reduce costs. As of 2022, 96% of total payments were made through FASTag, increasing efficiency across the logistics industry.

Multi-modal transportation meeting diverse needs

The demand for logistics services in India is witnessing growth across various modes of transportation, including rail, road, air and sea. Rail freight, facilitated by initiatives like Dedicated Freight Corridors (DFC), is gaining traction due to its cost-effectiveness and reliability. Similarly, trucking remains a dominant mode for last-mile connectivity, driven by the e-commerce boom and expanding retail networks. Furthermore, the emergence of e-commerce giants has propelled demand for air and sea freight, necessitating efficient cargo handling and multimodal connectivity.

Several industries in India are heavily reliant on efficient logistics operations to sustain their growth momentum. E-commerce, retail, FMCG, automotive and pharmaceutical sectors are among the key beneficiaries, leveraging logistics to streamline supply chains, reduce lead times and enhance customer satisfaction. Additionally, the rapid expansion of cold chain logistics is enabling the seamless distribution of perishable goods, catering to evolving consumer preferences and market dynamics.

Ambitious growth plans for national infrastructure pipeline

In 2020, the Union Minister for Finance & Corporate Affairs released the Task Force’s Final Report on National Infrastructure Pipeline (NIP) for FY 20-25, with a target investment of US$1.4 trillion. Infrastructure projects are expected to be completed by 2025, with 21% from the private sector. Given that most transportation is done on the surface, India’s roads and highways have been a main focus, increasing from 6,061 kms in 2016 to 10,457 kms constructed in 2022.

With all these investments, the government estimates that India’s transportation and logistics sector is poised to grow at a compounded annual growth rate (CAGR) of around 4.5% from 2022 to 2050.

Major plans for Indian transport infrastructure
Diagram of major plans for India transport infrastructure, namely roads, airports, railways, ports and logistics and key enabling policies supporting the targets.
Source: Building the future: Infrastructure investment opportunities in India by EY Parthenon.

TCI Express: A logistic player benefiting from government spending

TCI Express provides delivery solutions in India and internationally. Most of the transportation is surface-related, although the company does offer air express. TCIEXP is one of the few companies that can deliver to every pin code in India due to its extensive network of sorting/delivery centres.

Capitalizing on the express segment boom

TCIEXP is part of the express segment of logistics, which has a CAGR of 12% and 18% for air and ground, respectively, during the last 10 years (Source: B&K Securities). The industry is dominated by the unorganized space, which represents 80%, where individuals own one to five trucks in their fleet, offering highly competitive services.

The organized space represents 20% of the industry and within it, 75% is owned by large competitors and 25% by SMEs. TCIEXP benefits from government interventions by being the lowest-cost producer within express logistics, allowing it to capture market share from those moving from unorganized to organized.

Asset-light model driving high returns

Operating as an asset-light business, the company doesn’t own its fleet; it outsources distribution to a third party, resulting in over 20+% ROIC. It retains loyalty by offering favourable terms such as return loads, creating loyalty amongst drivers. The company launched its first automated centre in India in 2023 and plans to open another four within the next two years, resulting in lower trucking wait times and increased inventory turnover for clients.

Is India’s logistics revolution a global turning point?

As the country invests heavily in infrastructure and embraces technology, it stands on the brink of transforming its supply chain capabilities. For businesses and policymakers alike, the challenge and opportunity lie in navigating these changes to foster growth and efficiency. How will India leverage this chance to become a leading hub for global trade? The world is watching, and the stakes are high.

USD sales by monetary authorities in Japan, China and other Far East economies have probably topped $100 billion since April, exceeding intervention around the October 2022 dollar peak.

Market estimates are that JPY purchases / USD sales by the Bank of Japan on behalf of the Ministry of Finance on 29 April and 1 May totalled about ¥9 trillion / $ 57 billion. Official numbers covering the period from 26 April will be released next week.

Previous record monthly JPY purchases of ¥6.35 trn in October 2022 were associated with a USDJPY decline of 11.5% from October through January 2023 (month average data) – see chart 1.

Chart 1

Chart 1 showing USDJPY & MoF USD Intervention (¥ trn)

Chinese intervention is best measured by the sum of net foreign exchange settlement by banks and the change in their net forward position, since currency support operations are often conducted via state-owned financial institutions rather than by the PBoC using official reserves (h/t Brad Setser).

This series suggests USD sales of $53 billion in April, the largest since December 2016. Increased pressure for currency support had been signalled by a blow-out in the forward discount on the offshore RMB – chart 2.

Chart 2

Chart 2 showing China Net F/x Settlement by Banks Adjusted for Forwards ($ bn) & Forward Premium / Discount on Offshore RMB (%)

The Bank of Korea may have sold about $5 billion in April, judging from the change in value of reserves. With other Far East authorities also intervening, total USD sales may have exceeded $115 billion.

Intervention is more likely to be effective when supported by shifts in “fundamentals”.

The Bank of Japan’s real effective rate index, based on consumer prices, is at its lowest level since the late 1960s – chart 3*.

Chart 3

Chart 3 showing Japan Real Effective Exchange Rate Based on Consumer Prices, 2020 = 100, Source: Bank of Japan

The USDJPY exchange rate has been tracking the 10-year US / Japan government yield spread but there was a negative divergence at the most recent dollar high – chart 4.

Chart 4

Chart 4 showing USDJPY & 10y Treasury / JGB Yield Spread

Major USDJPY turning points historically were usually preceded by a reversal in the US / Japan relative trade position, which peaked around a year ago – chart 5.

Chart 5

Chart 5 showing USDJPY & US minus Japan Trade Balance as % of GDP (4q ma)

Trade deficits have narrowed in both countries but Japan’s improvement has been sharper, reflecting greater sensitivity to lower energy costs.

US futures data show that speculators (i.e. non-commercials) have been (correctly) long the dollar since March 2021, i.e. for three years and two months. The record unbroken long position occurred between 2012 and 2016, lasting three years and three months before a major reversal – chart 6.

Chart 6

Chart 6 showing USDJPY & Speculative Futures Position* *Net Long as % of Open Interest

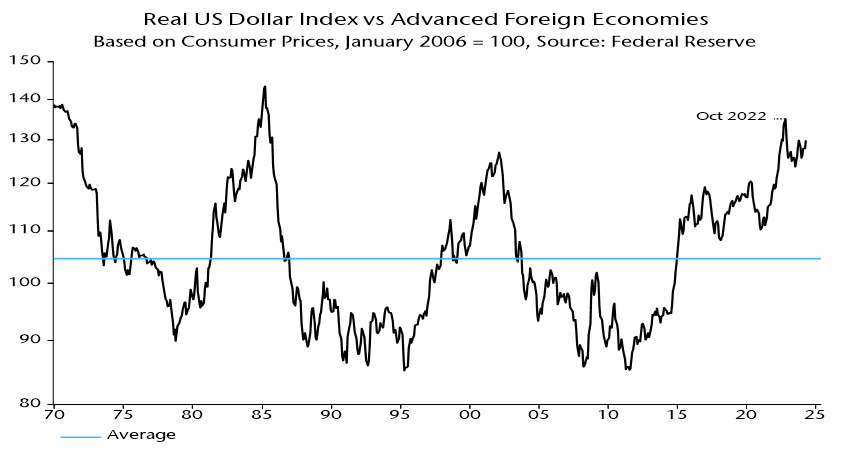
The Fed’s real dollar index against advanced foreign economies peaked in October 2022 at a 29% deviation from its long-run average, within the range at secular tops in August 1969, March 1985 and February 2002 – chart 7**. Those peaks occurred six to seven years before lows in the 18-year (average length) housing cycle. The dollar trended lower into and beyond those cycle troughs. Assuming a normal cycle length, another such low is scheduled for the late 2020s.

Chart 7

Chart 7 showing Real US Dollar Index vs Advanced Foreign Economies Based on Consumer Prices, January 2006 = 100, Source: Federal Reserve

*The BoJ index starts in 1970; earlier numbers were estimated using data on the nominal effective rate and Japanese / G7 consumer prices.

**The Fed index starts in 1973; earlier numbers were estimated using data on the nominal effective rate and US / G7 consumer prices.