Scott shared his proudest professional accomplishment from last year and a goal for the upcoming year in the newest issue of Middle Market Growth Magazine.

Female engineer using a tablet computer at an electronics factory, monitoring the progress through online software.

Profiting as an investor occurs in the delta between expectations and reality. One example is the boom in enthusiasm for AI stocks being fuelled by blockbuster earnings of industry monopolies such as Nvidia consistently outpacing consensus forecasts.

In emerging markets, India’s bull market stands out as the obvious example of this. India has long appeared perpetually expensive to investors relying on mean reversion tables. The problem with this approach is that expectations may be out of kilter with reality when there is structural change occurring – much like in the new AI frontier and the domain of the economy is expanding. The chart from Jefferies below illustrates this structural shift.

India is climbing the development ladder – on track to be the 3rd-largest economy globally
Bar graph showing India’s GDP growth from 2000 projected to 2027.
Source: Jefferies, Q1 2024.

A succession of reforms in Modi’s India is unlocking a virtuous circle of development, including:

  • Sanitation in every village empowering women in rural areas to become economic agents.
  • Establishing a nationwide digital payments network accessed through biometric identification, allowing even the illiterate to transact and access welfare payments.
  • That network allows the government to accurately calculate what taxes citizens owe, which has seen the state tax take double in around five years.
  • Higher government revenues alongside private investment are helping to fuel a new capex cycle, targeting electrification, ports, freight and telecommunications infrastructure.

The self-reinforcing nature of these reforms fuels the growth of what will become an enormous Indian middle class, whose consumption habits will evolve as they become wealthier. This surge in new wealth is also fuelling the rise of domestic pension funds, which are biased to equities given India’s young population and long investment horizon.

Careful relying on mean reversion when there is structural change
Bar graph showing net inflows into equity mutual funds from 2016 to 2023.
Source: Jefferies, Q1 2024.

Local allocators are more incentivised than foreigners to drive Indian corporates to improve corporate governance and returns for minority shareholders. This feeds into improving domestic liquidity, where it is increasingly local allocators that set the price in Indian equities, not fund managers in London or New York.

As investment strategist Keith Woolcock pointed out a few months ago commenting on the AI boom, there are times when valuation is the “alpha and omega of investing but most often it is not.” The same applies to India, where simple mean reversion can mean that investors miss the potential for upside surprise when positive structural change is occurring.

Is the bear market over in China?

China presents us with the flipside of the above – 1) longer-run structural risks as institutional quality deteriorates under Xi Jinping, which risks the country getting stuck in the middle-income trap; 2) this deterioration depressing the animal spirits of consumers and entrepreneurs who are less confident about the future; and 3) the rigid commitment of authorities to fiscal and monetary orthodoxy even at the risk of a deflationary bust.

This gloomy backdrop has seen foreign investors abandon the market, with Chinese equities halving since 2021. At 10x CAPE, China now trades at a record discount to the rest of EM, pricing in a dire economic outlook.

China now trades at a record discount to the rest of EM
Line graph comparing the MSCI China Index price/book and forward P/E ratios to the MSCI EM ex China Index from 2000 to 2024.
Source: NS Partners, LSEG Datastream.

However, prices being driven to such depressed levels eventually exhausts the sellers to the point that a market can rebound even before a recovery in the economy or corporate earnings gain real steam.

Are we starting to see this in China?

Chinese equities have outpaced even the S&P500 this year
Line graph comparing the performance of the S&P 500 Index, MSCI China Index, MSCI EM Index and MSCI EM ex China Index from January to May 2024.
Source: NS Partners, LSEG Datastream.

Chinese equities have so far outpaced even the US, including an S&P500 Index dominated by the Magnificent-7 tech giants.

We have been writing to our investors for some time about the gradual economic recovery taking place in China, the steady improvement in earnings growth among corporates, and ratcheting up of fiscal and monetary support (but without the stimulus bazooka). Animal spirits remain broadly depressed, and risks lurk within property and the banks. However, with much of this pain priced in and with positioning in China at such depressed levels, all it takes is for a slight pick up ahead of expectations to ignite a rally.

Short positioning in Chinese equities has begun to unwind (falling by a third in China A-shares over the period), while GEM managers tentatively reduce underweight positioning. Indeed, April was a record month for foreign flows into Chinese equities.

Foreign buying of China stocks tops record

Foreign flows into China equities from 2017 to 2024.
Source: Bloomberg.

There are a number of reasons to think that the rally can be sustained:

  • Positioning across GEM and global equity portfolios remains light, leaving plenty of headroom for allocators to add exposure and chase the positive momentum (forming a virtuous circle).
  • Policymakers, and most importantly Xi Jinping, have acknowledged the severity of the economic malaise and have pledged more aggressive measures to avoid a bust.
  • Company earnings are strengthening across several industries including travel, exporters and names aligned with key policy aims such as energy security, automation and import substitution.
  • The market is (finally) beginning to reward earnings beats.

This rally could carry on for some time. However, in contrast to India where we are more willing to run winners given the positive structural tailwinds driving the market, our bias is to be more conservative in China as the longer-term structural story remains negative.

China risks getting stuck in the middle-income trap so long as Xi continues to favour greater state control over rekindling the animal spirits and creative dynamism of entrepreneurs. However, much like in Japan’s lost decades, there were opportunities to take advantage of that delta between reality and depressed expectations, which precipitated sharp trading rallies. Also much like Japan, China’s deep universe of companies will offer up a rich opportunity set for active managers to generate alpha, even when running structurally lower exposure to the market.

“Gangbusters” UK GDP growth of 0.6% in Q1 may partly reflect inadequate adjustments for the leap year and early timing of Easter. In any case, the bigger story in recent national accounts data is nominal deceleration.

Nominal GDP rose at an annualised rate of 2.1% in Q4 and Q1 combined, down from 6.3% in the prior two quarters. With output momentum recovering slightly, the slowdown reflected a sharp fall in the rate of increase of the GDP deflator, from 6.6% annualised to 1.5% – see chart 1.

Chart 1

Chart 1 showing UK Nominal & Real GDP (% 2q annualised)

The drop in two-quarter nominal GDP momentum was signalled roughly a year ahead by falls in six-month broad and narrow money momentum into negative territory – chart 2. Money momentum has recovered since Q3 2023 but on both measures remains weaker than during the 2010s, when the GDP deflator rose at an average 1.8% pace.

Chart 2

Chart 2 showing UK Nominal GDP & Narrow / Broad Money (% 2q & % 6m annualised)

As an aside, the latest Monetary Policy Report contains a lengthy discussion of monetary developments and their relevance for policy. The strategy, as usual, is to damn with faint praise. While “broad money growth and inflation appear to have moved together over long cycles … it is harder to take an unambiguous signal about inflationary pressures from growth in the aggregate money data in isolation over shorter, policy-relevant, horizons.”

Really? Study chart 2. A directional leading relationship in rates of change is obvious. Except around the initial Covid lockdown, there are no examples of money momentum giving a seriously misleading message about future nominal GDP developments. As well as signalling the 2021-22 inflation surge, money trends warned of economic weakness / falling price pressures in 2008-09 and 2011-12, while contradicting recession forecasts following the Brexit referendum result. “Monetarists” were on the right side of the policy debate on all these occasions.

The income analysis of GDP allows movements in the GDP deflator to be attributed to changes in labour costs and broadly defined profits per unit of output. How has the recent sharp slowdown been achieved given supposedly sticky wage pressures?

According to the national accounts numbers, employee compensation per unit of output rose at an annualised rate of 1.8% in Q4 / Q1, down from 6.9% in the prior two quarters – chart 3. This slowdown is consistent with official earnings data and reflects a combination of 1) a moderation in regular earnings momentum, 2) a fall in bonus payments and 3) a pick-up in productivity (i.e. output per worker) as employment fell.

Chart 3

Chart 3 showing UK GDP Deflator & Income Components (% 2q annualised)

Profits and other “entrepreneurial” income per unit of output, meanwhile rose by only 1.1% annualised in the latest two quarters, versus 6.3% in Q2 / Q3 2023.

Domestic cost developments, therefore, are compatible with the inflation target while money growth, although recovering, remains too low. The “monetarist” view is that the MPC is behind the curve – again.

Save-on-Foods located in Town Centre, a newly constructed shopping centre in Calgary, Alberta.

Crestpoint Real Estate Investments Ltd., in partnership with the Trinity Retail Fund, is pleased to announce the completion of two new retail investments: Town Centre and the Cornerstone Retail Portfolio, both situated in and around Calgary, Alberta. These investments are strategically located, host a premium roster of well-known national tenants and are nestled near residential areas that attract substantial consumer traffic.

Town Centre, a newly constructed shopping centre spanning approximately 138,000 sq. ft. in the master-planned community of Trinity Hills near Canada Olympic Park, is anchored by Save-on-Foods and includes a variety of well-known national tenants, such as Dollarama, PetSmart, Bulk Barn and Sleep Country. Located near the Trans-Canada Highway and Sarcee Trail SW, the centre provides tenants with exposure to over 60,000 vehicles daily and is adjacent to a community projected to reach around 4,000 residential units.

The Cornerstone Retail Portfolio consists of two open-format, grocery-anchored retail properties in Olds and Okotoks, Alberta, measuring approximately 113,000 sq. ft. and 157,000 sq. ft., respectively. Combined, the two-asset portfolio covers 33 acres with a leasable area of approximately 270,000 sq. ft. About 98% of the space is leased to a premium roster of national tenants offering high-quality everyday essentials, including Sobeys, Canadian Tire, Staples, Dollarama, Mark’s and several leading banks. Both locations also benefit from their proximity to Walmart “Superstores.”

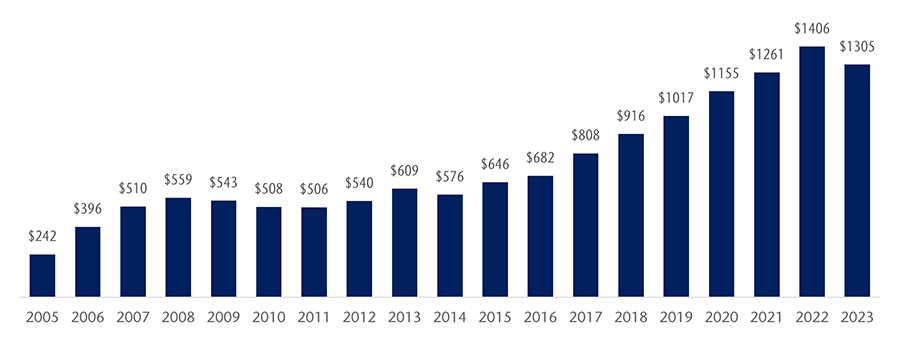
Crestpoint, on behalf of the Crestpoint Core Plus Real Estate Strategy (its open-end fund), has a 75% interest in Town Centre and the Cornerstone Retail Portfolio, with Trinity Retail Fund holding the remaining 25%. These acquisitions enhance the fund’s diversity and increase Crestpoint’s total assets under management to over $10 billion.

Bingham Canyon copper mine, largest man-made hole in the world, Utah, USA.

The new dynamics of the global materials market

We recently attended the BMO Global Metals, Mining & Critical Minerals 2024 Conference, the premier global event for the materials sector. Materials make up 8% of the MSCI Global Small Cap Index and 10% of the MSCI EAFE Small Cap Index. Mining conferences are like no other, featuring core shack displays and political representatives from various countries. The atmosphere was notably different this year, particularly with the decline in battery material prices. There was a noticeable shift of interest from car battery to electrical grid infrastructure materials.

Supply and demand at play in commodities prices

Returns in the materials sector generally correlate with the supply-demand dynamics of various commodity prices. Inflation typically indicates an overall demand driver. However, it has not been very impactful, as China, a major commodity buyer, is experiencing modest inflation growth. Commodity supply dynamics are highly influenced by regulatory events, including environmental, social, geopolitical factors, capital availability and project risks. Recently, we have observed events that could signal mid to long-term structural changes.

Copper and aluminum: metals on the move

Copper has been performing well due to both future demand and supply side momentum. Essential to data computing, it has been rebranded as “AI copper.” Additionally, the growth in electricity demand and closure of the world’s largest copper mine are factors pushing prices to new highs.

Aluminum can substitute copper, especially in electrical transmission, as its resistivity is 0.6 times that of copper such that aluminum wire is 66% larger. The prices of both commodities tend to correlate. Currently, the price spread between the two is considered large from a historical perspective, with copper trading at $4.57 and aluminum at $1.17, making aluminum an economically viable substitution.

Our investment in Alumina

Global Alpha is exposed to aluminum through our stake in Alumina (AWC AU). Based in Australia, the company is the largest producer of alumina metal, a key precursor to aluminum. AWC shareholders have recently agreed to accept the all-share acquisition proposal by Alcoa, its long-term operating partner. With a more vertically integrated operation, Alcoa plans to reduce overall costs by 10% within a short two-year period. Aluminum is also widely used in the aerospace sector, which provides another tailwind.

Gold and copper in traditional and emerging markets

Copper is often mined alongside gold. Gold, which had been out of favour since 2011, is seeing renewed interest and positive investor sentiment, driven by purchases from central banks in China and established investor circles, with both buying the bullion at a faster pace than in the past. This trade is a win-win. If China’s economy falters compared to its US counterpart, gold becomes a safe alternative. Conversely, if China’s economy outperforms, the race to distance itself from the US dollar intensifies. Despite China’s cryptocurrency ban, there are rumours that this commodity accumulation is in preparation for a devaluation of the yuan, though time will tell. Other countries, like Turkey and Poland, have also increased their gold reserves for similar geopolitical reasons.

Globally, we produce 3,100 tons of gold annually and it estimated that there are 205,000 tons of gold in circulation – half in jewelry, 25% in investments and 15% held by central banks. In 2023, China’s government bought a record 735 tons. The private sector net imported 1,411 tons, with an impressive 228 tons coming in just January of 2024.

The golden balance of central banks and global stock

For central banks, there is room to grow for China as it ranks fifth with 2,200 tons in its vaults today compared to the US at 8,100 tons. The below-ground stock of gold reserves is currently estimated at around 50,000 tons according to the US Geological Survey.

This equates to a 15-year mine life for the world’s gold demand. As gold deposits become increasingly difficult to locate, this global gold mine life will likely diminish rapidly. In this context, gold could become a strong competitor to digital currencies in the coming years as a safety alternative.

ALS Ltd. and commodity markets

Global Alpha is exposed to gold, copper and other commodities through ALS Ltd. (ALQ.AU). ALS is the market leader in mining assay management, helping companies with their sample testing requirements. With industry-leading margins in precious metals, ALS has achieved the necessary scale in all major global mining hubs, giving it significant competitive advantage. ALS also operates in the environmental and health care sectors, where it benefit from its global reach compared to smaller competitors.

Capitalizing on commodity upswings with Osisko Gold Royalties

We also own Osisko Gold Royalties (OR.CN). The company holds gold and base metal royalties in North America. Royalties are intriguing financial instruments as they are paid in product by miners and are largely unaffected by mining costs, allowing royalty companies to benefit from rising commodity prices. Last year, the company hired a highly reputable management team and simplified its structure by exiting all direct project investments.

Gold and iron ore stability vs. disruption

In the gold market, central banks act as fringe buyers and sellers and are the price setters. Although jewelry accounts for the bulk of market demand, consuming 2,000 tons annually, its growth is relatively muted and stable.

The same concept of stability and fringe actors applies to iron ore. The world consumes two billion tons per year and China-based mills account for 50% of that. Production of 1.1 billion tons is controlled by five companies with fairly stable output. Fringe producers contribute 300 million tons, including high-cost producers in China and Southeast Asia that have benefitted from robust pricing over the years. However, the iron ore price balance is poised for disruption as 200 million tons of low-cost production is expected to enter the market in 2026 from mega projects in Guinea and Australia.

Silver and palladium redefined

Other interesting points from the conference that could orient our research include insights on silver and palladium. It takes five times more palladium to build a hybrid than a regular car. Silver has now surpassed a 50% usage rate in industrial applications, prompting a reevaluation of its classification as a precious metal.

Beyond precious – the future of metals

All of these developments invite us to rethink the boundaries of “precious” in metals and the value of agility and foresight in investing. As markets shift and new technologies demand novel materials, our approach to commodities must also adapt. This not only offers opportunities for astute investors but also challenges us to anticipate changes and position ourselves advantageously for what lies ahead.

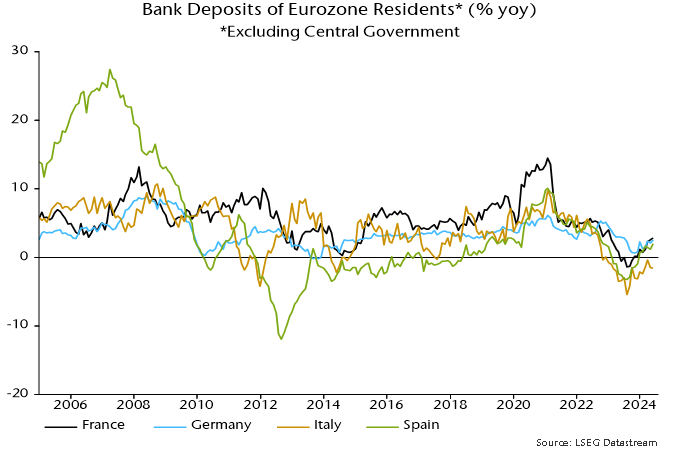
post in February argued that US Treasury plans to reduce reliance on bills to fund the deficit implied weaker monetary expansion from Q2, with possible negative implications for markets and economic prospects. This scenario remains on track.

The Treasury last week confirmed a reduction in the stock of Treasury bills in Q2 while signalling small-scale issuance in Q3.

Deficit financing via bills rather than coupon debt tends to boost the broad money stock because bills are mostly bought by money-creating institutions, i.e. banks and money funds. Their purchases are usually associated with expansion of their balance sheets, with a corresponding increase in monetary liabilities.

Broad money also tends to rise when the Treasury finances the deficit by running down its cash balance at the Fed.

Both effects were in play in 2023 / early 2024, resulting in a large monetary boost from Treasury operations that more than offset the Fed’s QT – see chart 1.

Chart 1

Chart 1 showing US Broad Money M2+ (6m change, $ bn) & Fed / Treasury QE / QT (6m sum, $ bn)

The latest Treasury estimates, however, imply a small negative impact in Q2 / Q3 combined. The earlier post argued that the Fed would need to halt QT to offset this shift. Last week’s taper announcement was insufficient, implying that the combined Treasury / Fed influence is likely to turn significantly contractionary – chart 2.

Chart 2

Chart 2 showing US Broad Money M2+ (6m change, $ bn) & Sum of Fed & Treasury QE / QT (6m sum, $ bn)

Will a revival in bank lending neutralise the Treasury / Fed drag? The Fed’s April senior loan officer survey was less negative but demand and supply balances remain soft by historical standards, arguing against a strong pick-up – chart 3.

Chart 3

Chart 3 showing US Commercial Bank Loans & Leases (% 6m annualised) & Fed Senior Loan Officer Survey Credit Demand & Supply Indicators* *Weighted Average of Balances across Loan Categories

April monetary statistics will be released in late May but weekly numbers on currency, commercial bank deposits and money funds are consistent with emerging weakness  – chart 4.

Chart 4

Chart 4 showing US Broad Money M2+ & Weekly Proxy* ($ trn) *Currency in Circulation + Commercial Bank Deposits + Money Funds

Solar panels on an agricultural field on a sunny day.

Rising temperatures, driven by escalating levels of greenhouse gases (GHGs) in our atmosphere, cast a looming shadow over our planet’s future. The consequences of inaction could be dire, inflicting an environment of physical and economic peril. The root cause of the issue is human activities, principally the emission of carbon dioxide (CO2) from burning fossil fuels. The gravity of the situation has garnered global attention, prompting governments around the world to commit to reducing GHG levels in a collective effort to curb the rise in the earth’s temperature.

The solution to this unprecedented challenge extends beyond government pledges and public policy. Success also requires the support and proactive engagement of businesses, investors and individuals. Energy transition is an essential component in tackling climate change, involving a shift from the reliance on fossil-based systems, such as oil and coal, to renewable alternatives like wind, solar and large-scale energy storage technologies. The shift toward less carbon-intensive energy solutions will be integral to any climate change action plan. This article provides background on the issues, and the role of energy transition in the broader climate change context.

Understanding GHGs: The underlying cause of global warming

The climate change action plan is mostly focused on combating energy-related CO2 GHGs in the atmosphere, as they represent the majority of GHG emissions (Figure 1). These CO2 emissions are largely attributed to the fossil fuels that generate our electricity, heating and cooling and power our transportation. Other energy-related emissions include methane (CH4) and nitrous oxide (N2O), while the remaining non-energy related GHGs are primarily associated with agriculture.

Figure 1 – Global GHG emissions
Pie chart of global greenhouse gas emissions by type.
Source: Climate Watch, World Resources Institute (2016).

It is important to appreciate that GHGs are not necessarily a bad thing. In fact, they function as a thermal blanket warming the earth and are crucial to human survival. Without GHGs, our planet would be uninhabitable. However, rising levels of GHGs limit the effectiveness of the thermal blanket and are the underlying concern of global warming, and the reason for the focus on combating energy-related CO2 emissions.

Energy transitions through the ages

Historically, energy transitions have been lengthy processes driven by the twin forces of economic growth and increasing energy demand. The first major transition was in the 1800s, which experienced a switch from traditional biofuels (primarily wood) to coal and took over a century to unfold. The mid-1970s heralded another notable change with the development and adoption of refined oil products. For the next 30 years, fossil fuels were the key energy source until the recent two decades when there was a greater reliance on natural gas.

These past transitions were motivated by economic prosperity and the implied increase in energy consumption across both developed and developing countries. The current energy transition is different and more complex. The success of the current global energy transition depends on its ability to ensure energy access for economic growth and development, while simultaneously tackling decarbonization to mitigate climate impact.

Broader threat of climate change

Early literature on climate-related impacts often focused on environmental risks, but the negative consequences are much broader, encompassing both physical and transition impacts that extend to communities, businesses, financial markets and individuals.

Longer-term shifts in weather patterns from climate change are leading to an increased frequency and severity of extreme events like storms and flooding. These events can cause damage and disruption to homes and businesses, in addition to financial ramifications, such as higher insurance costs. To varying degrees, most industries are expected to be affected by the risks from climate change, facing direct and indirect financial challenges due to physical damage, operational interruptions and supply chain disruptions. The Bank of England has also highlighted how climate-related impacts pose a serious threat to financial system stability because of their extensive nature and widespread exposure of financial institutions and asset owners.

The broader threat of climate change has made governments worldwide recognize the need to be instrumental in driving behavioural changes and supporting the energy transition. Initiatives like the 2015 Paris Agreement set long-term goals for reducing GHGs, with governments increasingly using economic incentives and regulations to encourage the move away from fossil fuels. Unlike the concerted global response to the COVID-19 pandemic, the response to climate change lacks uniformity due to varied economic, political and social factors in different global regions. However, greater coordination will be necessary to mitigate and manage the threat implied by global warming.

Risk and opportunities in energy transition

Risks and opportunities are often discussed as if they are opposites. However, they are not necessarily opposing concepts since an opportunity can help manage a particular risk. This is the situation when it comes to climate change and the role of energy transition. Energy transition opportunities can affect all asset classes and sectors, but the most significant opportunity is expected to come from infrastructure strategies that can deliver low-carbon solutions.

The move away from an energy system reliant on fossil fuels and towards cleaner, renewable sources of power will require trillions of dollars of investment and may be one of the largest and most significant investment opportunities of the coming decades. It is expected that annual investment in the energy transition sector, currently around US$1 trillion, will need to average more than 3x this level for the rest of this decade.*

The magnitude of the additional investment will fuel growth in the opportunities across a spectrum of infrastructure assets and businesses for many years to come. The obvious infrastructure solutions will include developing and building clean energy projects. However, due to the significance of the climate change challenge, it will be necessary to encompass a much broader universe of assets, including the enablement of infrastructure solutions, as well as the decarbonization of existing infrastructure.

Develop and build cleaner energy

For low-carbon infrastructure solutions, the natural opportunities include developing and building renewable clean-energy projects, such as wind, solar and run-of-river hydro. Recognizing the importance of the other pillars in addressing climate change, renewable energy solutions narrowly retained their position as the largest sector in 2022.*

Implement sustainable solutions and enable infrastructure

The energy transition will extend well beyond basic energy systems and necessitate the implementation of a range of sustainable solutions – ranging from the build out of battery storage systems and electric vehicle charging infrastructure to geothermal heating and cooling systems that are less carbon intensive than conventional gas boilers – to reduce emissions more broadly.

Decarbonize existing infrastructure assets

The other key pillar of the universe of assets is the decarbonization of existing infrastructure, which requires a hands-on and active approach to transitioning assets away from carbon-intensive business models and towards greener alternatives through strategies, such as changes to production processes, the electrification of systems, the adoption of cleaner fuel sources and the use of carbon capture and storage. One example would be to fund the electrification of a transportation fleet. Another potential investment would be in the transformation of a gas-powered generation asset, where it would be possible to blend, and ultimately replace, the natural gas feedstock with green hydrogen to produce low, and eventually no, carbon base-load electricity.

Energy transition cannot be successful without funding and leadership from owners to drive the transformation of existing infrastructure assets. While some investors may have broad-based exclusions to entire sectors, such as coal, natural gas or oil, we expect that many may reconsider these positions and move towards a more flexible approach that would allow for some exposure where there is a credible and actionable transition plan underway for the investment.

Seizing the energy transition opportunity

The importance of investing in energy transition-related assets is growing with the urgent need for substantial capital to support decarbonization efforts and meet global climate change objectives. Energy transition infrastructure investments offer institutional investors access to a range of opportunities and with energy transition poised to influence every industry and country, it is imperative for investment committees to appreciate both the risks and opportunities involved, as well as energy transition’s role in addressing climate change.

*Source: Bloomberg NEF, Energy Transition Investment Trends 2023.

Source documents:
Climate change: A primer for investors, LCP, 2021.
Energy Transition 101, World Economic Forum, 2020.
What is Energy Transition, S&P Global, 2020.

Subscribe for updates

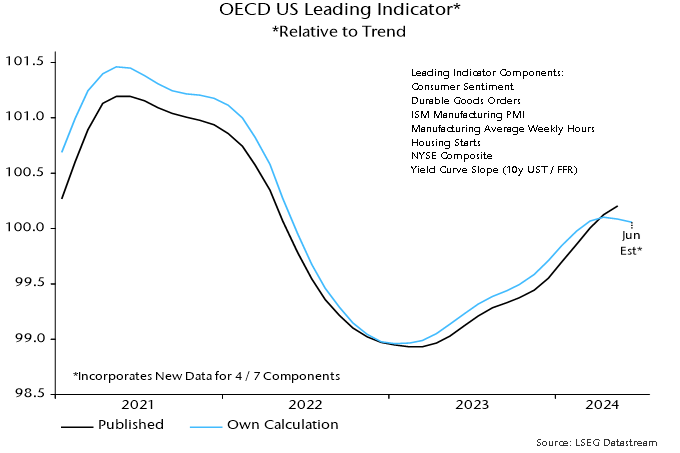
The Fed’s preferred core price measure – the PCE price index excluding food and energy – rose by an average 0.36% per month, equivalent to 4.4% annualised, over January-March.

The FOMC median projection in March was for annual core inflation to fall to 2.6% in Q4 2024. This would require the monthly index rise to step down to an average 0.17% over the remainder of the year – see chart 1.

Chart 1

Chart 1 showing US PCE Price Index ex Food & Energy

The judgement here is that such a slowdown is achievable and could be exceeded, based on the following considerations.

First, such performance was bettered in H2 2023, when the monthly rise averaged 0.155%, or 1.9% annualised, i.e. the requirement is within the range of recent experience.

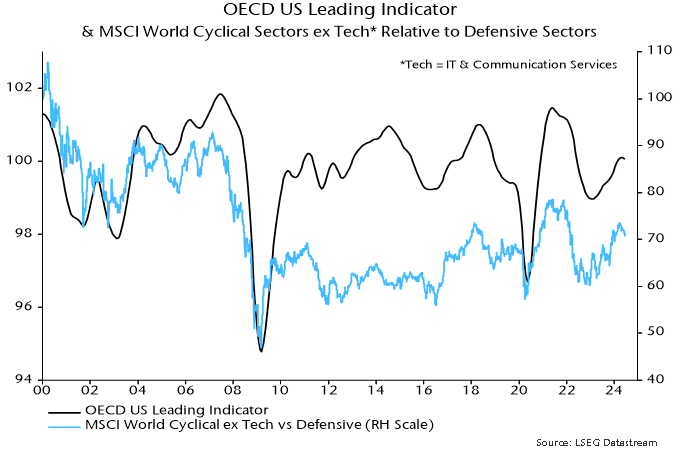
Secondly, the monetarist rule of thumb of a two-year lead from money to prices suggests a strong disinflationary impulse during H2 2024. From this perspective, any current “stickiness” may reflect the after-effects of a second pick-up in six-month broad money momentum in 2021, following the initial surge into mid-2020– see chart 2.

Chart 2

Chart 2 showing US PCE Price Index & Broad Money (% 6m annualised)

Momentum returned to a target-consistent 4-5% annualised in April 2022, subsequently turning negative and recovering only from March 2023, with the latest reading still sub-5%. Allowing for the usual lag, the suggestion is that six-month price momentum will move below 2% in H2 2024, remaining weak through next year.

A third potential favourable influence is a speeding-up of the transmission of recent slower growth of timely measures of market rents to the PCE housing component. Six-month momentum of the latter was still up at 5.6% annualised in March but weakness in the BLS new tenant rent index through 2023 is consistent with a return to the pre-pandemic (i.e. 2015-19) average of 3.4% or lower – chart 3. With a weight of 17.5%, such a decline would subtract 3 bp from the monthly core PCE change.

Chart 3

Chart 3 showing US PCE Price Index for Housing (% 6m annualised) & BLS Tenant Rent Indices (4q ma, % 6m annualised)

Image alt text: Upper left: Old Town Warsaw, Poland during sunset. Lower right: Sunrise over The Blue Mosque, Istanbul, Turkey.

In March, our team embarked on a two-week trip to two of the most dynamic economies within Emerging Markets: Poland and Turkey. During our visit, we engaged with companies spanning a variety of industries – from construction and renewable energy to waste management, IT, commercial services, airlines and airport operators. Also, we gained insights into the consumer sector, meeting with leaders in production and distribution for a wide range of consumer products, including confectionery, fast food, denim, automotive, electronics, soft drinks and beer. The trip’s objective was not only to check up on existing holdings but also to identify nascent opportunities and understand the challenges these businesses face.

Poland’s optimistic outlook

It has been a year since our previous visit to Poland. During that visit, we observed consumers struggling with high inflation, wage growth continuing to decline, public concerns around the upcoming parliamentary elections and hopes for a swift resolution to the war in Ukraine, which would bring peace and vast opportunities for Polish companies.

We were happy to see a rise in optimism regarding these concerns during our latest visit. Most of our interviewees were more bullish this time around. Post the parliamentary elections, we sensed a renewed optimism as a pro-European Union (EU) coalition regained power. The new Polish government seems committed to mending relations with the EU, having successfully unblocked the first tranche of €76 billion frozen by the European Commission due to legal concerns after judicial reforms by the former government. Since joining the union, Poland has been a significant beneficiary of EU funds, receiving approximately €164 billion from 2004 to 2020. For context, Poland’s GDP was €750 billion last year. These substantial financial inflows have contributed to various crucial projects across the country, enhancing infrastructure and improving structural economic growth and overall wellbeing​. No wonder these EU funds are expected to drive economic growth for several years to come. Coming in the form of grants and low-interest loans, this financing is mainly for funding infrastructure and renewable energy projects.

Contrary to last year, this time we saw consumers in Poland enjoying strong real wage growth of around 10%, with no labour market slowdown. With inflation easing to low single digits in the first quarter of 2024, these factors create a conducive backdrop for the robust recovery of Polish consumers. Growing disposable income is likely to not only rebuild their savings but also drive rebound in consumption.

However, the road ahead may be bumpy due to potential inflation spikes in the second half of 2024 on the back of higher energy prices, a VAT hike on groceries, fulfillment of costly pre-election commitments, domestic political tensions and the potential escalation of the ongoing war in Ukraine. The war remains one of the major risks to the region and was a frequent topic in our conversations, not only with corporate executives but also with ordinary citizens. Centuries of conflict between Poland and Russia have left deep scars in the psyche of the average Polish citizen.

Turkish economic reforms and investor confidence

In Turkey, a surprising pivot to orthodox monetary policy last year reignited hopes for economic normalization, buoyed the local stock market and turned foreigners in net buyers for the first time since 2019. Committed to controlling escalating inflation, the central bank raised its key policy rate from 8.5% in June 2023 to a staggering 50% in March 2024. Moreover, the monetary authority signaled its readiness for further rate hikes if necessary. Investors welcomed the government’s adoption of market-friendly measures, which drove the Turkish stock market higher by over 30% in US-dollar terms since the first hike last summer. Simultaneously, foreign reserves have started to recover, sovereign credit spreads have tightened to multi-year lows and the current account balance is expected to get meaningful support from the tourism season starting in May.

Although the recent municipal elections marked a significant defeat for the current leadership, President Erdogan reiterated policy continuity and his commitment to an economic turnaround program in the second half of the year. With no elections for the next four years, the government has time to tackle inflation and achieve long-awaited results. However, this requires the implementation of further austerity measures, including fiscal ones. Current market expectations see inflation peaking in May above 70% before declining to 30%-40% by year-end. However, potential new rounds of minimum wage hikes, premature rate cuts and higher energy prices continue to threaten the turnaround policy and could derail efforts to reduce inflation and improve the trade balance.

Nearshoring opportunities

Despite being influenced by very different forces, Poland and Turkey share some commonalities. In the last few years, the term “nearshoring” has become strongly associated with Mexico and Vietnam. We explored the impact on the Mexican economy in a previous commentary. However, Poland and Turkey have turned out to be underappreciated beneficiaries of supply chain shifts toward near- or friendshoring as a way to reduce reliance on China. Nearshoring opportunities repeatedly came up in our discussions with corporates in both countries. We see Poland as a launching pad for opportunities into Western Europe and hard-to-access markets in the east like Hungary, Romania and Bulgaria. Similarly, Turkey offers a gateway to explore opportunities in CIS countries and less liquid frontier markets. We highlight one such opportunity below.

As bottom-up investors, we focus our macroeconomic analysis primarily on enhancing the risk management aspect of our portfolio management. When investing in highly turbulent economies, we prefer to stick to companies that we believe can succeed even when their domestic economies face challenges. Additionally, we look to benefit from a possible decline in country risk premiums in the event of macro normalization.

Investment spotlight: Coca-Cola Icecek and Mo-BRUK

Our largest position in Turkey is Coca-Cola Icecek (CCOLA TI), a coke bottler. In the last 20 years, the company has evolved from a single-country operator to the third-largest coke bottler globally, with a footprint spanning 12 countries and 600 million people. Icecek generates less than 30% of its EBITDA in Turkey, with Pakistan, Kazakhstan, Uzbekistan and another eight countries in the Middle East and Central Asia accounting for the major part of the business. Robust strategic alignment with The Coca-Cola Company, combined with Icecek’s proven record of successful integration, positions it as the preferred partner for further consolidation of Coca-Cola’s bottling operations in the region.

Bangladesh is the recent addition to Icecek’s portfolio. It is a country with over 170 million people and a heavily underpenetrated non-alcoholic beverage industry poised for double-digit volume growth over the next decade. This positions Icecek well to replicate its successful strategy of distribution network enhancement to ensure product availability, build infrastructure and enrich merchandise offerings. Leveraging its leading brand portfolio and a highly experienced management team, Icecek is set to continue capitalizing on the vast potential of its markets.

Mo-BRUK (MBR PW) is a waste management company in Poland specialized in processing hazardous waste. The founding family established the business more than 30 years ago and has built a strong franchise in an industry characterized by high entry barriers. The company does not operate landfills and focuses solely on processing waste. EU regulations on waste management create significant tailwinds for the industry in Poland, as the country must undertake considerable efforts to meet EU objectives. Due to its specialization in hazardous waste and limited competition due to entry barriers, Mo-BRUK enjoys superior business economics. High margins are driven by volume growth and technology improvements, as well as price hikes due to limited capacities in the country. In terms of growth strategy, the company is conducting several expansion projects within available permits. At the same time, it is filing for new permits. Remediation of the illegal landfills or so-called ecological bombs represents an attractive business for Mo-BRUK, but it is highly dependent on the budget allocation by municipalities. The cadence of such projects is erratic, but the company intends to participate in all tenders as they are announced. Additionally, the management team sees multiple consolidation opportunities in the country. In late-2023, Mo-BRUK acquired two independent operators that not only provided the company with scarce permits but also expanded its footprint in northern Poland.

Bird's eye view over the beach of the coastal side of Mombasa, Kenya at sunrise.

The strategy focuses on investing in frontier and emerging market companies that our team expects will benefit from demographic trends, changing consumer behaviour, policy and regulatory reform, and technological advancements.

Below, we explore some of the key factors influencing returns and share observations on the portfolio and the markets.

Financial Services Portfolio

The strategy saw strong returns from financial services, driven by the financial technology portion of the portfolio. The primary driver of returns at the security level was Kenya’s Safaricom PLC, the country’s leading telecommunication and mobile money services provider, whose share price appreciated by nearly 60% in US dollars in the quarter. This strong share-price performance is largely attributed to a decline in the risk premium attached to Kenyan assets.

Like many frontier and lower-income emerging markets, Kenya’s fiscal and balance of payments position was severely compromised over the last four years as it grappled with a host of global challenges, including high and volatile commodity prices, supply chain tightness, rising interest rates, and a strong US dollar. Domestically, successive droughts and the election of a new government in August 2022 created further uncertainty and negatively impacted consumer confidence (note: agriculture contributes over 30% to Kenya’s GDP and employs over 40% of the total population). Consequently, Kenya was all but shut out of international capital markets, impairing its ability to issue hard currency debt to finance its growing liabilities and leading to a 20% depreciation in the Kenyan Shilling against the US Dollar in 2023. The country’s fortunes began to turn around at the beginning of 2024 as it took advantage of a window of opportunity to issue its first Eurobond since 2021. Kenya enticed investors by offering a relatively lucrative yield of 11.0%, which was oversubscribed five times and ultimately raised US$1.5 billion at a tightened yield of 10.375% with a 10-year maturity. The government’s decision to pay up for capital has so far proven to be the right one as concerns quickly abated over the level of FX reserves and the country’s ability to service a US$2.0 billion Eurobond maturing in June 2024. The result was a compression in yields across the curve and a restored confidence in the Shilling, which, as of the date of writing, is the world’s best-performing currency versus the US dollar (~19% appreciation in the quarter). The significant appreciation in the currency is bringing imported inflation down, and with the start of the rainy season and a better harvest, it should serve to further subdue inflation through lower food prices.

As would be expected, the improvement in Kenya’s economic prospects was swiftly reflected in the share price of Safaricom as well as the broader market. Through M-Pesa, Safaricom is particularly geared to economic activity as it is the dominant platform through which its ~32 million active customers (~60% of Kenya’s population) transact using services like peer-to-peer transfers, bill payments, remittances, and borrowing and saving. In the year ending December 2023, M-Pesa facilitated ~$280 billion of transaction value (nearly 3x Kenya’s GDP), a number that is expected to grow as economic activity picks up and as many of the use cases that management is rolling out are adopted by its large and scaled base of customers and merchants.

Another notable contributor to the period’s returns from the financial technology portfolio was Kazakhstan’s Kaspi.kz, a company we have written extensively about in a previous post. Over the last three years, Kaspi’s management team have been working on a plan to move the company’s share listing venue from London (LSE) to the Nasdaq. Kaspi’s shares have been relatively illiquid on the LSE, with one-year average daily traded value of US$2.8 million, a low percentage of the free-float market capitalisation of over US$3.0 billion. Management have long made the case that the LSE listing undervalued their shares and that the right home for Kaspi as a technology company is the Nasdaq. True to their word, management pulled off the listing in January this year to become the first Kazakh company to list on the Nasdaq (the shares were subsequently delisted from the LSE). Since the listing, daily traded value averaged US$43.0 million, ~15x what it used to trade on the LSE. It is too early to say whether that liquidity boost will underpin a higher multiple on the shares as management hopes, but we are confident in their ability to execute operationally and believe that this will ultimately drive long-term shareholder value. The Nasdaq listing has also been celebrated by the President of Kazakhstan, which we believe should only help reinforce Kaspi’s national champion status and strategic importance to the country’s ambition to draw in foreign direct investment.

Consumer Portfolio

The strategy’s consumer portfolio delivered good performance this quarter, driven by the Philippines’ Century Pacific Food Inc. and Indonesia’s Sido Muncul (Sido). Century Pacific is the largest canned food company in the Philippines, with an 85% and a 52% share in seafood (tuna and sardines) and meat, respectively. Over the last few years, Century’s management have successfully executed an entry into the dairy category, with market share as of end of 2023 reaching ~28% in powdered milk (from 2% in 2016), a strong number two and lagging only behind Nestle, the market leader with a ~60% share.

The milk category is in its infancy in the Philippines, with annual consumption per capita at the bottom of the list among Asian countries. Management believes that milk consumption is at an inflection point and have positioned the company strongly to benefit from the growth in the category over the next decade. The diversification and resilience of Century’s portfolio have served it well in the last twelve months; Filipino consumers have experienced considerable pressure on their disposable incomes from a rise in rice prices and high interest rates which has led them to trade down to categories that offer more value for money. Simultaneously, softer input prices allowed Century to increase its gross profit margins and invest in advertising and promotions to drive demand and reinforce the equity of its brands while thoughtfully increasing dividend payout to shareholders. Momentum seems to also be building in other parts of the Century portfolio, including coconut water where the company announced an expansion of its agreement with The Vita Coco Company, alternative meats where it is now in 1,800 Walmart locations in the US, and pet food where it is making inroads in modern retail doors in the Philippines.

Sido, the herbal medicine company that we have discussed extensively in the past, emerged from a difficult 2023 with a strong exit performance in the last quarter of the year and a promising outlook for the first half of 2024. Sido is one of the most profitable consumer health companies in the world, with EBITDA margins above 44% and return on capital ratios that are consistently in the range of high 20%s to low 30%s. This profitability underpins high cash conversion and allows the company to continually run a zero-debt balance sheet. More recently, the controlling shareholder Irwan family bought out the full 17% stake of Affinity Equity Partners, a private equity investor that had come to the end of its investment cycle in the company. The transaction was done at a 30% premium to the three-month average price, signalling confidence from the family in the prospects of the business, and removing the overhang on the shares that typically arises with late-stage private equity ownership of public companies in our markets.

 Outlook

After three difficult years, we are observing an improvement in the environment for the strategy. We sense more optimism in our discussions with the majority of portfolio companies on their operations and outlook for their businesses. We also see a growing opportunity set for the strategy as investability returns to markets like Kenya, Egypt, Pakistan, and Bangladesh. We also see more opportunities emerging out of ASEAN markets like Malaysia and Thailand, and Middle Eastern markets like the UAE. This has been reflected in the strategy’s cash levels, which have reached a three-year low as of the end of the quarter.

We look forward to continuing to update you on the strategy over the rest of the year.