UK monetary alarm bells are ringing louder.

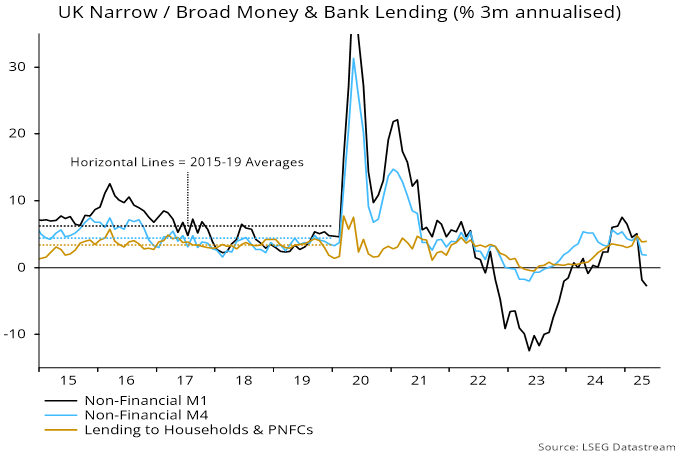
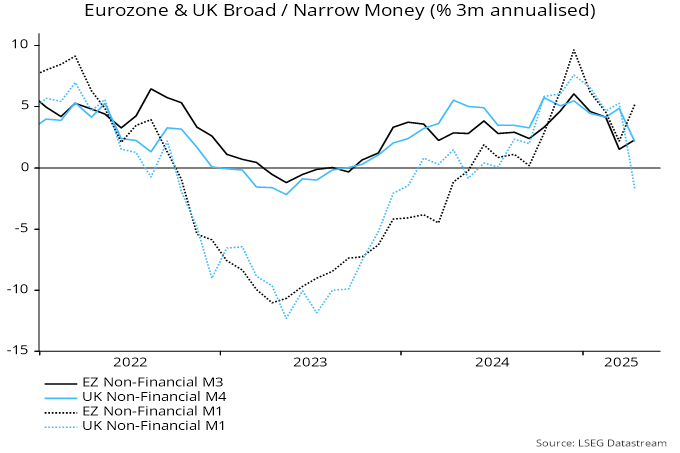
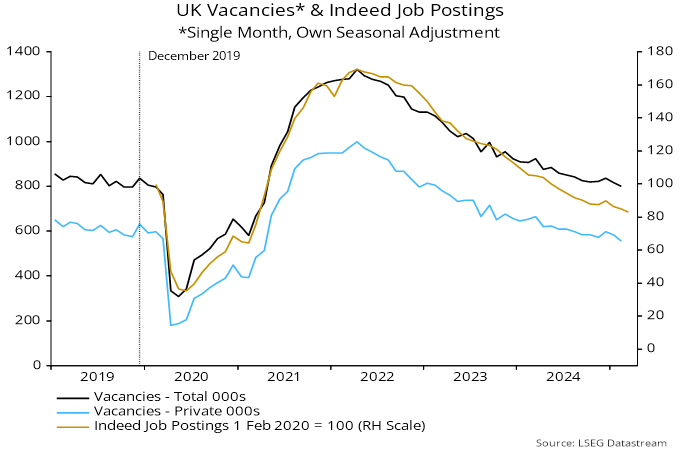
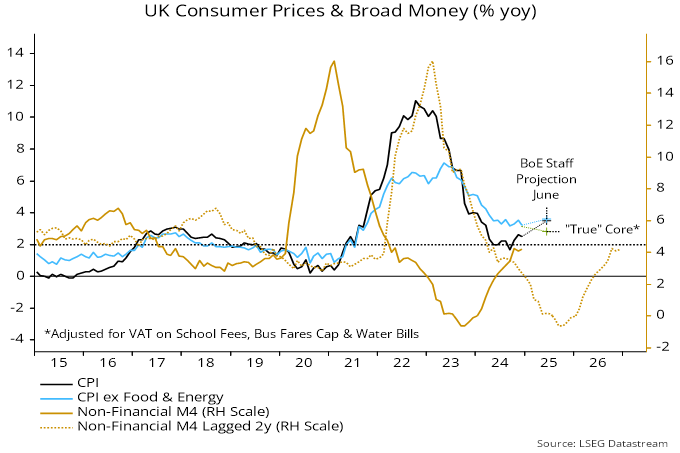
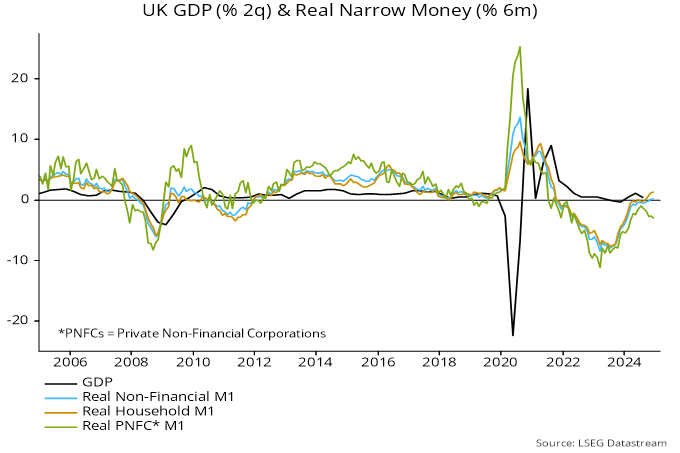
Six-month growth of the preferred narrow money measure here – non-financial M1, comprising holdings of households and private non-financial corporations (PNFCs) – fell further in June, to just 0.1% annualised. Growth of its broad equivalent, non-financial M4, remained at 3.0%, below a 4.5% average over 2015-19, associated with beneath-target average CPI inflation – see chart 1.

Chart 1

Chart 1 showing UK Narrow / Broad Money (% 6m annualised)

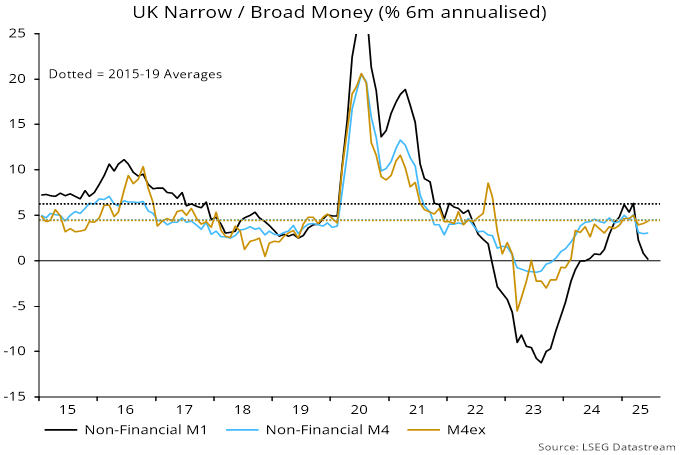
Monetary warning signals are being ignored partly because official / consensus focus is on the Bank of England’s headline M4ex broad aggregate, which grew by 4.4% annualised in the six months to June – exactly in line with its 2015-19 average.

M4ex relative strength, however, reflects rapid expansion – by 14.1% annualised in the six months to June – of money holdings of “non-intermediate other financial corporations (OFCs)”, mainly attributable to increases in balances of securities dealers and fund managers. Such holdings are volatile and – unlike non-financial M1 / M4 – uncorrelated with future activity / prices*.

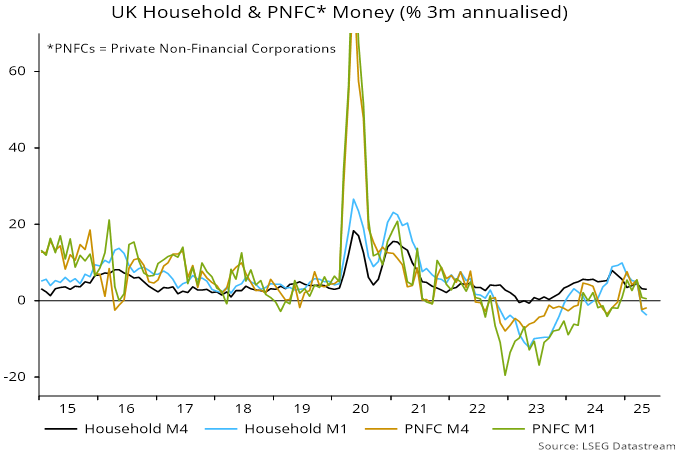
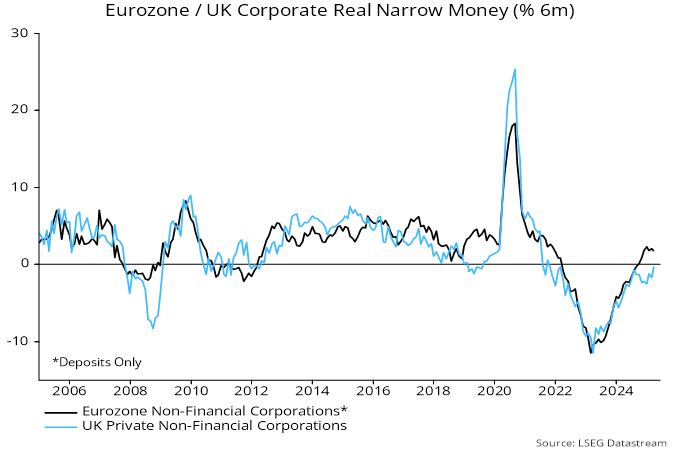
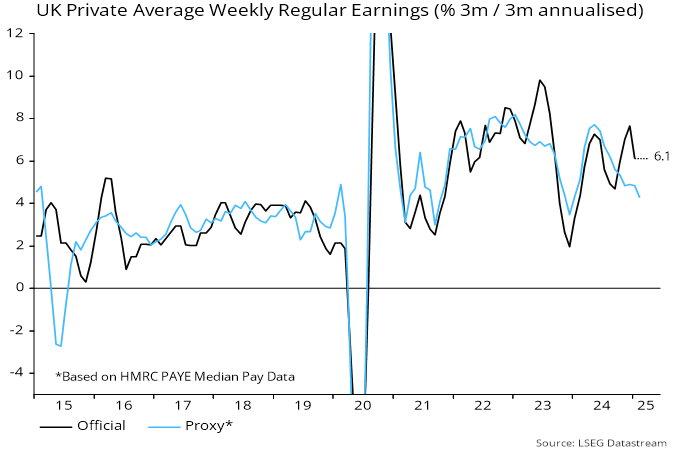
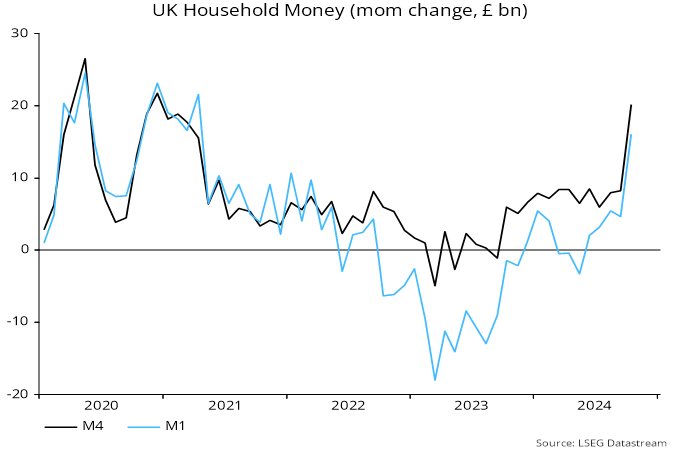
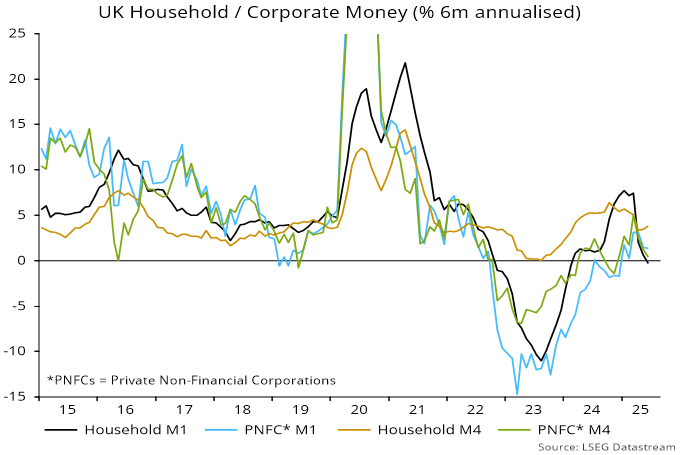
Six-month growth of M1 / M4 holdings of private non-financial corporations (PNFCs) fell further in June, to 1.4% / 0.4% annualised respectively. Household M4 growth firmed to 3.8% but M1 momentum moved into marginal contraction. The shift from sight deposits into time deposits and ISAs suggests weak spending intentions and a preference for saving – chart 2.

Chart 2

Chart 2 showing UK Household / Corporate Money (% 6m annualised)

A previous post argued that falls in six-month non-financial M1 / M4 growth in April / May were partly payback for upward distortions related to portfolio adjustments before the October Budget and a front-loading of housing market activity ahead of the end of the stamp duty holiday. With such effects fading, ongoing monetary weakness is stronger evidence of overrestrictive policy.

*Correlations of the two-quarter rate of change of nominal GDP with two-quarter changes in money measures, lagged two quarters, over 1998-2019: M4ex +0.19, non-financial M4 +0.41, M4 of non-intermediate OFCs -0.08, non-financial M1 +0.65.

UK money momentum has weakened alarmingly. The broad non-financial M4 measure – comprising holdings of households and private non-financial corporations (PNFCs) – grew by just 1.9% annualised in the three months to May. Non-financial M1 contracted at a 2.7% pace – see chart 1.

Chart 1

Chart 1 showing UK Narrow / Broad Money & Bank Lending (% 3m annualised)

Three-month bank lending growth held up but is likely to fall sharply as a large monthly rise in March – related to the end of the stamp duty holiday – drops out of the calculation. Lending typically follows money trends.

It is unusual for narrow money to lag broader measures when interest rates are falling – lower rates reduce the opportunity cost of holding more liquid forms of money, encouraging a shift out of time deposits and savings accounts. 21% of non-financial M1 is non-interest-bearing. The average interest rate on the stock of household time deposits fell by 31 bp between August and May, according to BoE data.

The demand to hold narrow money is driven mainly by the need to finance future spending, so weakness despite rate cuts is ominous for economic prospects. Put differently, money trends support the view here that MPC policy easing has been too slow, providing insufficient support for activity and increasing the risk of an inflation undershoot.

The monetary relapse could partly reflect payback for temporary factors that boosted growth in late 2024 / early 2025.

A jump in money numbers in October appears to have been related to asset sales in anticipation of changes to capital taxes in the Budget at the end of that month. An asset disposal can boost broad money if financing by the purchaser involves – directly or indirectly – an expansion of banks’ balance sheets*. The effect, however, would be expected to reverse as the seller of the asset deployed the proceeds.

Mortgage lending and broad money were boosted in Q1 by front-loading of housing transactions ahead of the end of the stamp duty holiday. Increased activity may also have resulted in a temporarily higher demand for narrow money.

A reversal of these effects may explain broad money stagnation and a narrow money decline in April / May. Still, annual rates of change should be free of such influences and have slowed to 2.5% for non-financial M1 and 3.6% for M4, from recent peaks of 3.4% and 4.8% respectively. Eurozone annual non-financial M1 growth, by contrast, has risen further to 4.3%.

The sectoral breakdown shows that the recent fall in narrow money reflects a switch by households into time deposits / cash ISAs – their aggregate money holdings have continued to expand, though at a slower pace. By contrast, corporate broad money contracted in April / May, consistent with a negative financial impact from NI and minimum wage hikes – chart 2.

Chart 2

Chart 2 showing UK Household & PNFC* Money (% 3m annualised) *PNFCs = Private Non-Financial Corporations

The annual rate of change of corporate broad money is back in negative territory, following small positive readings over December-April, suggesting further weakness in employment and fading capex prospects.

*More precisely, an expansion of banks’ domestic lending or net foreign assets, or a fall in their net non-deposit liabilities.

The directional signal from UK money growth is that annual core inflation – excluding policy distortions – will fall through end-2025. The level suggestion is that core will undershoot 2%. This suggestion is supported by recent exchange rate appreciation.

Turning points in annual broad money growth – as measured by non-financial M4 – have led turning points in core CPI or RPI inflation by a mean 26 months over the last c.70 years. Chart 1 highlights related troughs (gold dashed lines). (See a previous post for an equivalent chart highlighting peaks.)

Chart 1

Chart 1 showing UK Core Consumer / Retail Prices & Broad Money (% yoy)

The May 2023 core inflation peak occurred 27 months after a money growth peak.

Annual broad money momentum troughed at a 67-year low in October 2023. The mean 26-month lead suggests a core inflation low in December 2025. The median lag at troughs, however, was 29 months, so an inflation low may well occur later.

Core inflation fell sharply in H2 2023 and H1 2024 but has stalled since September. The expectation here is that May numbers released next week will show a decline, possibly to below 3%. (The core measure adjusts for the imposition of VAT on school fees and above-normal increases in water / sewerage charges and vehicle excise duty.)

Annual broad money growth averaged 4.2% in the 10 years to end-2019. Core inflation averaged 1.8% in the 10 years to February 2022 (i.e. allowing for a 26-month lag in the relationship).

Annual money growth moved slightly above 4.2% in late 2024 / early 2025 but dropped back to 3.9% in April. So the levels relationship of the 2010s suggests that core inflation will fall below 2%, with no significant rebound before 2027.

Historical variations in the lag between money growth and inflation – and in the levels relationship – often reflected the influence of the exchange rate.

For example, an inflation decline into 2000 occurred earlier than suggested by monetary trends because of a strong disinflationary impact from a prior surge in the exchange rate: the effective rate rose by 26% in the two years to April 1998 – chart 2. This impact was fading by early 2000, contributing to an unusually short interval between lows in money growth and inflation (six months).

Chart 2

Chart 2 showing UK Core Consumer / Retail Prices & Broad Money (% yoy) & Sterling Effective Rate (% 2y, inverted)

Exchange rate considerations are aligned with the monetary message currently, with a 7% rise in the effective rate in the two years to May suggesting that import prices will remain under downward pressure into 2026.

Eurozone / UK money growth has weakened despite rate cuts, suggesting that central banks – particularly the MPC – have more work to do to sustain economic expansion and prevent inflation undershoots.

Preferred broad money aggregates – Eurozone non-financial M3 and UK non-financial M4 – grew by 2.3% and 2.1% annualised respectively in the three months to April, down from 4.6% and 4.4% in the prior three months – see chart 1.

Chart 1

Chart 1 showing Eurozone & UK Broad / Narrow Money (% 3m annualised)

Concern about the Eurozone slowdown is tempered by still-respectable narrow money growth – non-financial M1 rose by 5.2% annualised between January and April versus 6.2% in the prior three months.

UK non-financial M1, by contrast, contracted by 1.7% annualised in the latest three months, following 6.5% growth in the three months to January.

The slump in UK momentum was driven by a month-on-month fall of 1.0% (not annualised) in April, mostly due to the household component. This may have been related to the end of the stamp duty holiday on 31 March – a bunching of transactions and mortgage borrowing ahead of the deadline may have been associated with a temporary rise in demand for sight deposits, which reversed in April as activity normalised.

An additional possibility is that individuals who sold assets in anticipation of tax rises in the October Budget delayed reinvesting the proceeds until the start of the 2025-26 tax year.

Household broad money rose by 0.2% in April despite the big fall in sight deposits, reflecting a record £14.0 billion inflow to cash ISAs.

Still, the movement of money out of current accounts is a negative signal for the economy, suggesting low spending intentions and a preference for saving.

UK corporate broad money, meanwhile, resumed a decline in the latest three months, suggesting that firms remain under financial pressure to cut jobs and investment.

UK April inflation numbers were much less bad than reported.

Annual headline and core CPI inflation rose by 0.9 pp and 0.4 pp respectively from March, to 3.5% and 3.8%. These increases, however, were entirely attributable to hikes in government-controlled prices and vehicle excise duty (VED).

Water and sewerage charges rose by 26% in April versus 8% a year earlier, boosting annual headline and core rates by 0.18 pp and 0.23 pp respectively.

“Other services for personal transport equipment” – a category dominated by VED – rose by 19% versus 4% a year ago, adding 0.22 pp and 0.28 pp to headline and core rates.

The household energy price cap was raised by 4.7% versus a 12.4% fall in April 2024, boosting the headline rate by 0.65 pp.

Summing the above, official actions added 1.05 pp to the headline rate and 0.51 pp to core – more than the actual March-April increases.

Accordingly, the adjusted core rate calculated here fell from 3.2% in March to 3.1%, equalling its recent low (in December and September 2024) – see chart 1.

Chart 1

Chart 1 showing UK Consumer Prices (% yoy)

This measure, moreover, takes no account of Easter timing effects, which may have further inflated the April outturn. For example, air fares rose by 27% last month versus 7% in April 2024, implying a 0.13 bp lift to annual core.

Underlying softening is consistent with lagged money trends and sterling appreciation – the effective rate is currently 3% above its 2024 average level and 7% higher than in 2023.

The MPC is concerned that another inflation pick-up, although unrelated to monetary policy, will generate “second-round” effects. Still-subdued money growth, currency strength and a weakening labour market argue for a relaxed view.

UK monetary trends have been arguing for faster MPC easing. Labour market news is now reinforcing the message.

Employment developments appear notably weaker in the UK than in other major economies. The PAYE payrolled employees series fell by 0.09%, 0.15% and a provisional 0.11% in February, March and April respectively. These declines are the equivalent of falls in US non-farm payrolls of 140k, 240k and 170k.

US payrolls, of course, have risen respectably year-to-date, while Eurozone employment grew by 0.3% in Q1.

The February-April UK payrolls contraction followed a pick-up in the rate of decline of the official single-month vacancies series (seasonally adjusted here), which has fallen to its lowest level since 2016 – see chart 1.

Chart 1

Chart 1 showing UK Employees & Vacancies* *Single Month, Own Seasonal Adjustment

Indeed job postings numbers closely track the official vacancies series and have declined further so far in May – chart 2. The Indeed numbers have fallen by more in the UK than elsewhere, to a lower level relative to the pre-pandemic (February 2020) starting point – chart 3.

Chart 2

Chart 2 showing UK Vacancies* & Indeed Job Postings *Single Month, Own Seasonal Adjustment

Chart 3

Chart 3 showing Indeed Job Postings (1 February 2020 = 100)

UK underperformance may be partly attributable to government-imposed rises in labour costs, in the form of the increases in employer national insurance and the minimum wage, and prospectively via the Employment Rights Bill.

Pessimism here about employment prospects, however, also reflected weak corporate money trends. The six-month rate of change of real M1 holdings of non-financial corporations has remained negative, in contrast to a rise into solid positive territory in the Eurozone – chart 4.

Chart 4

Chart 4 showing Eurozone / UK Corporate Real Narrow Money (% 6m)

Relative money weakness suggested that UK firms were under greater financial pressure to cut costs than their Eurozone counterparts.

A hopeful sign is that UK six-month corporate real money momentum has recovered recently, narrowing the gap with the Eurozone. A key issue is whether this revival is sustained as the NI and minimum wage hikes take effect.

UK employment weakness appears at odds with Q1 GDP “strength”. The UK quarterly numbers, however, have been volatile and year-on-year growth of 1.3% in Q1 is little different from the Eurozone (1.2%).

Front-running of US tariffs temporarily boosted GDP in the rest of the world last quarter. US real imports rose by 10.8%, equivalent to 1.4% of US GDP, between Q4 and Q1. GDP in the rest of the world is 2.7 times the US level measured at current market prices and 5.8 times based on purchasing power parity. Depending on which divisor is used, the US imports increase implies a 0.25-0.5% lift to GDP elsewhere.

A stabilisation in the stock of UK vacancies in the three months to February compared with the prior three months has been cited as evidence that labour demand is holding up despite survey indications of job cuts.

Analysis of “experimental” single-month data, however, indicates that stability of the three-month average conceals a small rise in vacancies in November / December that has more than reversed in January / February*. The February single-month number was the lowest since April 2021 and 4% below the pre-pandemic (i.e. December 2019) level – see chart 1.

Chart 1

Chart 1 showing UK Vacancies* & Indeed Job Postings *Single Month, Own Seasonal Adjustment

The timely Indeed job postings series also recorded a small increase at end-2024 before falling back in January / February, with the decline continuing in the first half of March (daily information is available through 14 March).

The fall in the single-month vacancies series in January / February was more than accounted for by a decline in non-government-related postings, i.e. openings in public administration, education and health are estimated to have risen after seasonal adjustment. The single-month “private sector” series was 12% below its December 2019 level in February.

Three-month on three-month growth of private sector regular pay remained strong in January but momentum of an employment-weighted average of PAYE data on median pay levels across industries is tracking lower, suggesting better official earnings news ahead – chart 2.

Chart 2

Chart 2 showing UK Private Average Weekly Regular Earnings (% 3m / 3m annualised)

*The single-month numbers require seasonal adjustment. A three-month average of the resulting series closely matches official numbers.

The Bank of England expects rises in regulated prices and taxes to push headline CPI inflation up to 3.5% by June but the forecast likely underestimates disinflationary pressure from monetary weakness.

The near-term inflation outlook globally is subject to cross-currents. Earlier monetary weakness is bearing down on underlying pressures but the position of the stockbuilding cycle suggests a rise in commodity prices: the cycle appears to be mid-upswing and industrial commodity prices typically climb into the peak – see chart 1.

Chart 1

Chart 1 showing G7 Stockbuilding as % of GDP (yoy change) & Industrial Commodity Prices (% yoy)

Higher tariffs, meanwhile, will have a one-off direct impact on measured prices and indirect effects via increased costs and supply disruption.

The UK near-term inflation profile is being additionally boosted by the imposition of VAT on school fees and large rises in some regulated prices. The Bank of England estimates that changes in the energy price cap will lift annual CPI inflation by 0.6 pp between December 2024 and June 2025, with the VAT effect and rises in regulated prices – including an average 26% increase in water bills – adding a further 0.45 pp.

Central banks, including the MPC, worry that a near-term inflation bump due one-off influences will dislodge expectations and become embedded. Monetarists argue that ample money growth is required for such “second-round” effects to emerge. G7 annual broad money growth continues to recover but is currently still below its pre-pandemic (i.e. 2015-19) average, which was associated with below-target headline and core inflation averages – chart 2. The same is true in the UK.

Chart 2

Chart 2 showing G7 Consumer Prices & Broad Money (% yoy)

Coming UK inflation numbers will require careful interpretation. The conventional core rate – excluding energy, food, alcohol and tobacco – will overstate underlying pressures because of the above policy effects. A “true” core measure should, at a minimum, exclude the impact of the VAT change and rises in bus fares and water bills.

The Bank of England staff forecast implies a rise in the conventional core rate from 3.2% in December 2024 to 3.6% by June 2025. Calculations here suggest that this would be consistent with the above “true” core measure slowing from 3.2% to 2.8% over the same period – chart 3.

Chart 3

Chart 3 showing UK Consumer Prices & Broad Money (% yoy)

The monetarist rule of thumb of a roughly two-year lag between monetary and price developments suggests strong downward pressure on underlying inflation in 2025. “True” core inflation may fall by significantly more than the Bank expects.

Charts 4 and 5 show a long-term history of annual broad money growth and an adjusted core inflation measure (based on RPI rather than CPI in earlier years), with related peaks and troughs highlighted. The mean and median lags at all the identified turning points were 26 and 28 months, i.e. slightly longer than posited by the rule of thumb. With broad money growth bottoming in October 2023, the suggestion is that a downtrend in underlying inflation will extend into late 2025 / early 2026.

Chart 4

Chart 4 showing UK Core Consumer / Retail Prices & Broad Money (% yoy) Mean / Median Lead Times at Highlighted Peaks = 26 / 27 Months

Chart 5

Chart 5 showing UK Core Consumer / Retail Prices & Broad Money (% yoy) Mean / Median Lead Times at Highlighted Troughs = 26 / 29 Months

The historical variability of the money growth / inflation lag in the UK mainly reflects the influence of the exchange rate. The favourable assessment of underlying inflation prospects above is conditional on avoidance of significant sterling depreciation.

UK money trends remain relatively weak, arguing that the MPC bears significant responsibility for economic underperformance.

Narrow and broad money – as measured by non-financial M1 / M4 – rose by 0.4% and 0.3% respectively in December, below gains of 0.9% and 0.6% for equivalent Eurozone measures,

UK six-month real narrow money momentum was static and barely positive in December, in contrast to higher and rising momentum in the Eurozone, Sweden and Switzerland, where policy rates fell by 100-150 bp during 2024 versus the UK’s 50 bp – see chart 1.

Chart 1

Chart 1 showing Real Narrow Money (% 6m)

Six-month growth of (nominal) broad money is similar in the UK and Eurozone (4.1% and 4.0% annualised respectively) but the UK sectoral breakdown is unfavourable – the increase was entirely attributable to households, with corporate money holdings stagnant.

The narrow money decomposition is worse. Six-month momentum of corporate real narrow money remains negative and has weakened since July. Eurozone momentum, by contrast, turned positive in October, rising further into year-end – charts 2 and 3.

Chart 2

Chart 2 showing UK GDP (% 2q) & Real Narrow Money (% 6m)

Chart 3

Chart 3 showing Eurozone GDP (% 2q) & Real Narrow Money (% 6m)

Corporate money weakness suggests that companies were under financial pressure to retrench before the Budget national insurance raid.

The contention here is that household money holdings were boosted by asset sales in anticipation of possible tax changes in the Budget – see previous post. This effect may still be inflating six-month household and aggregate broad money growth.

Households, in any case, are unlikely to be in the mood to spend “excess” money holdings against a backdrop of corporate gloom and rising job losses – unless the MPC accelerates rate cuts.

The MPC’s inappropriately restrictive stance encompasses its QT operations as well as rate policy. The Bank of England’s gilt holdings fell by the equivalent of 3.2% of the broad money stock in the 12 months to December versus comparable reductions of 1.8% and 2.0% respectively in the US and Eurozone (i.e. in Fed holdings of Treasuries and Eurosystem holdings of Eurozone government securities).

Monetary financing of the fiscal deficit (i.e. taking into account commercial banking system transactions in securities and changes in fiscal deposits as well as QE / QT) subtracted from broad money growth in the UK in the latest 12 months versus a neutral impact in the Eurozone / Japan and a significant positive contribution in the US – chart 4.

Chart 4

Chart 4 showing Monetary Financing of Fiscal Deficits* (12m sum, % of broad money) *Monetary Financing = Purchases of Government Securities (ex Agencies) by Central Bank & Other MFIs minus Change in Government Deposits

Monthly UK money growth was boosted by households scrambling to dispose of assets ahead of the Budget, with a reversal likely and corporate liquidity trends worryingly weak.

The narrow and broad money measures tracked here – non-financial M1 / M4 – rose by 0.9% in October, in both cases representing the largest monthly increase since 2021, when the Bank of England was still conducting QE.

Strength was focused on the household sector, with a monthly rise in M4 holdings of £20.2 billion (1.1%) versus a £7.6 billion average over the previous half-year – see chart 1.

Chart 1

Chart 1 showing UK Household Money (mom change, £ bn)

Six-month momentum of household real narrow money, which had edged into positive territory in September, rose to a three-year high. Corporate real narrow money momentum, by contrast, was the most negative since March, suggesting that firms were facing a financial squeeze before the Budget national insurance grab – chart 2.

Chart 2

Chart 2 showing UK GDP & Real Narrow Money (% 6m)

Corporate broad money holdings contracted at a 1.7% annualised rate in nominal terms in the six months to October, while M4 lending to the sector grew by 5.6%. The corporate liquidity ratio, therefore, fell at a 6.9% pace.

Households crystallised capital gains, accelerated property transactions and withdrew cash from pension funds to avoid mooted Budget tax hikes. Retail savers sold £5.9 billion of investment funds in October, the most since September 2022, according to the Investment Association. The number of residential property transactions rose by 10% on the month, with non-residential deals jumping 40% to a record.

An increase in asset turnover has no monetary impact where transactions are between UK residents and involve offsetting changes in the bank balances of buyers / sellers. A monetary boost occurs when UK-owned assets are sold to overseas residents and / or when transactions are associated with an increase in bank lending.

Non-financial M4 lending (i.e. to households and private non-financial corporations) rose by £7.2 billion in October versus a prior six-month average of £4.1 billion.

UK buyers of assets, moreover, may have made room for purchases by reducing demand for gilts, requiring an offsetting rise in bank lending to the public sector. Gilt sales to the UK non-bank private sector slowed to £6.1 billion in October versus a prior six-month average of £12.3 billion. The credit counterparts analysis shows a positive public sector contribution to the change in M4 of £11.0 billion (0.4%).

Sales of assets to overseas investors, meanwhile, may have been significant, judging from a £9.1 billion monthly fall in non-resident net sterling deposits.

Sellers of assets for tax reasons are unlikely to wish to retain permanently higher money balances. “Excess” funds may be used to repay bank lending, increase gilt purchases and buy assets from non-residents, resulting in a reversal of the monetary boost.

The suggestion is that the pick-up in household money momentum should be discounted, with greater weight given to deteriorating corporate trends.