Cycle analysis indicates that the global economy is in a time window for weakness, suggesting a significant risk that the Gulf War III shock triggers a recession. Real money trends will be key for assessing whether a negative scenario is playing out.

The housing, business investment and stockbuilding cycles average 18, 9 and 3.5 years respectively. The most recent lows are judged to have occurred in 2009, 2020 and 2023, suggesting that the next bottoms will be reached around 2027, 2029 and 2027. All three cycles, therefore, are expected to be in downswings over the next 1-3 years.

Cycle history suggests two possibilities. If the three downswings coincide, a major recession is likely. Historical precedents include the severe global downturns of 1974-75 and 2008-09.

If the cycle lows are spaced out over several years, the template would be the early 1990s – a longer period of rolling economic weakness involving a less damaging recession.

An earlier episode of triple cycle weakness in the late 1950s was also associated with a less pronounced recession but the fall in output on that occasion was limited by strong trend economic growth, reflecting post-war reconstruction.

The impact of shocks on the global economy depends on the cyclical backdrop. Activity bounced back strongly after the 2020 covid shock partly because the stockbuilding and business investment cycles were in time windows to enter recovery phases, while the housing cycle remained in an upswing.

Similarly, economic damage from the 2022 energy shock due to Russia’s invasion of Ukraine was limited by support from the business investment and housing cycles, with only the stockbuilding cycle then in a weak phase.

The timing of the Gulf War III shock echoes the 1973 Arab oil embargo, which hit as the three cycles were peaking and resulted in synchronised and self-reinforcing downswings into 1975 lows.

There are important mitigating differences from the 1973 shock. The oil price rise has been much smaller, while the oil intensity of GDP has fallen significantly. The 1973 shock occurred against a backdrop of double-digit G7 money growth, ensuring an inflationary outcome – current expansion is still low. Surging inflation forced major monetary policy tightening, the combined result being a severe real money squeeze – see chart 1.

Chart 1
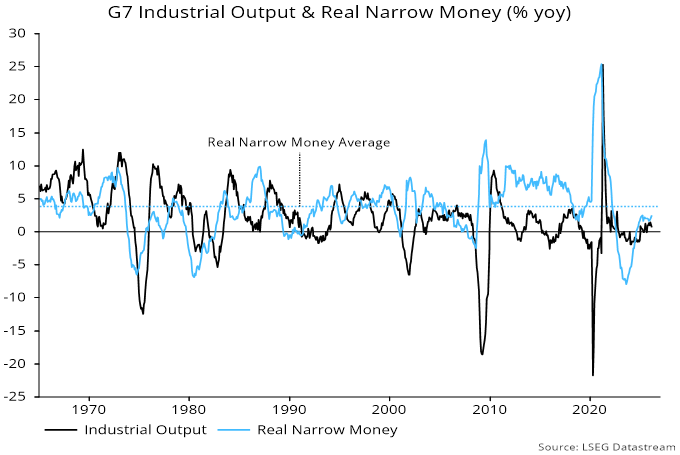
Chart 1 showing G7 Industrial Output & Real Narrow Money (% yoy)

Real money trends appeared modestly supportive before the current shock: global / G7 growth had firmed into early 2026, suggesting that economic expansion was on course to hold up through Q3.

The mechanical impact of higher energy and other costs on consumer price inflation will ensure a sharp slowdown in real money momentum into mid-year – chart 2. The extent of the decline will be key for assessing the likely degree of economic weakness. As noted, modest money growth argues against significant “second-round” inflation effects but central banks are hinting at precautionary tightening, which would magnify monetary weakness.

Chart 2
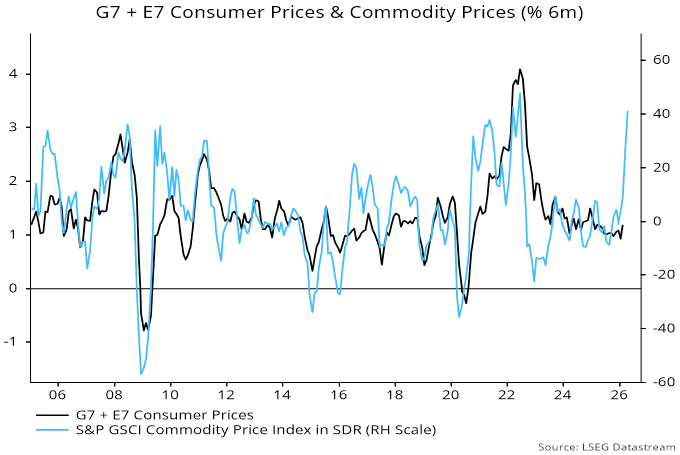
Chart 2 showing G7 + E7 Consumer Prices & Commodity Prices (% 6m)

A further risk is of “endogenous” monetary tightening if the Gulf War III shock interacts with recent problems in private lending, leading to a generalised reduction in credit availability. Such a shift could be signalled in ECB and Fed loan officer surveys due in late April and early May respectively.

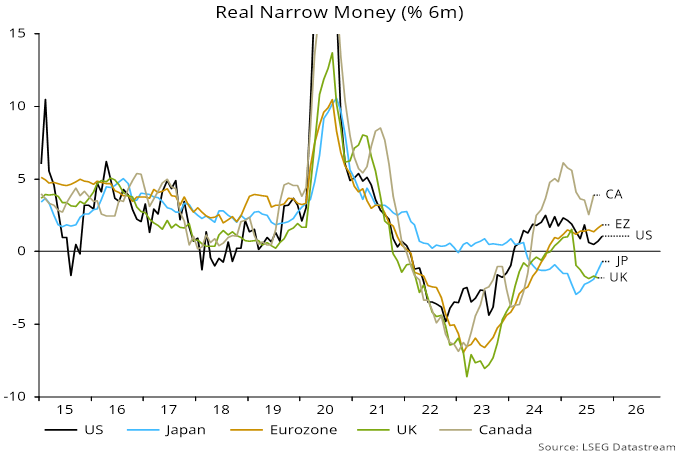
Country real money numbers through February suggest that US economic prospects were improving absolutely and relative to other majors before the shock – chart 3.

Chart 3
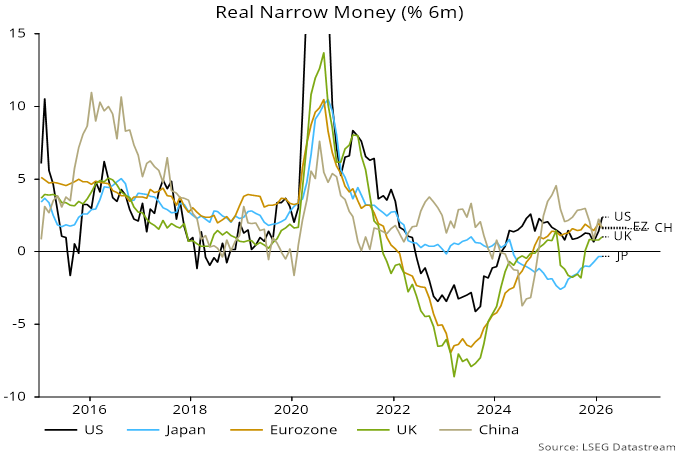
Chart 3 showing Real Narrow Money (% 6m)

Japanese monetary weakness continues to argue that BoJ policy tightening – via large-scale QT as well as rate hikes – has been misguided. As expected, core CPI inflation – ex. food and energy – has fallen and is below 2% even stripping out the impact of government subsidies.

Recoveries in Eurozone and UK real money momentum have stalled at unimpressive levels, suggesting dull economic prospects before the shock. Within the Eurozone, readings are similar across the large economies, with France no longer a negative outlier.

Chinese real money momentum has slowed but may hold up better than elsewhere going forward, reflecting stable interest rates and government intervention to limit price rises. A strong balance of payments position, partly stemming from a still significantly undervalued currency, is generating monetary inflows.

Cyclical equity market sectors had started to underperform before the shock. The cyclical / defensive relative is correlated with the stockbuilding cycle, which is not expected to bottom before late 2026 at the earliest – chart 4.

Chart 4
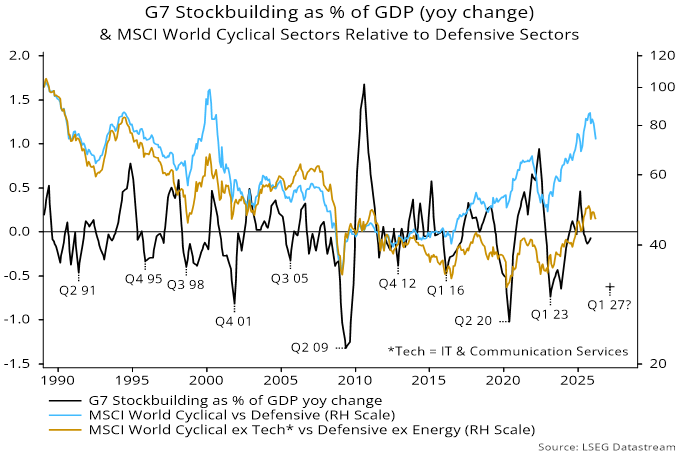
Chart 4 showing G7 Stockbuilding as % of GDP (yoy change) & MSCI World Cyclical Sectors Relative to Defensive Sectors


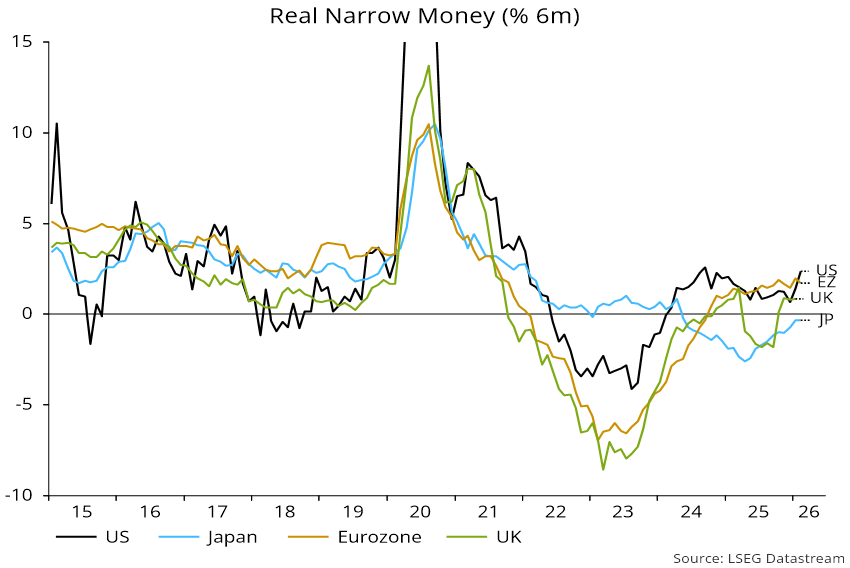
Monetary trends suggest that US economic prospects were improving relative to the Eurozone before the Gulf War III energy shock.

US six-month real narrow money growth rose to its highest since September 2024 last month – see chart 1. (The M1A aggregate used here – comprising currency in circulation and demand deposits – has been adjusted for a previously discussed distortion to November / December deposit data.)

Chart 1

Chart 1 showing Real Narrow Money (% 6m)

Comparable Eurozone growth, by contrast, eased slightly, resulting in the US taking the lead for the first time since June. Japanese momentum was stable in negative territory, while UK February money numbers have yet to be released.

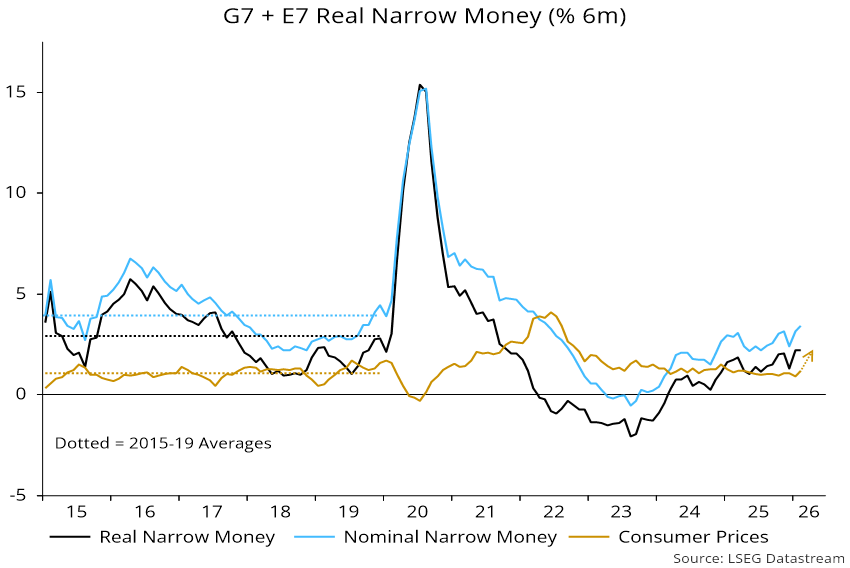
Global – i.e. G7 plus E7 – six-month real narrow money growth is estimated to have been little changed from January’s high, based on monetary data covering 88% of the aggregate – chart 2. So global economic momentum appears to have been on course to hold up through Q3 before the Gulf War III shock.

Chart 2

Chart 2 showing G7 + E7 Real Narrow Money (% 6m)

An early, sharp reversal in real money growth is in prospect, however, as the energy shock boosts six-month consumer price momentum. Higher interest rates, meanwhile, will likely slow nominal money expansion.

Real money trends, therefore, may be moving into alignment with a forecast based on cycle analysis of significant economic weakness in H2 2026-2027.

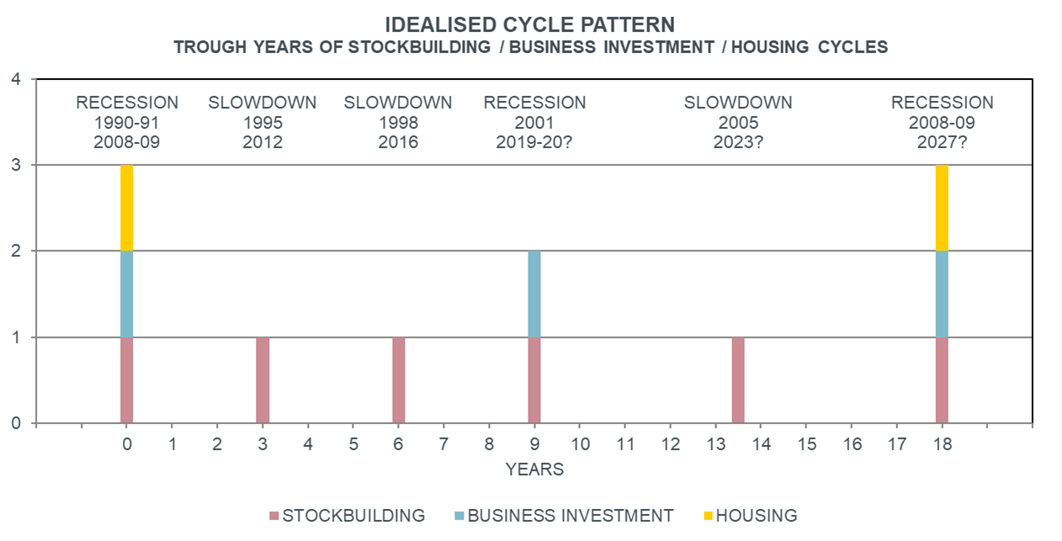
The long-standing forecast here has been that the three key global economic cycles – stockbuilding, business investment and housing – would enter downswings by 2026-27.

In the event that the downswings were synchronised, the result would be a major recession, on the scale of 1974-75 or 2008-09.

If the downswings occurred successively, the result would be a long period of rolling weakness including a less severe recession – the early 1990s scenario.

Chart 1 is an exhibit used in 2018, suggesting – based on average cycle timings – a recession bottoming in 2019-20, a slowdown into 2023 and a major recession around 2027. The former two played out.

Chart 1

Chart 1 showing Idealised Cycle Pattern Trough Years of Stockbuilding / Business Investment / Housing Cycles

The housing cycle is already in a downswing, the stockbuilding cycle is at or close to a peak, while the business investment cycle is well-advanced. The Gulf War III energy price shock could be the trigger for synchronised weakness.

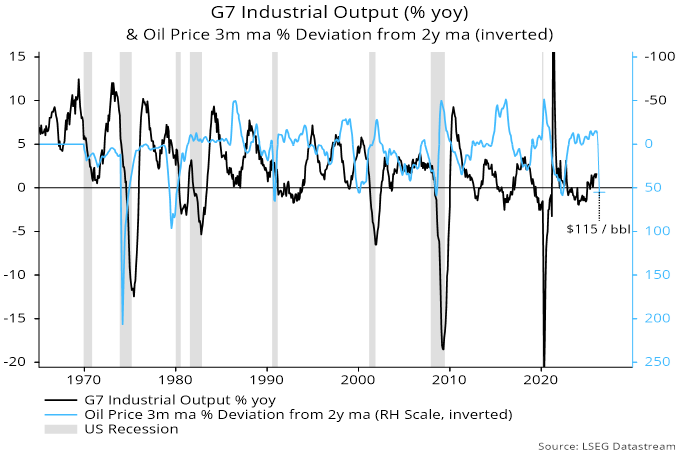
There have been six oil price “shocks” since the 1960s, defined here as episodes in which the spot price rose 50% or more above its two-year moving average for at least three months. All were followed by a significant contraction in G7 industrial output and five were associated with a US recession, as determined by the NBER – chart 2.

Chart 2

Chart 2 showing G7 Industrial Output (% yoy) & Oil Price 3m ma % Deviation from 2y ma (inverted)

Spot Brent of $100 per barrel represents a 37% premium to the two-year moving average. Oil would have to be sustained at about $115 for three months for the current spike to qualify as a “shock”.

The oil intensity of GDP has fallen dramatically since the 1970s, suggesting less vulnerability to shocks. This could explain why the most recent shock – in 2022 – did not involve a US recession.

An alternative view is that a recession was avoided because the cyclical backdrop was less unfavourable and there was pent-up demand due to pandemic disruption, reflected in a large monetary overhang. The stockbuilding cycle turned down in 2022 but the housing and business investment cycles were in late upswing and recovery phases respectively.

The prior shocks caused short-term inflation spikes and were associated with upward pressure on interest rates, contributing to a fall in nominal narrow money momentum. G7 real money contracted ahead of maximum economic weakness. Real money data will be key for assessing the extent of current economic damage.

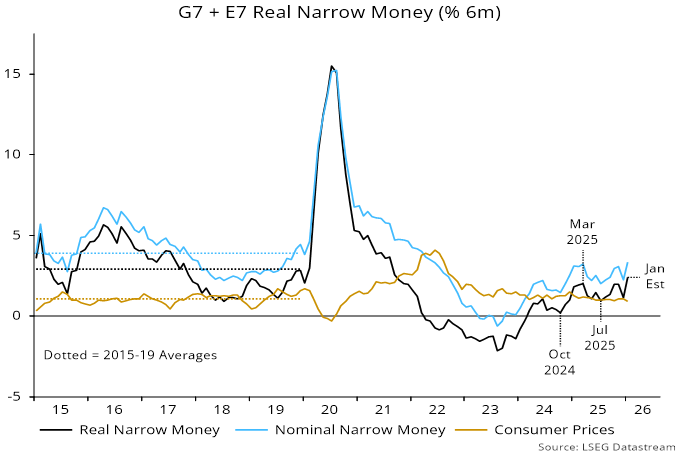
Global six-month real narrow money momentum is estimated to have rebounded from a sharp December fall to reach a new high in January, based on monetary data covering three-quarters of the G7 plus E7 aggregate tracked here – see chart 1.

Chart 1

Chart 1 showing G7 + E7 Real Narrow Money (% 6m)

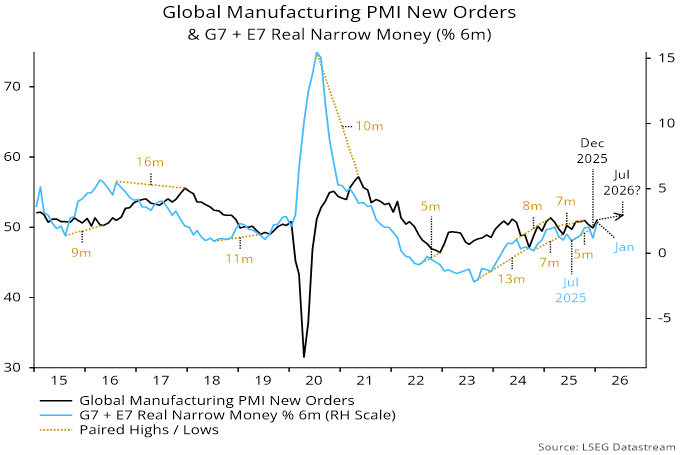
The December drop was the basis for an earlier forecast that a rise in global manufacturing PMI new orders would fizzle out in Q2, with a relapse into Q3. The January monetary news suggests that the current upswing will be sustained into H2 – chart 2.

Chart 2

Chart 2 showing Global Manufacturing PMI New Orders & G7 + E7 Real Narrow Money (% 6m)

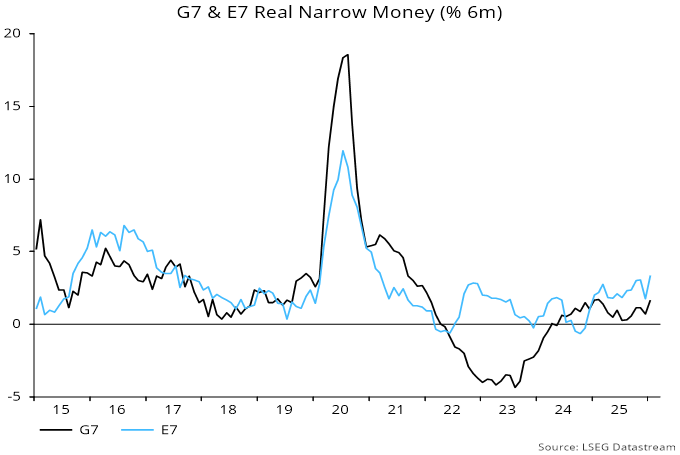
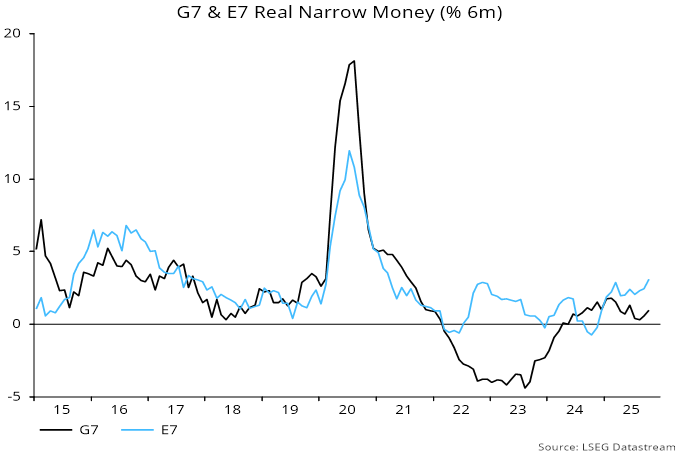
Both G7 and E7 components contributed to the January rise in real money momentum, but the G7 series is estimated to have remained below a February 2025 peak, whereas E7 momentum reached a new high – chart 3.

Chart 3

Chart 3 showing G7 & E7 Real Narrow Money (% 6m)

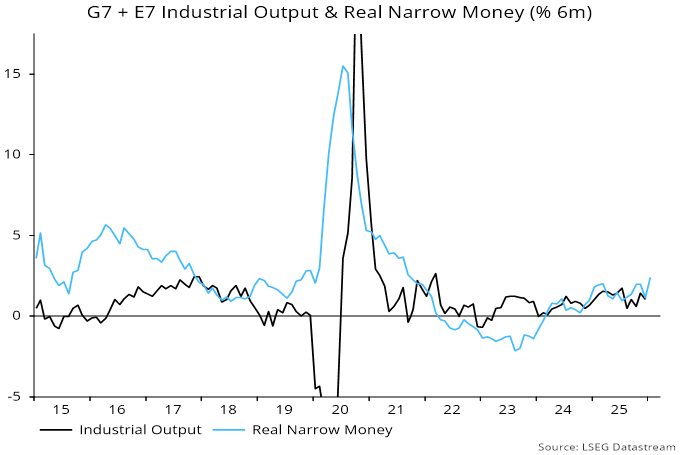
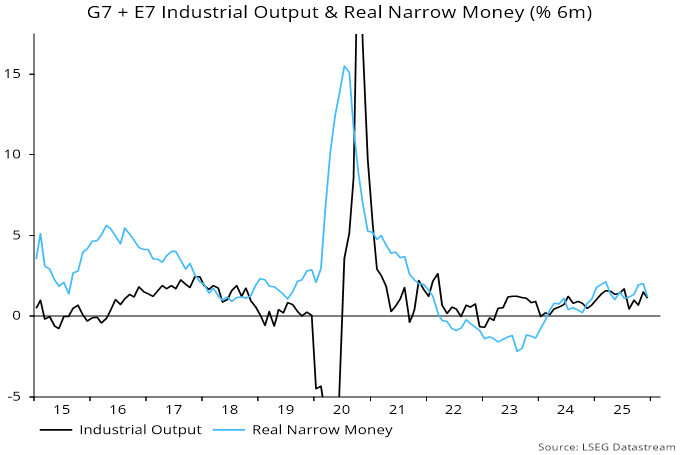
The rebound in global real money growth has likely restored a positive differential with industrial output momentum, suggesting “excess” money support for markets – chart 4.

Chart 4
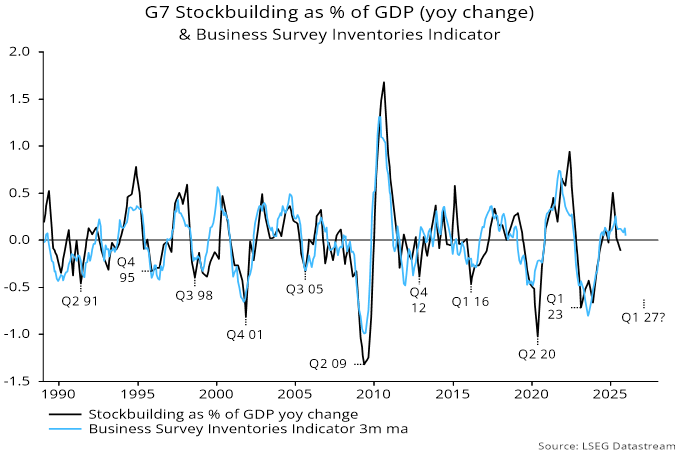
Chart 4 showing G7 + E7 Industrial Output & Real Narrow Money (% 6m)

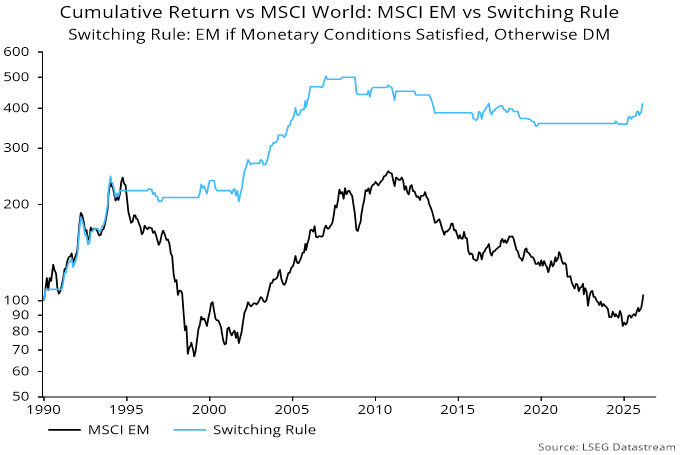
Previous posts noted that EM equities outperformed DM on average historically in months following positive readings of this differential and the E7 / G7 real money growth gap (allowing for reporting lags). The joint condition was in place in nine of the last 12 months. Chart 5 shows the performance of a monthly switching rule that prefers EM only when the joint condition is satisfied, otherwise reverting to DM. The latest news implies that the rule will continue to favour EM in March and, probably, April.

Chart 5

Chart 5 showing Cumulative Return vs MSCI World: MSCI EM vs Switching Rule Switching Rule: EM if Monetary Conditions Satisfied, Otherwise DM

A January post noted the possibility that global six-month real narrow money momentum had crossed below industrial output growth in December, suggesting less favourable monetary conditions for markets. Recent dramatic sell-offs in some speculative assets could reflect such a shift.

The suggestion is still tentative: additional – but not yet complete – December data indicate that the two series converged rather than intersected – see chart 1.

Chart 1

Chart 1 showing G7 + E7 Industrial Output & Real Narrow Money (% 6m)

Will a cross-over be confirmed soon? Monetary prospects are uncertain but stronger January manufacturing PMI results suggest a rise in six-month industrial output momentum in early 2026.

In data since 1970, global equities outperformed US dollar cash significantly on average in months following a positive reading of the gap between real money and output momentum (by 12.0% annualised). (The calculation allows for reporting lags.)

By contrast, negative gaps were associated with average underperformance in the following month (of 5.5%).

Needless to say, these averages conceal frequent “misses” in both directions.

The six-month real money / output momentum gap was positive in most months in 2025. It was, however, negative in 2023 and much of 2024, when equities rallied strongly.

As previously discussed, the six-month gap was a misleading guide to “excess” money over this period because of a large monetary overhang from the money growth surge in 2020-21.

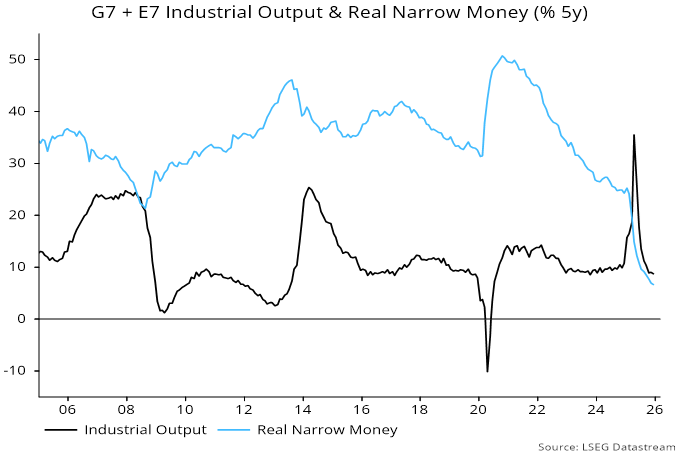
A simple way of illustrating this overhang is to compare five-year growth rates of real money and industrial output. Real money growth was still much higher in 2023 – chart 2.

Chart 2

Chart 2 showing G7 + E7 Industrial Output & Real Narrow Money (% 5y)

The five-year gap turned negative last year. It last closed in the early stages of the GFC bear market.

Back then, the six-month gap had been negative for more than a year. The closing of the five-year gap was followed by an acceleration of the market decline.

With the five-year gap already negative, a negative shift in the six-month gap could be reflected in more immediate market weakness than in 2007-08.

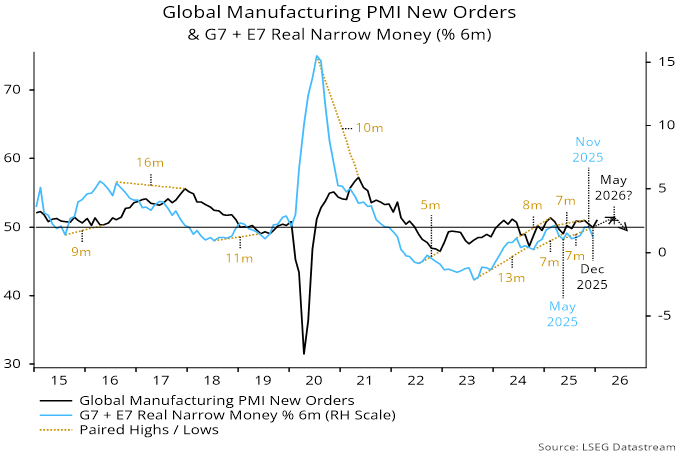
Global manufacturing PMI new orders recovered strongly in January following a November / December relapse. Both the fall and revival had been signalled by money trends: global six-month real narrow money momentum declined sharply in April / May 2025 but rebounded into November. The seven-month interval between a (revised) May low in real money momentum and the December PMI trough matches the lead time at the prior two turning points – see chart 1.

Chart 1

Chart 1 showing Global Manufacturing PMI New Orders & G7 + E7 Real Narrow Money (% 6m)

The rise in real narrow money momentum into November suggests that the PMI upswing will extend into Q2. As foreshadowed in a previous post, however, real money momentum declined sharply in December, retracing most of its May-November gain. Accordingly, the manufacturing bounce is expected to fizzle out in Q2, with renewed weakness into Q3.

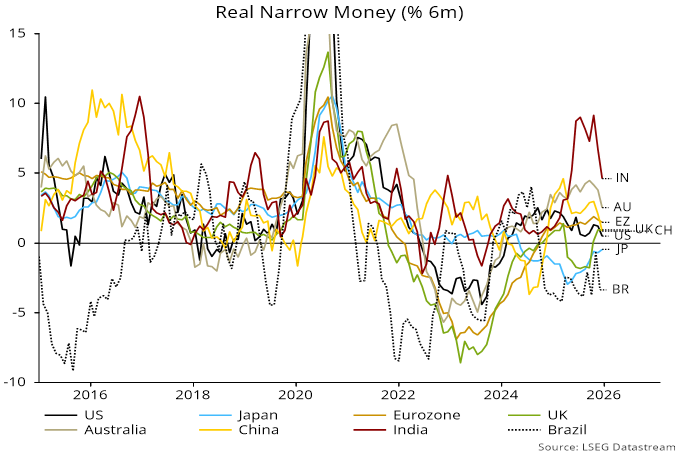
Real narrow money momentum has slowed across most major economies, though to varying degrees. China and India have contributed most to the global decline, although the Indian number remains strong – chart 2.

Chart 2

Chart 2 showing Real Narrow Money (% 6m)

The US series shown incorporates an adjustment for a suggested distortion to demand deposit data affecting the M1A measure used here. However, substituting the official M1 measure – unaffected by the mooted distortion – for M1A would give the same current reading.

Eurozone momentum remains above the US level while the UK has recovered from significant weakness in mid-2025, suggesting improving relative economic prospects. Still, both series have stalled at modest levels, cautioning against optimism.

Japanese real narrow money contraction continues to flag a policy mistake, while a faster decline in Brazil argues for urgent rate cuts. (The Brazil manufacturing PMI was the weakest in the global stable in January.)

Elsewhere, prior strength in Australian real narrow money momentum is consistent with recent upbeat economic news but a slowdown since September suggests that prospects were cooling before this week’s rate hike.

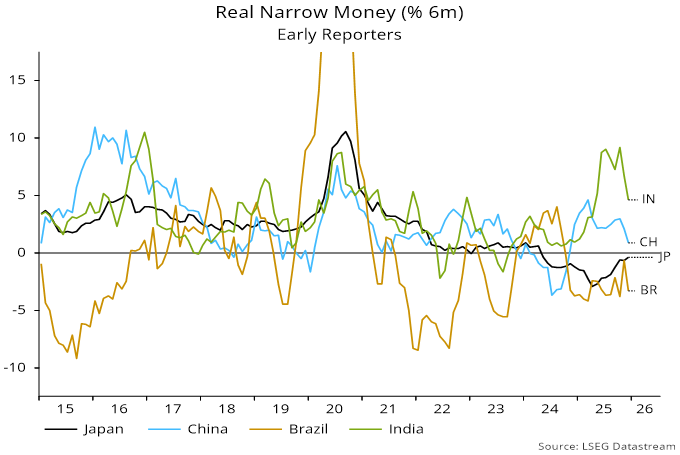
Chinese economic growth held up in H2 2025 but a fall in six-month real narrow money momentum in November-December suggests weakening prospects – see chart 1.

Chart 1

Chart 1 showing Real Narrow Money (% 6m) Early Reporters

December money numbers are also available for Brazil, India and Japan, showing declines in momentum for the former two, with Japan remaining negative.

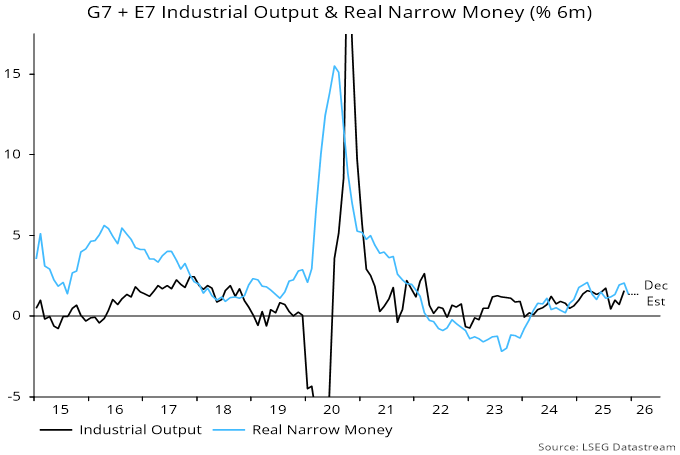
US and European data will be released next week. Assuming unchanged growth rates, the above information implies a significant fall in global (i.e. G7 plus E7) six-month real narrow money momentum, retracing much of the July-November recovery – chart 2.

Chart 2

Chart 2 showing G7 + E7 Industrial Output & Real Narrow Money (% 6m)

Global real money momentum may be about to cross beneath six-month industrial output growth, which rose into November.

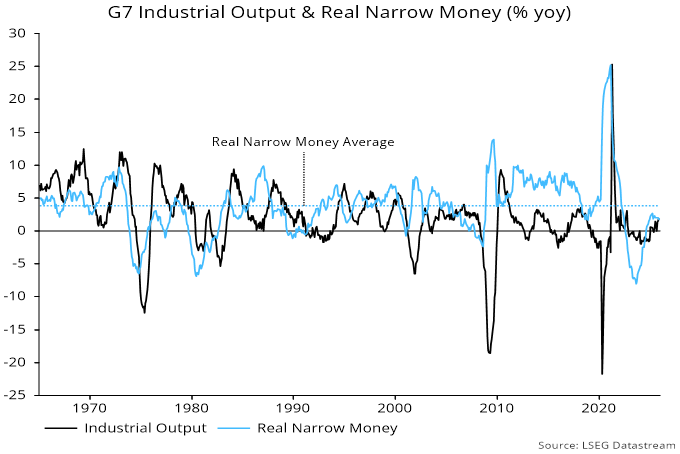
Chart 3 shows a long-term comparison of G7-only real narrow money and industrial output momentum, using 12- rather than six-month rates of change. The series converged in November, supporting the suggestion of a change in “excess” money conditions.

Chart 3

Chart 3 showing G7 Industrial Output & Real Narrow Money (% yoy)

Signs of a narrow money slowdown, albeit tentative, are consistent with the negative cyclical view here, based on an expectation that the global stockbuilding cycle will enter a downswing this year into a possible H1 2027 low.

The analytical approach used here is giving mixed messages for 2026 prospects. Global monetary trends appear modestly supportive of economic growth and markets, but the stockbuilding cycle remains on course to enter a downswing this year, with the housing cycle also in a time window for weakness.

Further considerations are likely suppression of labour demand from AI deployment and the unusual magnitude of gains in risk asset prices during the upswing phase of the current stockbuilding cycle.

The judgement here is to give greater weight to cyclical influences and plan for a negative shift in the investment environment during 2026, with caution to be reinforced in the event of deterioration in monetary indicators and / or data confirmation that a stockbuilding downswing is under way.

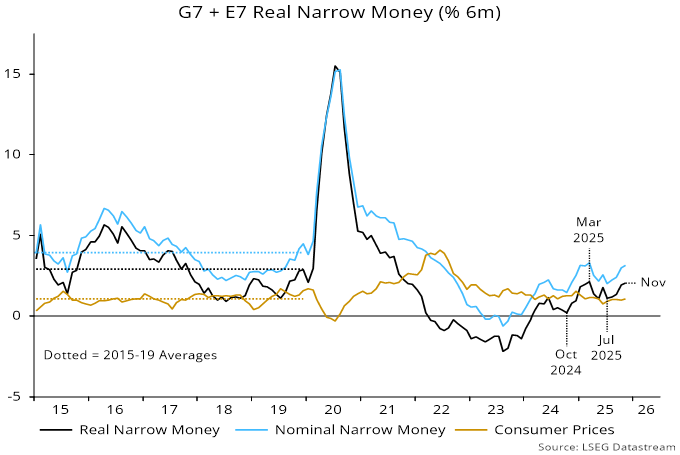
Global six-month real narrow money momentum – the key monetary leading indicator employed here – fell between March and July 2025 but recovered into November. The decline and rebound were driven by nominal money trends, with global CPI momentum stable at around its pre-pandemic pace (vindicating the monetarist forecast of full retracement of the 2021-22 inflation spike) – see chart 1.

Chart 1

Chart 1 showing G7 + E7 Real Narrow Money (% 6m)

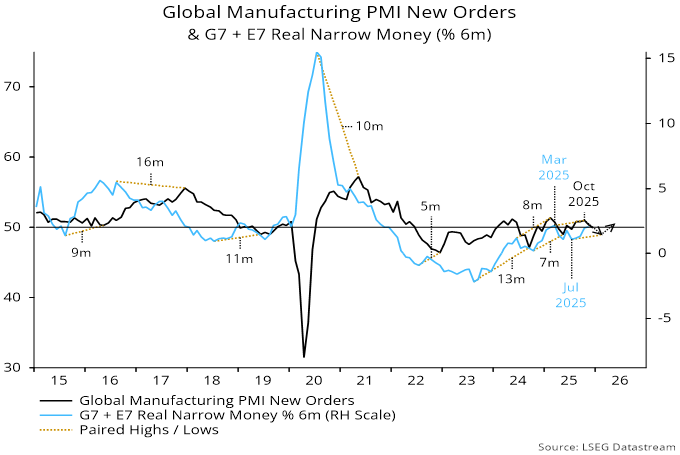
The earlier fall in real money momentum has been reflected in a decline in global manufacturing PMI new orders – a timely indicator of economic momentum – from an October peak. Based on recent lead times, however, the monetary rebound suggests that the PMI will bottom out in early 2026, with a recovery into mid-year – chart 2.

Chart 2

Chart 2 showing Global Manufacturing PMI New Orders & G7 + E7 Real Narrow Money (% 6m)

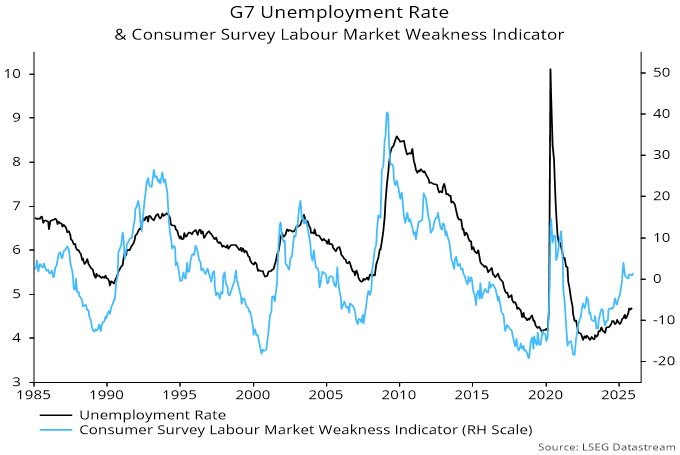
While global growth may hold up in H1, it may not be strong enough to prevent a further rise in unemployment rates, partly reflecting AI job displacement – chart 3.

Chart 3

Chart 3 showing G7 Unemployment Rate & Consumer Survey Labour Market Weakness Indicator

Meanwhile, the stockbuilding cycle – averaging 3.5 years in length historically – remains on course to enter a downswing in 2026, with a possible low in H1 2027. The focus here is on the survey-based indicator shown in chart 4, which has been moving sideways at a level consistent with a cycle peak – a decline into negative territory would confirm a phase shift.

Chart 4

Chart 4 showing G7 Stockbuilding as % of GDP (yoy change) & Business Survey Inventories Indicator

Global inflation is expected to be little changed in 2026, with downside risk judged greater than upside. A key consideration is that G7 annual broad money growth, while recovering further over the past year, remains below its pre-pandemic average – chart 5.

Chart 5

Chart 5 showing G7 Consumer Prices & Broad Money (% yoy)

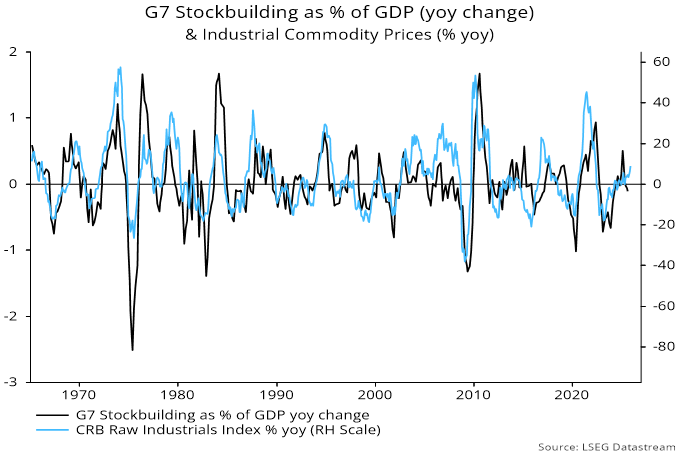
A downside surprise could arise from AI job displacement depressing wage growth. One upside risk is a near-term burst of commodity price strength before the stockbuilding cycle moves into a downswing. Industrial commodity prices rose by less than usual earlier in the upswing and a catch-up could be in progress – chart 6.

Chart 6

Chart 6 showing G7 Stockbuilding as % of GDP (yoy change) & Industrial Commodity Prices (% yoy)

The expected transition in the stockbuilding cycle coincides with the housing cycle – averaging 18 years, with a previous trough in 2009 – being in a time window for weakness. G7 housing investment moved sideways between 2023 and H1 2025 but fell to a new low in Q3 – chart 7.

Chart 7

Chart 7 showing G7 Housing Investment (Q1 1970 = 100)

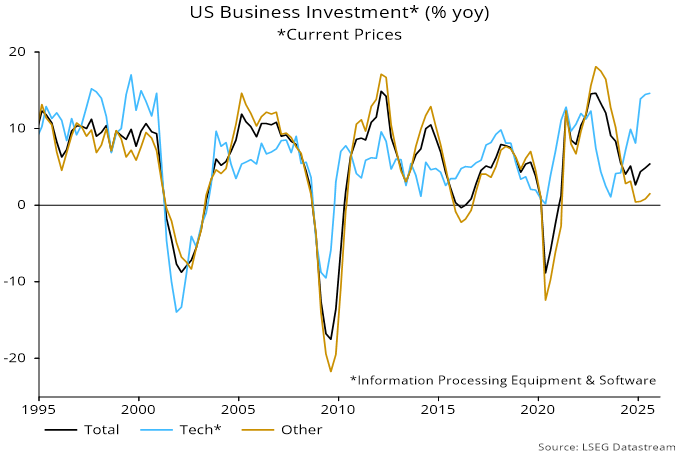
Cyclical hopes rest on further strength in business investment, which follows an average 9-year cycle, with a previous low in 2020. While tech capex is booming, however, it accounts for only one-third of US business investment (and less than 5% of GDP), with other segments weak – chart 8.

Chart 8

Chart 8 showing US Business Investment* (% yoy) *Current Prices

The dispersion of real narrow money momentum across countries has narrowed – chart 9. Adjusted for a recent apparent data distortion, US momentum remains slightly below the Eurozone level. Japan is still a negative outlier but the UK has returned to mid-range. Strength in Australia / Canada suggests upside economic and rates risk, with an opposite message from a Swedish move into contraction.

Chart 9

Chart 9 showing Real Narrow Money (% 6m)

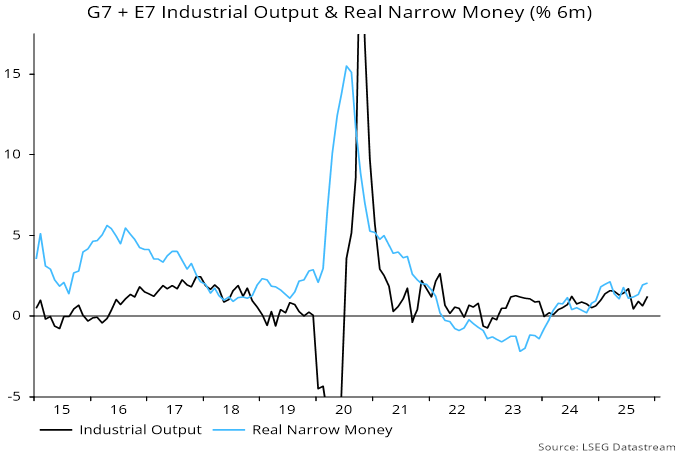
Global real narrow money momentum remains below its long-run average but is nevertheless above weak industrial output momentum, suggesting “excess” money support for markets – chart 10.

Chart 10

Chart 10 showing G7 + E7 Industrial Output & Real Narrow Money (% 6m)

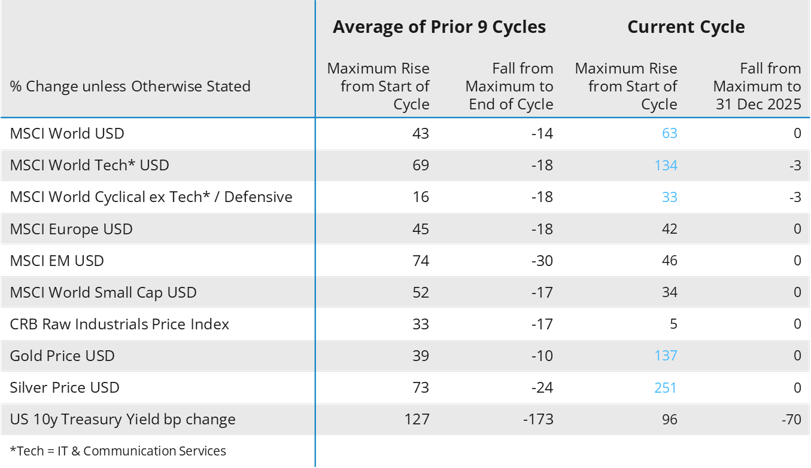
Against this, risk assets have usually corrected – or worse – in the 18 months leading up to stockbuilding cycle troughs, with another such window now open on the analysis here. Table 1 compares moves in selected asset prices in the current cycle with averages across the previous nine cycles, with the mean maximum rise from the beginning of the cycle in column 1 and the subsequent fall into the cycle trough in column 2.

Table 1

Table 1 compares moves in selected asset prices in the current cycle with averages across the previous nine cycles, with the mean maximum rise from the beginning of the cycle in column 1 and the subsequent fall into the cycle trough in column 2.

Global / US equities, tech and other cyclical sectors, and precious metals have significantly outperformed their average gains in the current cycle, suggesting larger-than-normal reversals into the cycle trough. By contrast, European equities, EM, small caps and industrial commodity prices are lagging their respective averages, so may have more upside potential while a positive environment persists and / or prove more resilient in a subsequent risk-off phase.

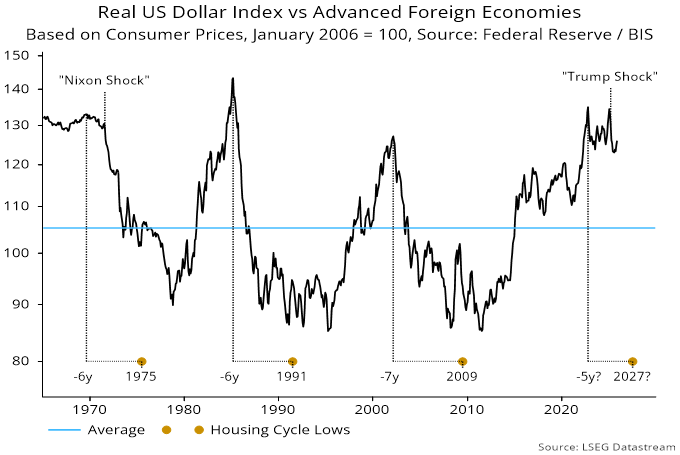
A fall in the US dollar boosted risk appetite in 2025. The timing of the decline echoes the last three housing cycles, in which the dollar trended lower from an overvalued level in the years preceding and beyond the cycle trough – chart 11.

Chart 11

Chart 11 showing Real US Dollar Index vs Advanced Foreign Economies Based on Consumer Prices, January 2006 = 100, Source: Federal Reserve / BIS

US currency weakness could become market-negative if a decline becomes disorderly, resulting in upward pressure on longer-term rates, for example in the event of further fiscal profligacy or unwarranted additional rate cuts by a politically controlled Fed. Alternatively, a negative market shift could be triggered by a temporary dollar rebound, if US economic news surprises positively and the Fed remains orthodox. Dollar sentiment and positioning were contrarian-bearish at the start of 2025 but current signals are neutral / positive.

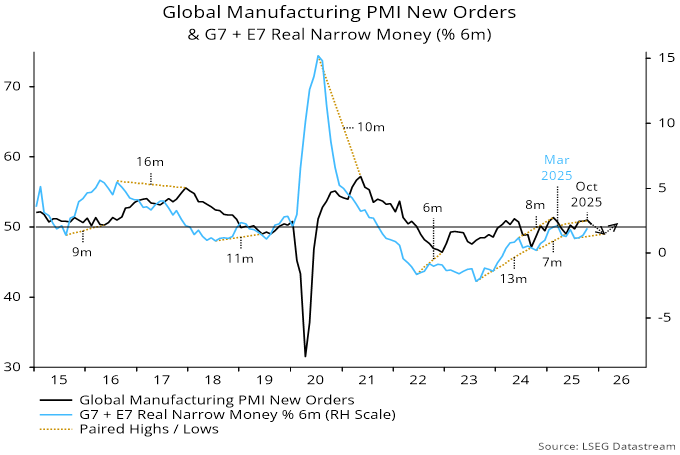
Global manufacturing PMI new orders fell back in November, consistent with the forecast here of an inflection weaker from late 2025, based on a slowdown in six-month real narrow money momentum from a March peak – see chart 1.

Chart 1

Chart 1 showing Global Manufacturing PMI New Orders & G7 + E7 Real Narrow Money (% 6m)

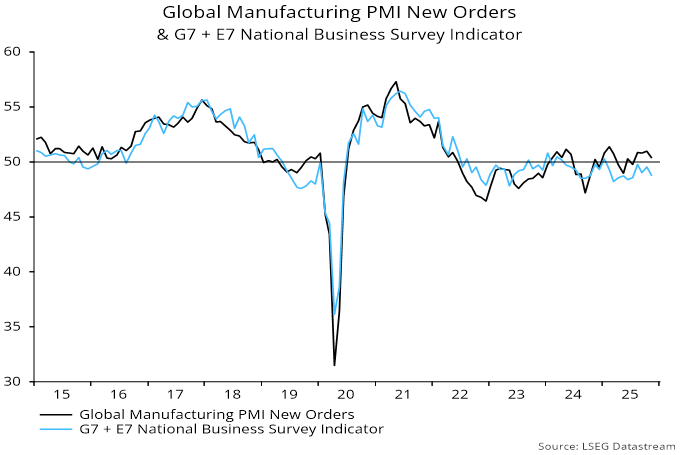
The PMI decline was mirrored by an alternative global survey indicator derived from national polls. The alternative indicator has been undershooting the PMI recently, reflecting relative weakness in the US ISM and Chinese NBS surveys compared with their S&P Global counterparts – chart 2.

Chart 2

Chart 2 showing Global Manufacturing PMI New Orders & G7 + E7 National Business Survey Indicator

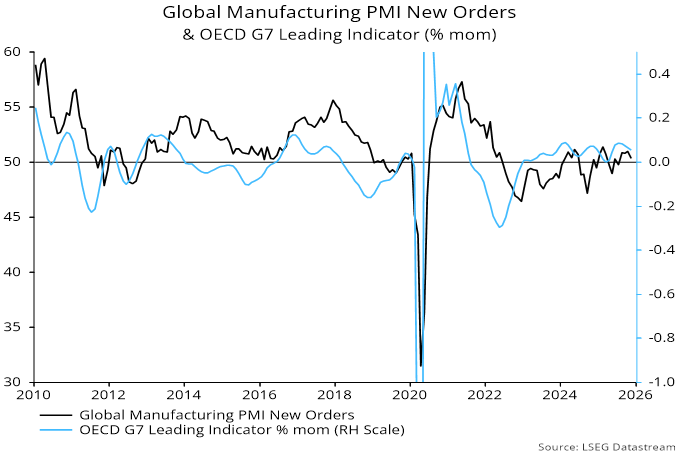
The suggestion of a turning point is supported by the OECD’s G7 composite leading index. The one-month change in the index usually moves ahead of the PMI and peaked in July, easing further in November. The slowdown, however, has been minor and numbers can be revised – chart 3.

Chart 3

Chart 3 showing Global Manufacturing PMI New Orders & OECD G7 Leading Indicator (% mom)

A recovery in real money momentum since July suggests a PMI low around end-Q1. Still, approaching downswings in the stockbuilding and housing cycles argue against a sustained rebound.

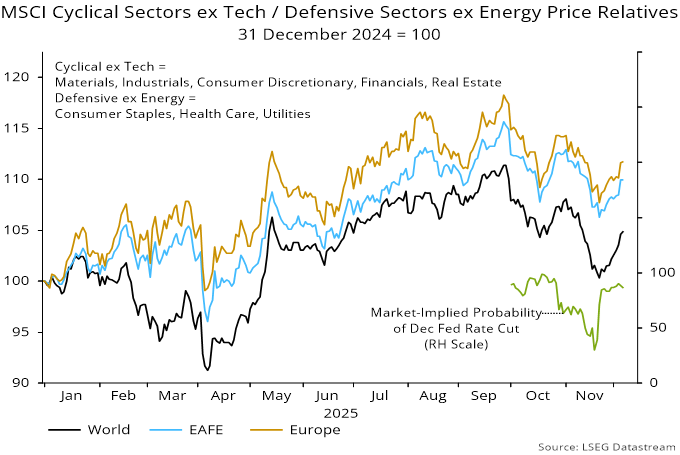
PMI swings are typically mirrored by the price relative of cyclical equity market sectors (excluding IT and communication services) versus defensive sectors (excluding energy). Relatives peaked in September, consistent with the October PMI high, but have rallied with rising Fed rate cut expectations – chart 4. A further PMI decline into late Q1 could be associated with renewed underperformance.

Chart 4

Chart 4 showing MSCI Cyclical Sectors ex Tech / Defensive Sectors ex Energy Price Relatives 31 December 2024 = 100


Global money trends suggest that major economic weakness will be deferred until later in 2026.

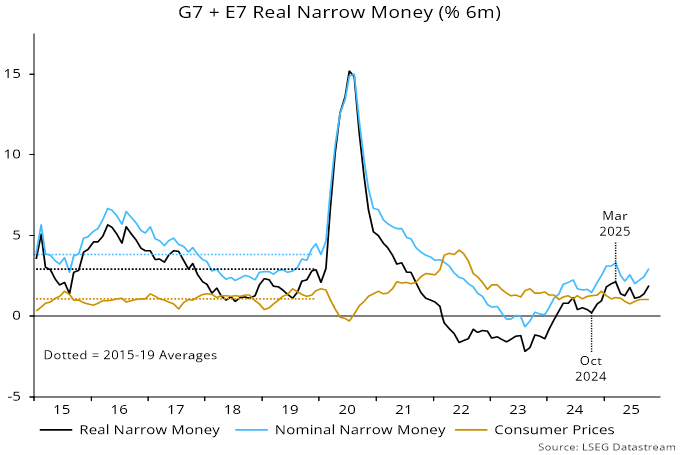
Six-month real narrow money momentum in the G7 and seven large emerging economies recovered further in October, almost returning to its March high – see chart 1.

Chart 1

Chart 1 showing G7 + E7 Real Narrow Money (% 6m) Six-month real narrow money momentum in the G7 and seven large emerging economies recovered further in October, almost returning to its March high – see chart 1.

The fall from March into the summer is expected here to be reflected in a slowdown in industrial momentum – as proxied by global manufacturing PMI new orders – into late Q1 2026. The recent money growth recovery suggests a partial PMI rebound in Q2 – chart 2.

Chart 2

Chart 2 showing Global Manufacturing PMI New Orders & G7 + E7 Real Narrow Money (% 6m)

The cyclical framework used here implies rising recession risk, with the stockbuilding and housing cycles in time windows to begin downswings. Monetary weakness would signal that a negative scenario is crystallising. The latest numbers appear to signal a delay.

The composition of the money growth rebound gives pause. The return towards the March high has been driven by further strength in the E7 component, with G7 real money momentum lagging significantly – chart 3.

Chart 3

Chart 3 showing G7 + E7 Real Narrow Money (% 6m) The composition of the money growth rebound gives pause. The return towards the March high has been driven by further strength in the E7 component, with G7 real money momentum lagging significantly – chart 3.

Narrow money trends are respectable or strong across major EMs, with the exception of Brazil – chart 4.

Chart 4
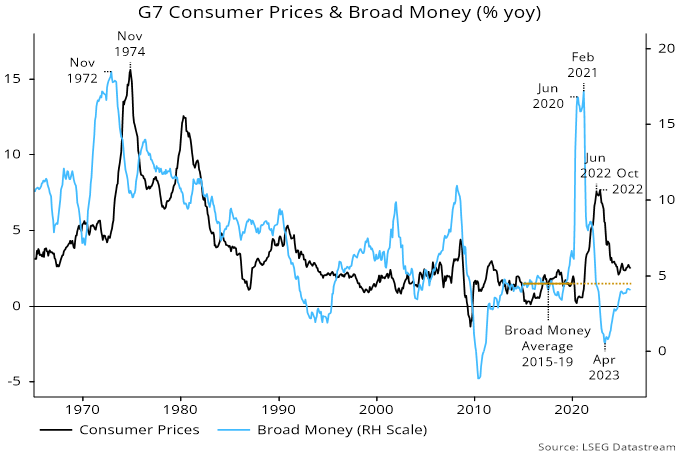
Chart 4 showing Real Narrow Money (% 6m) Narrow money trends are respectable or strong across major EMs, with the exception of Brazil – chart 4.
Soft G7 growth reflects a slowdown in the US and continued – though moderating – weakness in Japan and the UK. Eurozone momentum rose further last month, though remains unexceptional.

Chart 5

Chart 5 showing Real Narrow Money (% 6m) Soft G7 growth reflects a slowdown in the US and continued – though moderating – weakness in Japan and the UK. Eurozone momentum rose further last month, though remains unexceptional.