Cycle analysis suggests economic and market weakness in 2026-27. A recent monetary slowdown is consistent with this perspective but needs to extend to confirm a negative scenario.

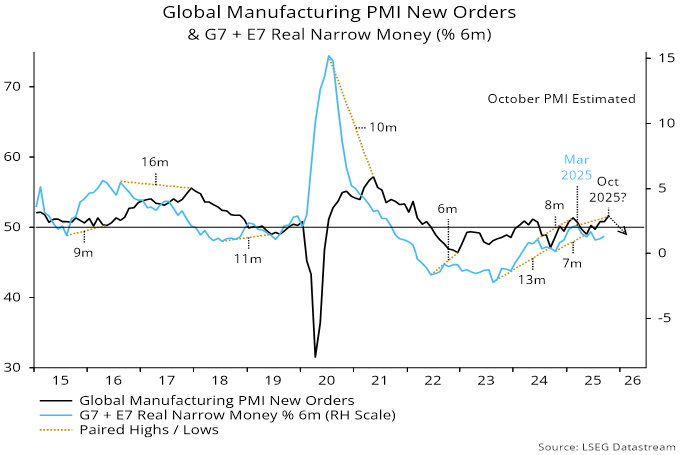
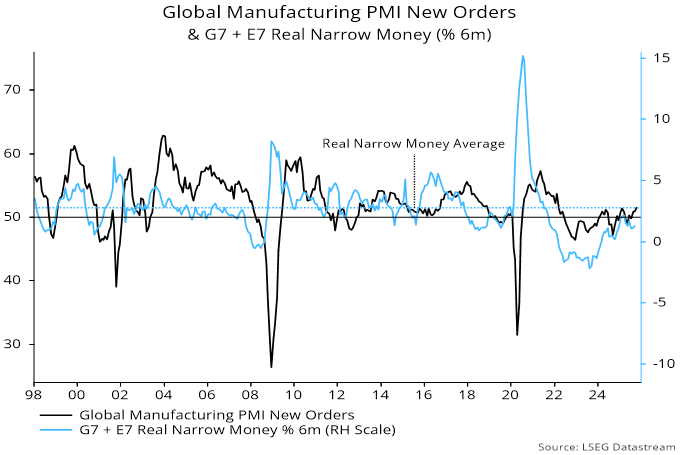
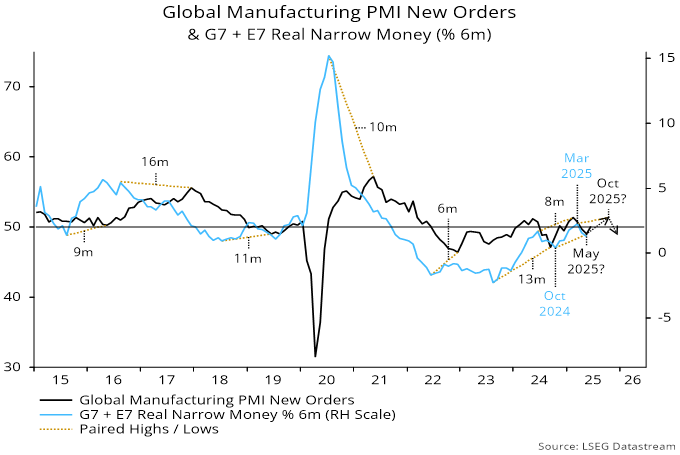
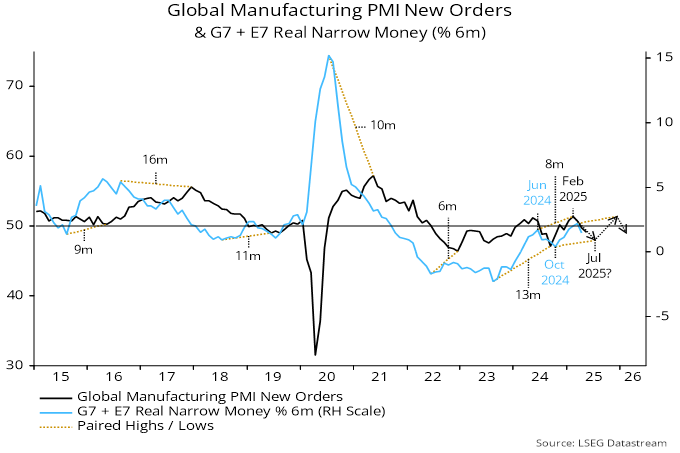
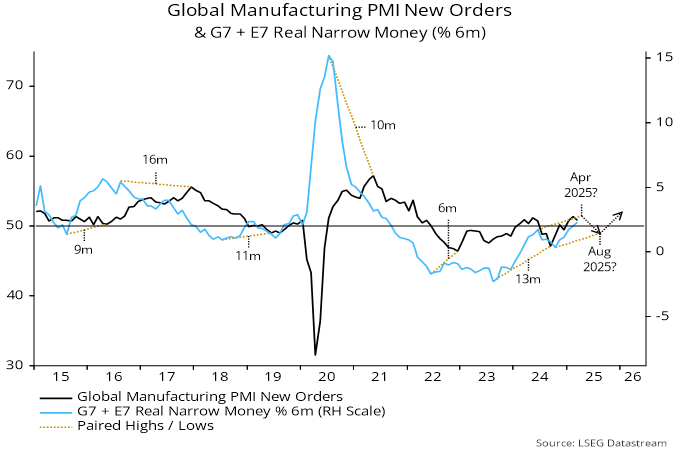
Global (i.e. G7 plus E7) six-month real narrow money momentum moved sideways in August, following a March-July fall. The previous low in real money momentum in October 2024 was reflected in a low in global manufacturing PMI new orders in May. Accordingly, the monetary slowdown since March could be mirrored by a peak and reversal in PMI new orders from around October – see chart 1.

Chart 1
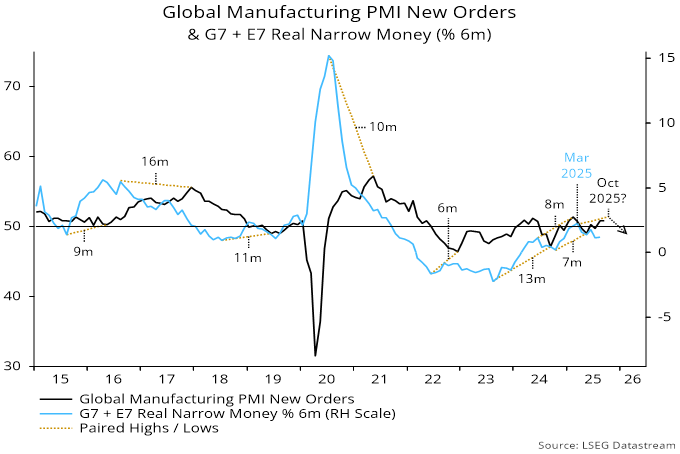
Chart 1 showing Global Manufacturing PMI New Orders & G7 + E7 Real Narrow Money (% 6m)

The fall in real money momentum has been modest but an expected economic slowdown could become more serious than others in recent years, for two reasons. First, the stockbuilding and housing cycles have entered time windows to begin downswings. Secondly, labour markets are showing signs of weakness for the first time since the pandemic recession, raising the risk of self-reinforcing negative dynamics.

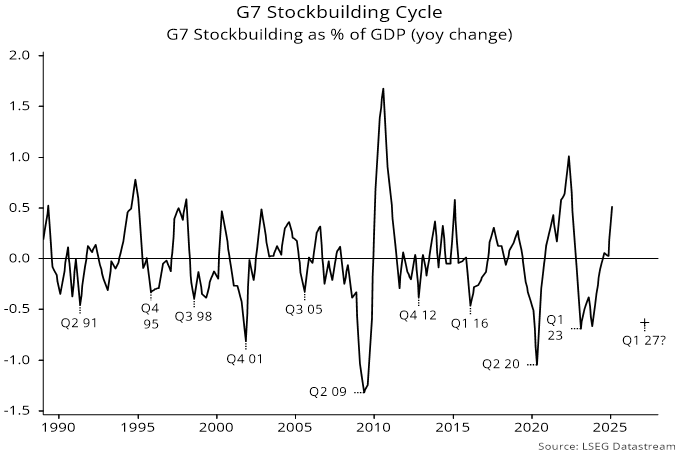
The working assumption here has been that the stockbuilding cycle will reach another low in Q1 2027, implying a four-year current cycle versus a 3.5-year historical average. Recent G7 national accounts stockbuilding data as well as an indicator based on business surveys are consistent with the cycle being at or near a peak – chart 2.

Chart 2
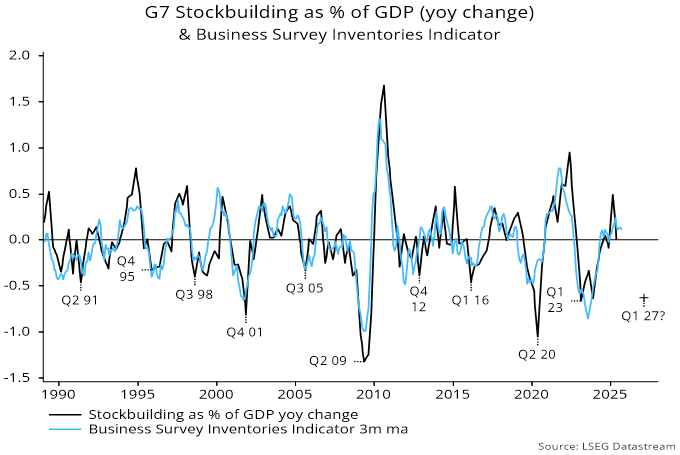
Chart 2 showing G7 Stockbuilding as % of GDP (yoy change) & Business Survey Inventories Indicator

The housing cycle bottomed in 2009 and has ranged between 15 and 25 years historically, averaging 18 years. The pandemic-related money growth surge of 2020-21 appears to have resulted in the current cycle peaking early, in 2022. G7 housing starts or permits have been range-bound since early 2023 but rising unemployment could be the trigger for a break lower.  China has been leading in the current cycle and starts are still falling – chart 3.

Chart 3
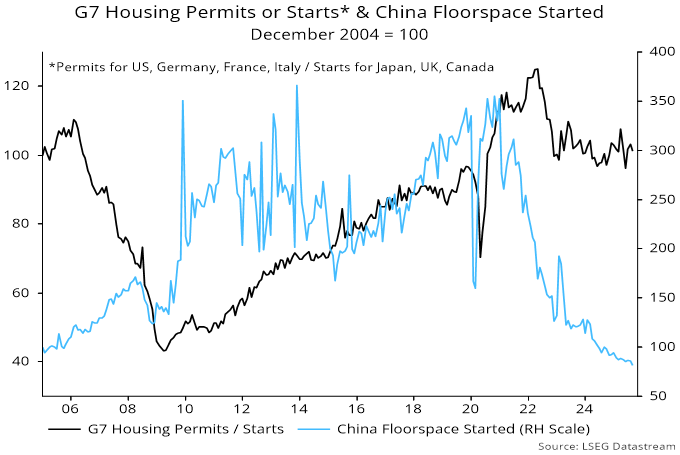
Chart 3 showing G7 Housing Permits or Starts* & China Floorspace Started December 2004 = 100 *Permits for US, Germany, France, Italy / Starts for Japan, UK, Canada

The suggestion that unemployment is on a rising trend is supported by consumer surveys, with a composite G7 indicator of negativity recently reaching a four-year high – chart 4.

Chart 4
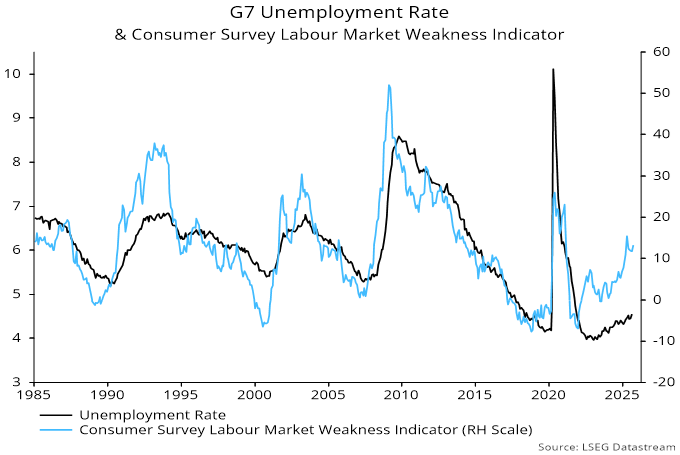
Chart 4 showing G7 Unemployment Rate & Consumer Survey Labour Market Weakness Indicator

Monetary policy easing, if sufficiently dramatic, could short-circuit negative cyclical dynamics. A dramatic move could occur conventionally if additional evidence of labour market weakness is accompanied by a downside inflation surprise, or unconventionally if the Trump administration succeeds in gaining control of the Fed. A large cut in US rates would magnify US dollar weakness, forcing other central banks to follow.

Inflation prospects are judged here to be favourable, at least through early 2027. G7 annual broad money growth remains subdued (4.3% in August versus a 2015-19 average of 4.5%), while stockbuilding cycle downswings are usually associated with weakness in commodity prices – chart 5.

Chart 5
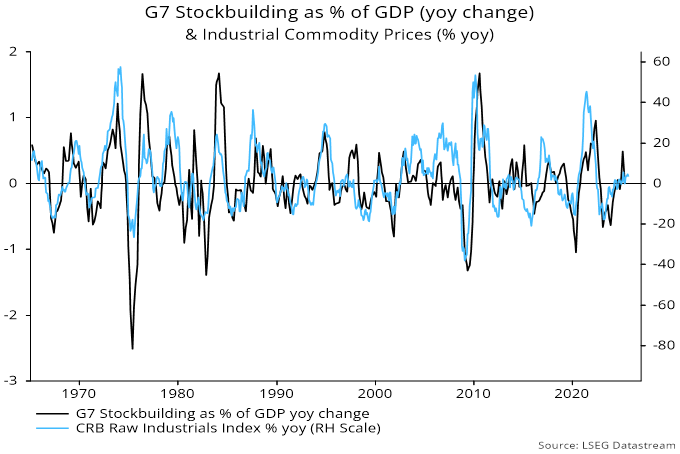
Chart 5 showing G7 Stockbuilding as % of GDP (yoy change) & Industrial Commodity Prices (% yoy)

Near-term US inflation numbers, however, will continue to reflect tariff effects. Elsewhere, central bankers focused on fighting the last war may be slow to respond to favourable surprises. As an example of hawkish bias, the ECB has gone on hold despite forecasting below-target inflation.

The alternative route to a large near-term fall in rates – a take-over of the Fed by the executive branch – still seems far-fetched, with the administration lacking scope to push through personnel changes on the necessary scale.

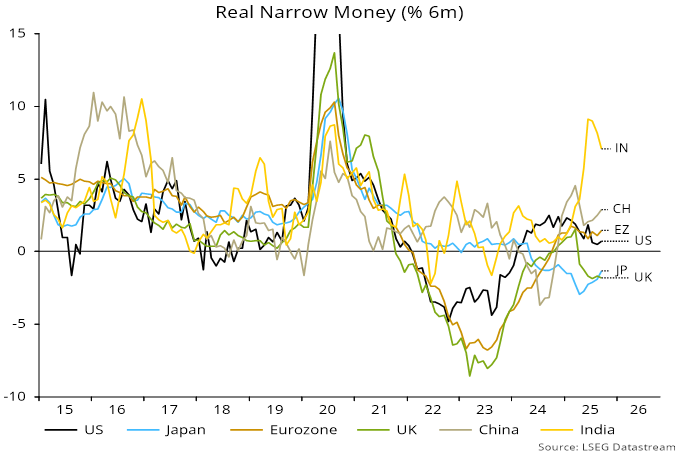
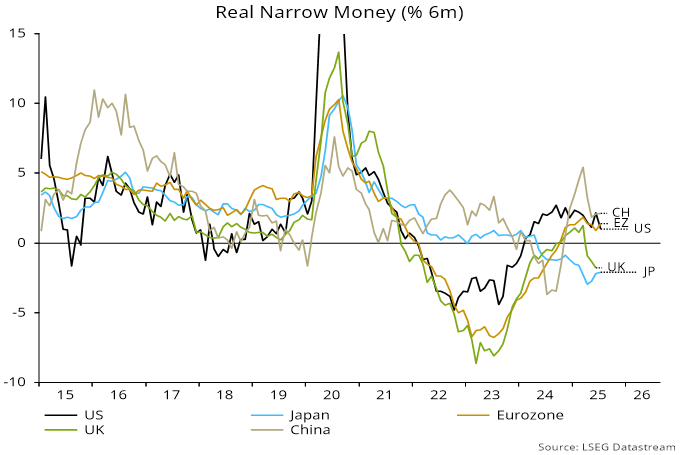
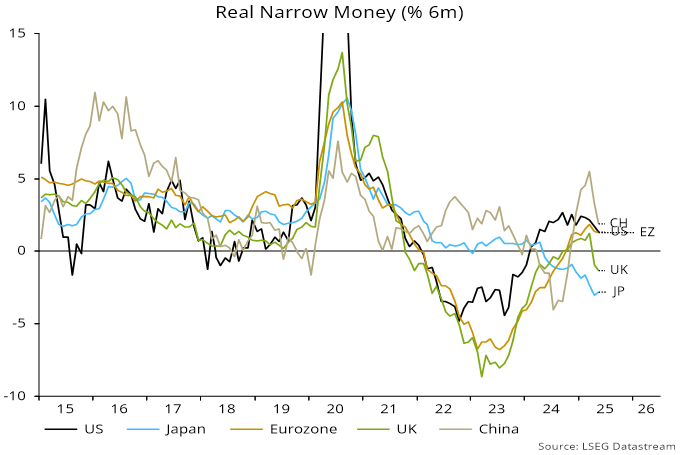
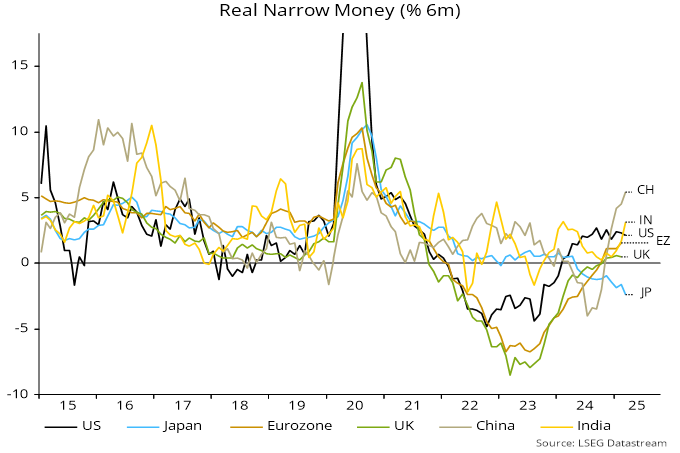
Among major economies, six-month real narrow money momentum is weakest in Japan and the UK, suggesting over-restrictive monetary policies and downside economic risk. Momentum is similar in the US and Eurozone but the US has slipped to a 17-month low, while a Eurozone recovery has stalled since Q1 – chart 6.

Chart 6
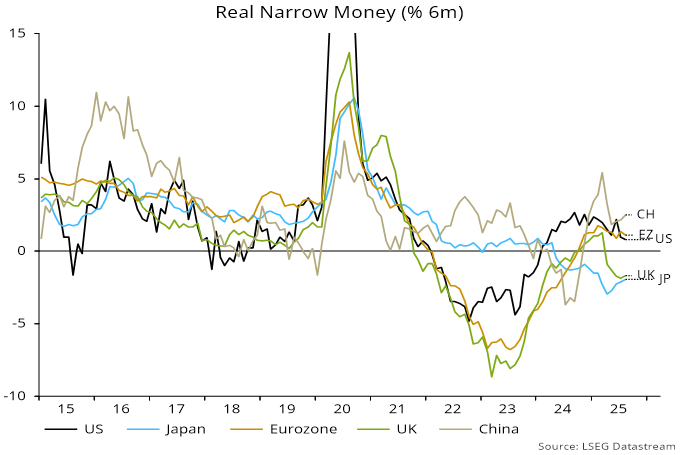
Chart 6 showing Real Narrow Money (% 6m)

The Eurozone story seems to be that higher bond yields triggered by fiscal loosening along with a stronger euro have offset ECB easing. Optimists argue that German fiscal stimulus is only now arriving but the impact could be balanced by an early stockbuilding downswing – the stockbuilding share of GDP rose by 0.7 pp in the year to Q2 and is above its long-run average.

The recent decline in global six-month real narrow money momentum has been driven by the G7 component. Chinese momentum fell back in April-May but has recovered since, giving a modestly favourable signal for economic prospects.

The assumption of a Q1 2027 trough implies that the current stockbuilding cycle has entered its final 18 months. The 18-month windows before previous lows were usually negative for risk assets and marked by credit events or “crises” – chart 7. The possibility of simultaneous housing cycle weakness, as well outsized gains in the upswing phase of the current cycle, suggests greater-than-normal downside.

Chart 7
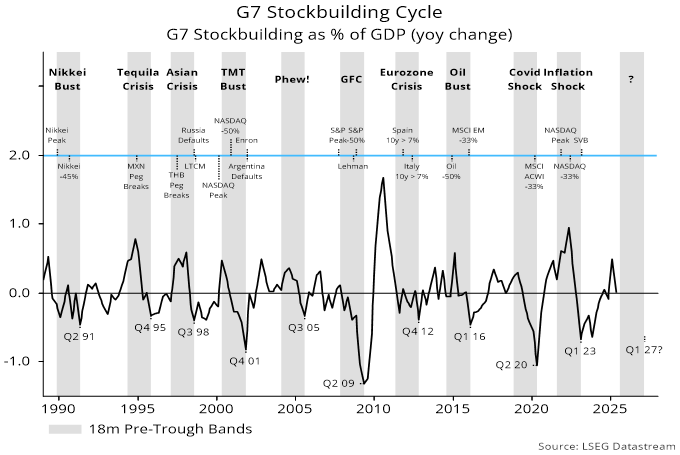
Chart 7 showing G7 Stockbuilding Cycle G7 Stockbuilding as % of GDP (yoy change)

These 18-month windows were usually associated with cyclical equity market sectors underperforming defensives, following outperformance during the upswing (unusually strong in the current cycle). Stylewise, there was a weak tendency for quality to outperform, while momentum lagged its upswing gains significantly. The recent drawdown in relative performance of the MSCI EAFE Quality index versus MSCI EAFE was exceeded in magnitude and duration only in the early 1980s – chart 8.

Chart 8
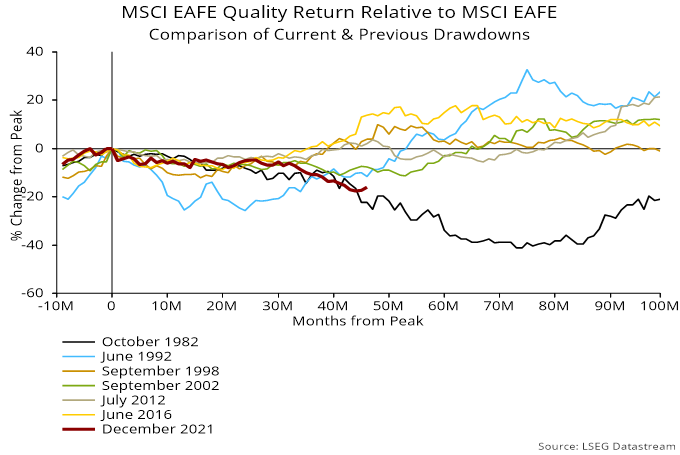
Chart 8 showing MSCI EAFE Quality Return Relative to MSCI EAFE Comparison of Current & Previous Drawdowns

Six-month growth rates of global real narrow money and industrial output have been tracking closely with a small monetary excess on the latest readings – chart 9. The strength of markets appears to reflect a rise in the financial velocity of money more than ample liquidity, suggesting reversibility in the event of a cyclical deterioration in sentiment.

Chart 9
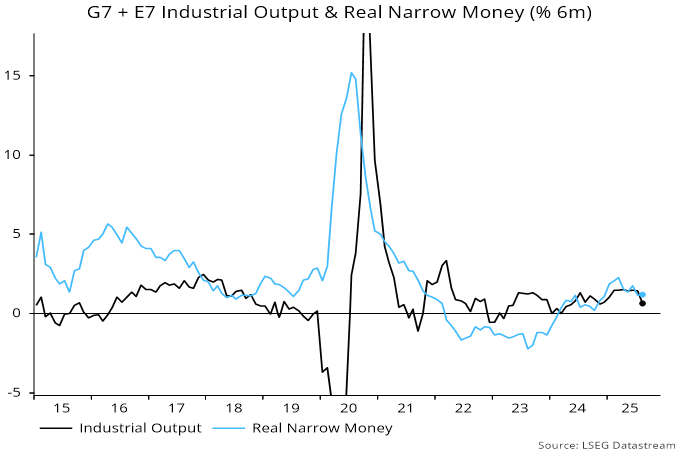
Chart 9 showing G7 + E7 Industrial Output & Real Narrow Money (% 6m)

The two monetary conditions historically favouring EM equities – E7 real money growth above the G7 level and global real money growth above industrial output expansion – are currently in place, suggesting EM outperformance in the event of a near-term further rise in markets.
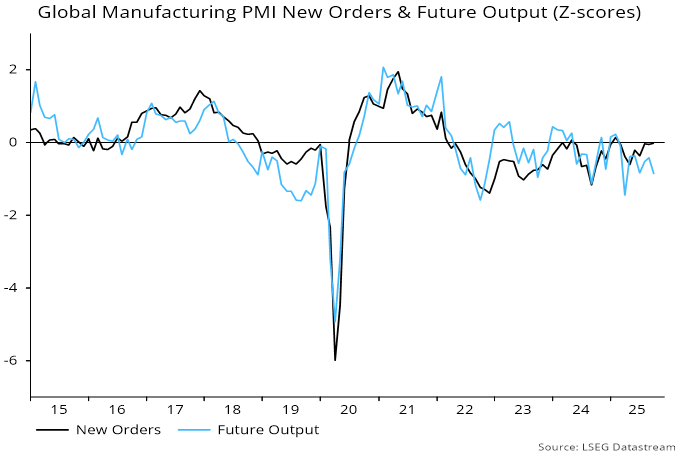
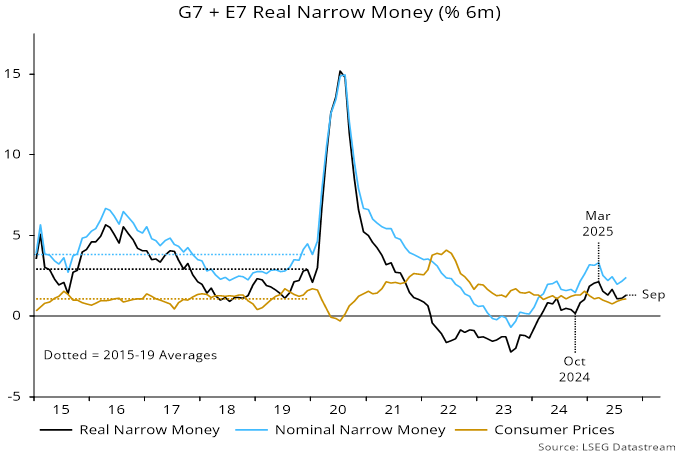
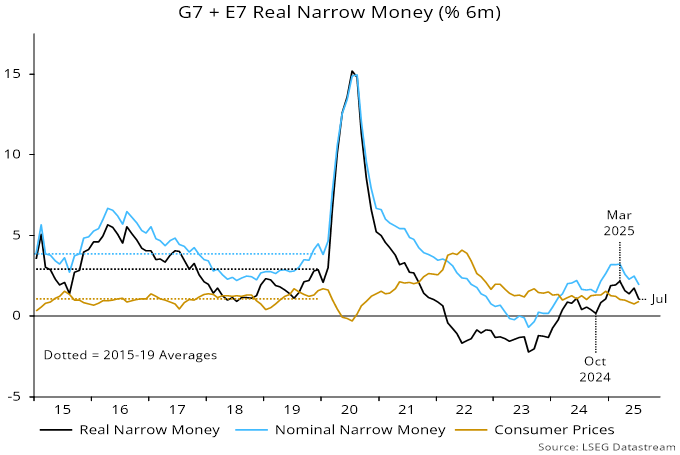
Global six-month real narrow money momentum – a key leading indicator in the forecasting approach used here – is estimated to have fallen to its lowest since November / December in July, based on monetary data for countries with a combined 88% weight.

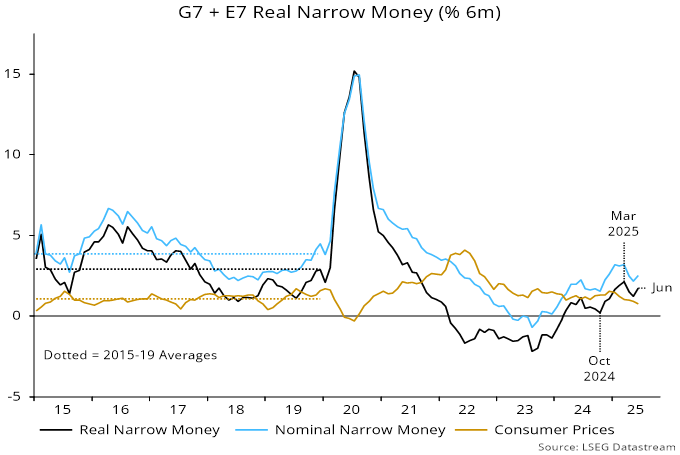
The resumption of a decline from a March peak reflected both a slowdown in nominal money growth and a small rise in six-month CPI momentum (which, however, remains slightly below its 2015-19 average) – see chart 1.

Chart 1

Chart 1 showing G7 + E7 Real Narrow Money (% 6m)

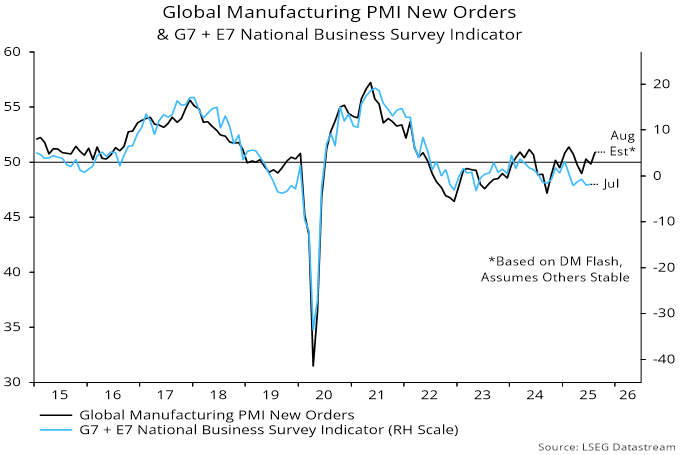
A rise in real money growth between October 2024 and March suggested that the global economy would regain momentum in H2 2025 after a weak start to the year. Tariff effects cloud interpretation but PMI results are consistent with this forecast, with August DM flash numbers reading across to a rise in global manufacturing PMI new orders to a six-month high – chart 2.

Chart 2

Chart 2 showing Global Manufacturing PMI New Orders & G7 + E7 National Business Survey Indicator

An alternative indicator calculated here using national survey data has been lagging the PMI but may also have increased in August. US regional Fed manufacturing surveys are pointing to stronger ISM results.

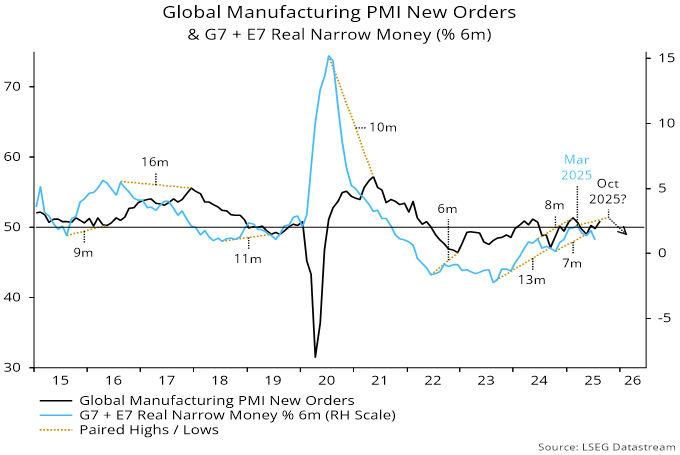
Still, the slowdown in real money momentum since March suggests that survey strength, if confirmed, will prove short-lived, with another inflection weaker before year-end – chart 3.

Chart 3

Chart 3 showing Global Manufacturing PMI New Orders & G7 + E7 Real Narrow Money (% 6m)

The July decline in global real money momentum mainly reflected a US fall to its lowest since March last year – chart 4. US money growth may have been supported in H1 by a run-down of the Treasury’s cash balance at the Fed. With the debt ceiling now raised, the balance stabilised in July and has increased in August, with financing plans targeting a further rise, i.e. Treasury cash-raising may drain money from private accounts.

Chart 4

Chart 4 showing Real Narrow Money (% 6m)

Real money momentum rose slightly in China and the Eurozone but remains below recent peaks, with Japan little changed in negative territory and UK July numbers yet to be released.

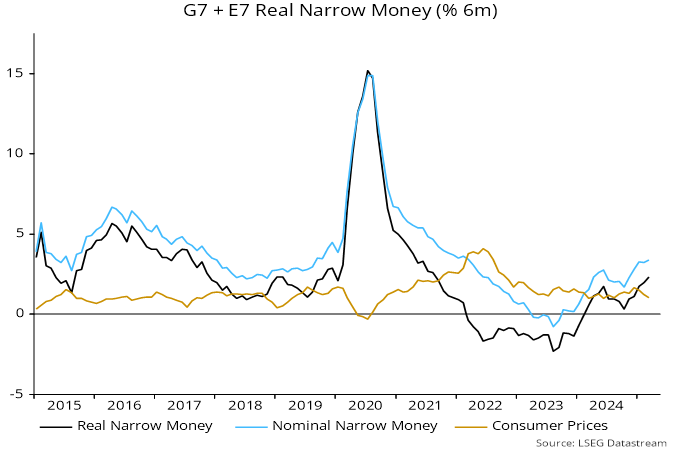
Global (i.e. G7 plus E7) six-month real narrow money momentum – a key indicator in the approach followed here – recovered in June but remains below a multi-year high reached in March.

The June rise reflected a small rebound in nominal money growth combined with a further fall in six-month consumer price momentum, to its lowest since 2020 – see chart 1.

Chart 1

Chart 1 showing G7 + E7 Real Narrow Money (% 6m)

CPI momentum is now below its 2015-19 average, vindicating the “monetarist” forecast that global inflation would fully reverse its 2021-22 spike once the ridiculous – but thankfully temporary – policy-driven money growth surge of 2020-21 had passed through the system.

The rise in six-month real narrow money momentum into March suggested that global economic growth would strengthen into late 2025, following a weak start to the year related to a monetary slowdown into October 2024.

Front-running of US tariffs, however, may have supported growth during H1, with H2 payback liable to dampen the expected pick-up. The March peak in real money momentum, meanwhile, suggests economic deceleration from late 2025.

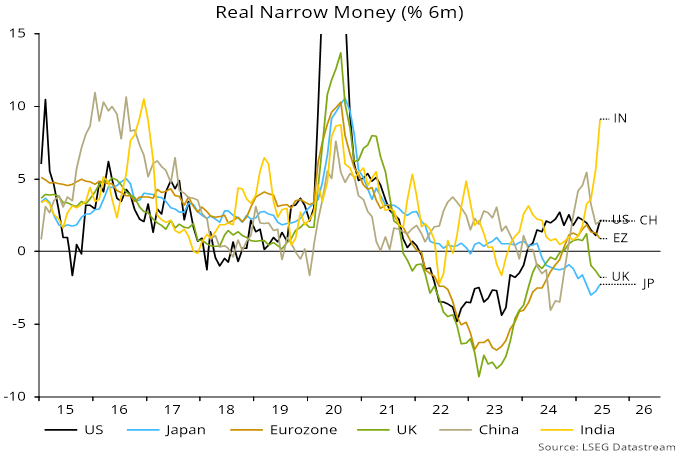
The June rise in global real money momentum was driven by a further pick-up in India following a dovish RBI shift coupled with a surprise rebound in the US. By contrast, Eurozone momentum slowed for a third month while UK contraction intensified, almost catching down to Japan – chart 2.

Chart 2

Chart 2 showing Real Narrow Money (% 6m)

Interpretation of recent US money numbers is clouded by disruption to fiscal financing from the delay in lifting the debt ceiling. An associated run-down of the Treasury’s cash balance at the Fed may have supported H1 money growth, suggesting a drag as the balance is restored to its prior level.

(“Austrian” measures of the money stock include government deposits, on which basis US six-month narrow money momentum was negative in June. Such an approach is not endorsed here, for the obvious reason that – unlike for private sector agents – government money holdings are unrelated to future spending.)

Still, recent sideways movement of US six-month real narrow money momentum versus a slowdown in the Eurozone and outright weakness in Japan / the UK suggests improving US relative economic prospects while casting doubt on forecasts of further equity market underperformance.

The latest signal from monetary data is that global economic momentum will inflect weaker from around late 2025. Cyclical considerations suggest that this will mark the beginning of a sustained downswing into 2027.

Lagged money trends argue that underlying inflation will fall further and remain low through 2026. Nevertheless, central banks may be slow to offset economic weakness with additional policy stimulus because of concerns about tariff effects and fiscal indiscipline, as well as scarring from the 2021-22 inflation surge.

The suggestion is that equity markets face rising headwinds, with another sustained bull phase unlikely before 2027, when key cycles are scheduled to bottom. An appropriate strategy may be to underweight markets where monetary trends are relatively weak – Japan and the UK currently – while overweighting sectors with lower earnings sensitivity to expected cyclical weakness.

Elaborating on the above, global six-month real narrow money momentum – a key leading indicator in the approach followed here – reached a local high in March, falling sharply in April / May – see chart 1.

Chart 1

Chart 1 showing G7 + E7 Real Narrow Money (% 6m)

The rise from October 2024 into March suggested that the global economy would regain some momentum from around mid-2025, based on the recent average lag. A June rise in manufacturing PMI new orders could mark the start of such a shift, although results from national (as opposed to S&P Global) surveys were mixed. Still, April / May monetary weakness argues that any near-term recovery will be short-lived, with economic indicators likely to deteriorate again from around late 2025 – chart 2.

Chart 2

Chart 2 showing Global Manufacturing PMI New Orders & G7 + E7 Real Narrow Money (% 6m)

The latest fall in real money growth has been broadly based across countries, reinforcing the negative signal. Momentum is notably weak in Japan and the UK, arguing for economic underperformance. Eurozone growth has held up but hasn’t yet crossed above the US, cautioning against “europhoria” – chart 3.

Chart 3

Chart 3 showing Real Narrow Money (% 6m)

From a cyclical perspective, the stockbuilding cycle is in the window for a peak in terms of both time since the last low (Q1 2023) and the contribution of inventory accumulation to annual G7 GDP growth – chart 4. The latter has been boosted by front-loading to avoid tariffs, which appears to have continued in Q2.

Chart 4

Chart 4 showing G7 Stockbuilding Cycle G7 Stockbuilding as % of GDP (yoy change)

The cycle should turn down by early 2026 at the latest and the baseline assumption here remains for a low in H1 2027, implying that the current cycle will be slightly longer than the 3.5 year historical average, balancing a shorter-than-average prior cycle. Stockbuilding cycle downswings are usually associated with significant slowdowns (or worse) in global economic growth and underperformance of risk assets.

A key question is whether the coming downswing will be accompanied by weakness in the housing and / or business investment cycles, in which case a 2026-27 recession becomes the baseline. A housing downturn is more likely, given the maturity of the current cycle (16 years versus an 18-year average) and downward pressure from elevated longer-term interest rates. The business investment cycle is less advanced (year five versus a nine-year average), with corporate financial balances still healthy and AI deployment providing a tailwind.

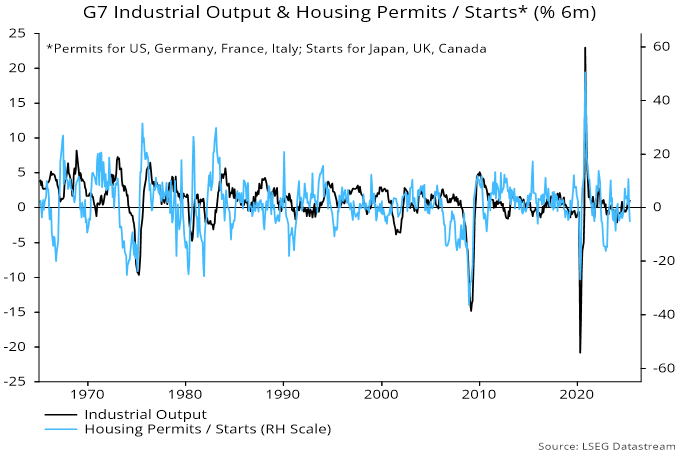
Close attention, therefore, should be paid to housing indicators. The six-month rate of change of G7 housing permits / starts recently turned negative, suggesting a darkening outlook – chart 5.

Chart 5

Chart 5 showing G7 Industrial Output & Housing Permits / Starts* (% 6m) *Permits for US, Germany, France, Italy; Starts for Japan, UK, Canada

Inflation follows money growth with a roughly two-year lag, according to the simplistic monetary rule, which outperformed every other forecasting approach in 2021-22. Annual broad money growth bottomed in mid-2023 in the G7 and a year later globally, with limited subsequent recoveries. The suggestion is that underlying inflation will fall further and remain low through 2026.

On the analysis here, therefore, central banks could limit economic weakness by delivering timely additional policy stimulus while still meeting, or even undershooting, their inflation objectives. The US Fed, however, may continue to drag its feet amid uncertainty about near-term tariff effects and counterproductive political pressure, with a knock-on effect on the pace of easing elsewhere.

Both global “excess” money flow indicators used here to assess equity market prospects are currently negative, having been mixed three months ago. Specifically, global six-month real narrow money momentum has crossed back below industrial output momentum, while 12-month real money momentum remains beneath its long-run average – chart 6.

Chart 6

Chart 6 showing MSCI World Cumulative Return vs USD Cash & Global “Excess” Money Measures

The indicators were misleadingly negative in 2023-24 because of a stock overhang resulting from the 2020-21 money growth surge. The assessment here is that there is no longer any excess relative to current levels of nominal GDP and asset prices.

Global manufacturing PMI new orders – a timely coincident indicator of industrial momentum – fell for a third month in May. The decline from a February peak is consistent with a slowdown in global six-month real narrow money momentum between June and October 2024 – see chart 1.

Chart 1

Chart 1 showing Global Manufacturing PMI New Orders & G7 + E7 Real Narrow Money (% 6m)

The PMI fall started slightly earlier than had been expected here. The eight-month interval between the June peak in real money momentum and the February PMI peak compares with an average lag of 11 months at prior turning points since 2015.

Monetary considerations alone would suggest that the PMI will decline further into mid-year before recovering to another local high around end-2025 – the dotted arrows in the chart show a possible path.

The US trade policy shock, however, is likely to impart a negative skew to this profile, as recent demand front-loading reverses and spending decisions remain on hold until tariff uncertainty abates.

Accordingly, the current PMI decline could extend further than indicated with only a minor H2 recovery. Weak April money numbers, moreover, suggest darkening prospects for end-2025 – see previous post.

Global (i.e. G7 plus E7) six-month real narrow money momentum – a key leading indicator in the approach followed here – fell sharply in April, to its lowest level since December. The relapse douses hope generated by a pick-up into March, which suggested a bounce-back in the global economy later in 2025, assuming no further negative “shocks”.

The April fall was driven by a slowdown in nominal money growth to its weakest since November. Six-month consumer price momentum eased slightly further to match its 2024 low (2.0% annualised) – see chart 1.

Chart 1

Chart 1 showing G7 + E7 Real Narrow Money (% 6m)

To recap, a fall in real narrow money momentum between June and October 2024 was expected here to be reflected in a global economic slowdown in Q2 / Q3 2025, which the US trade policy shock will amplify.

Subsequent monetary reacceleration into March held out the hope of an economic recovery in late 2025, by which time negative tariff effects could be starting to fade.

The April money growth fall, however, suggests that a negative feedback loop is developing, with reduced confidence due to US policies resulting in increased risk aversion and a tightening of monetary conditions, despite most central banks remaining on an easing path.

The April decline reflected falls across major economies, reinforcing the negative signal – chart 2.

Chart 2

Chart 2 showing Real Narrow Money (% 6m)

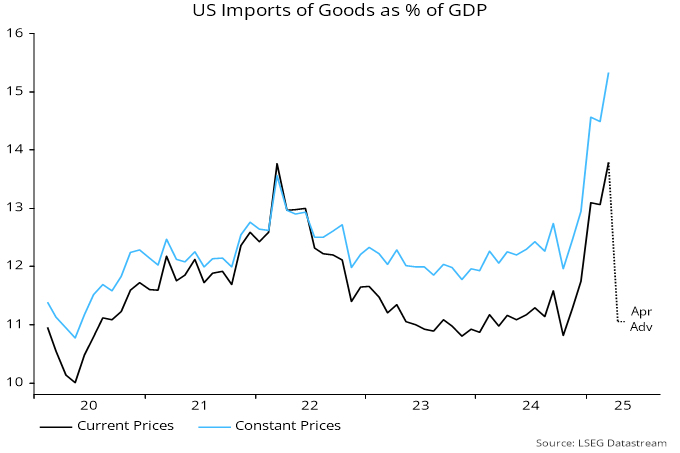
Economic momentum has been supported by demand front-loading but payback is arriving.

A surge in US goods imports boosted GDP in the rest of the world by 0.25-0.5% in Q1 but April advance numbers suggest a full reversal – chart 3.

Chart 3

Chart 3 showing US Imports of Goods as % of GDP

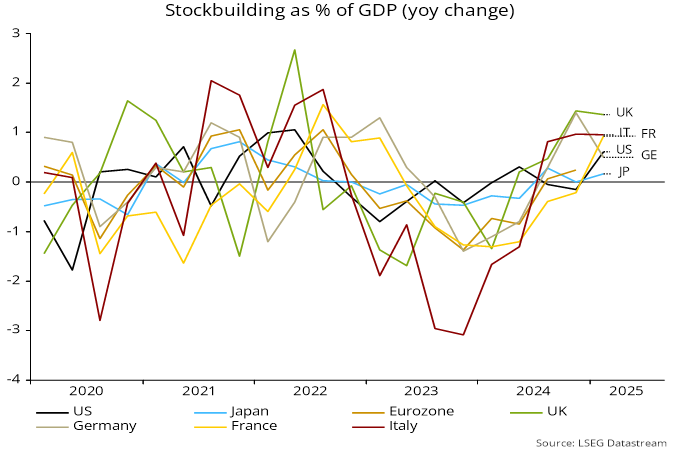
Inventory accumulation isn’t just a US story. Stockbuilding as a percentage of GDP rose similarly or by more in major European economies in the year to Q1 – chart 4.

Chart 4

Chart 4 showing Stockbuilding as % of GDP (yoy change)

Economic growth depends on the change in stockbuilding, so even a stabilisation at its recent pace would suggest a significant loss of output momentum.

Three indicators that signalled the 2021-22 global inflation spike and reversal continue to suggest a favourable outlook.

G7 annual broad money growth led the rise and fall in annual consumer price inflation by about two years, consistent with the rule of thumb suggested by Friedman and Schwarz.

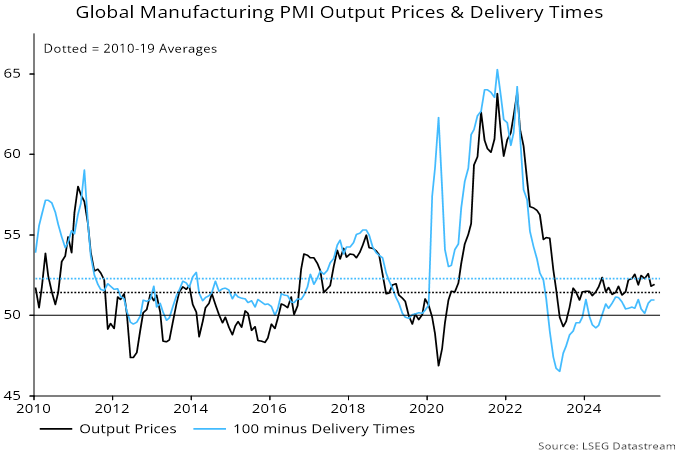
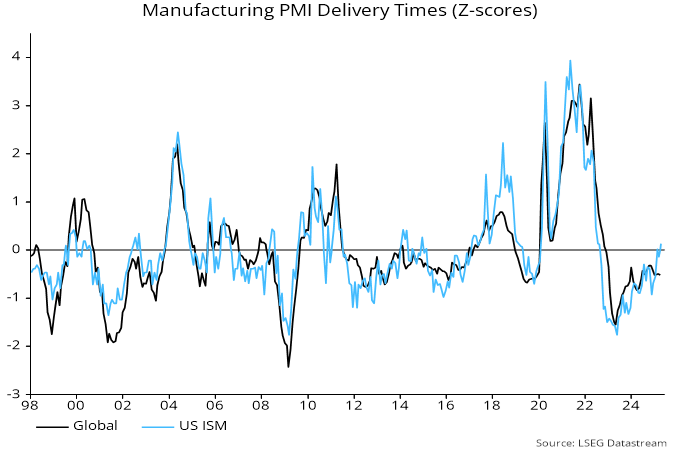
The global manufacturing PMI delivery times index – a measure of supply constraints / shortages – led by about a year.

The annual rate of change of commodity prices – as measured by the energy-heavy S&P GSCI – led by nine months.

Chart 1 overlays the three series, with respective leads applied, on G7 annual inflation.

Chart 1

Chart 1 showing G7 Consumer Prices (% yoy) & Three Leading Indicators (Broad Money, PMI Delivery Times & Commodity Prices)

The latest readings of all three are below their averages over 2015-19. Those averages were associated with average headline and core inflation of below 2% (i.e. allowing for the stated lead times).

Directionally, the suggested influence of the three indicators over their respective forecast horizons is down for commodity prices, sideways for delivery times and up for broad money growth. The latter recovery, however, is from extreme weakness.

In combination, the level and directional signals suggest that inflation will move down into early 2026, with limited recovery over the following year.

Tariffs may affect the profile but are unlikely to change the story. A mechanical boost to US prices in Q2 / Q3 will drop out of the annual inflation rate a year later. The effect may be to push out the inflation low from early 2026 to later in the year.

Tariffs could have a larger and more sustained impact by snarling up supply chains and disrupting production, resulting in delivery delays and shortages.

The global manufacturing PMI delivery times index currently remains below its long-run historical average, as well as its average over 2015-19 – chart 2.

Chart 2

Chart 2 showing Manufacturing PMI Delivery Times (Z-scores)

Delivery times have risen in the US but the ISM manufacturing supplier deliveries index is only back to its average.

Reduced exports to the US will increase excess supply in the rest of the world, depressing delivery times and pricing power, balancing upward pressure in the US.

Any tariff boost to inflation will persist over the medium term only if associated with a rise in broad money growth. This could occur if central banks ease policies excessively, because of actual or feared economic weakness, or perhaps to limit upward pressure on currencies. Alternatively, inflation worries could deter non-bank purchases of government debt, resulting in banks being required – voluntarily or otherwise – to fund a larger proportion of (wide) fiscal deficits, creating money in the process.

Such scenarios are plausible but the inflationary effects of any broad money acceleration would be unlikely to appear before 2027.

Global monetary trends suggest demand support for economic activity in late 2025 / early 2026. Such support could offset the negative impact of the US trade policy shock. Growth could bounce back solidly should tariffs be scaled back.

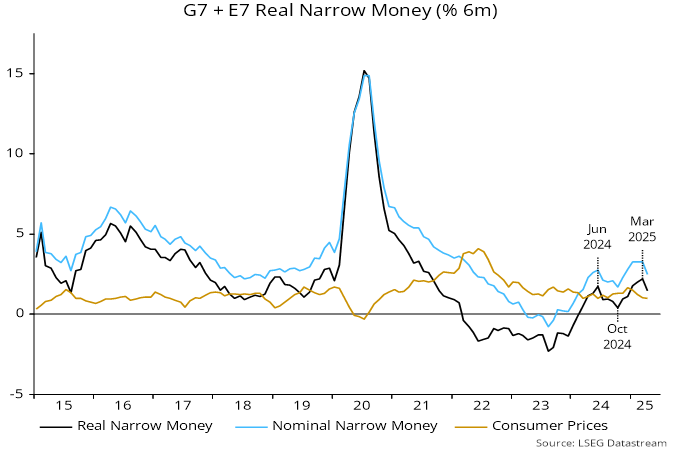
Global (i.e. G7 plus E7) six-month real narrow money momentum is estimated to have risen further in March, reaching its highest level since August 2021, based on monetary data for countries accounting for three-quarters of the aggregate. Nominal money growth appears to have ticked up in March while six-month consumer price momentum slowed – see chart 1.

Chart 1

Chart 1 showing G7 + E7 Real Narrow Money (% 6m)

A fall in global real money momentum between June and October 2024 was expected here to be reflected in an economic slowdown in spring / summer 2025 – chart 2. The US policy shock, therefore, is occurring at an inopportune time, threatening a much more serious downturn.

Chart 2

Chart 2 showing Global Manufacturing PMI New Orders & G7 + E7 Real Narrow Money (% 6m)

Real money reacceleration since late 2024, however, suggests a short, sharp hit to economic activity rather than a sustained recession. A recovery in domestic demand could outweigh net export weakness by late 2025, particularly if the tariff regime that eventually emerges is less onerous than currently feared, or at least allows businesses to plan with less uncertainty.

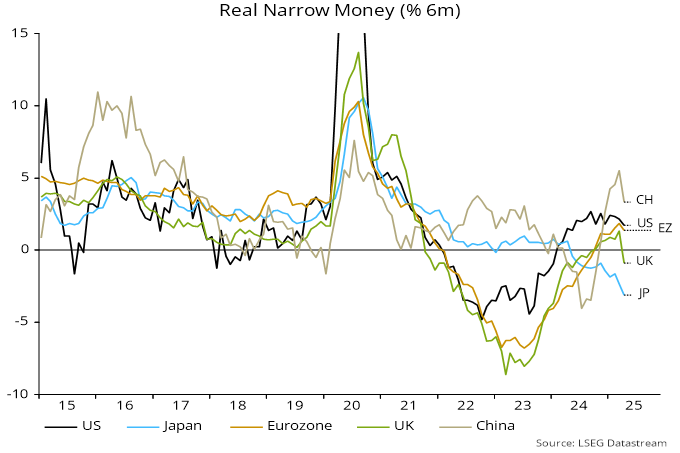
The estimated March rise in global six-month real narrow money momentum was driven by China and India, with the US little changed and Japanese weakness becoming more extreme – chart 3. (Eurozone and UK March numbers will be released next week.)

Chart 3

Chart 3 showing Real Narrow Money (% 6m)

Could the monetary pick-up reverse? US broad – and possibly narrow – money growth has been supported by an enforced run-down of the Treasury’s cash balance at the Fed, which will be rebuilt if / when agreement on lifting the debt ceiling is reached.

Tariffs will have a temporary impact on CPI numbers, squeezing real money momentum. Still, effects should be small outside the US and offset by recent weakness in energy prices.

The trade shock, meanwhile, is resulting in faster monetary policy easing outside the US, reflecting both economic fears and US dollar weakness.

Prospective influences, therefore, are mixed and a further rise in global real money momentum appears as likely as a relapse.

A cyclical forecasting framework implies that current economic events will contain echoes of developments at the same stage of previous cycles.

Similarities should be more pronounced at around 18- and particularly 54-year frequencies, corresponding to average lengths of the housing and Kondratyev inflation cycles respectively.

A previous post noted the similarity of Fed tightening episodes in 1967-69 and 2022-23. The Fed funds rate (month average) rose from peak to trough by 540 bp and 530 bp respectively, topping in August 1969 and August 2023, exactly 54 years later – see chart 1.

Chart 1

Current vs previous Kondratyev Cycle. US Fed funds rate.

The US economy entered a recession at the end of 1969. GDP was recovering by Q2 1970 but suffered a second hit from a prolonged auto strike.

The Fed cut rates much more aggressively than recently but reversed course temporarily from early 1971 as the economy rebounded strongly and inflation remained high. The current Fed pause has occurred at the same cycle time.

Inflation fell sharply into 1972, mirroring a big slowdown in broad money growth two years earlier. The Fed resumed easing later in 1971, with the funds rate reaching an ultimate low in February 1972.

A possible scenario is that President Trump’s tariff shock triggers the recession “missing” from the current cycle, causing the Fed to ease aggressively later in 2025, with rates and inflation falling to lows in 2026 corresponding to those reached in 1972.

US disruption to global economic relations is itself is strongly reminiscent of policy developments 54 years ago. In August 1971, President Nixon shocked trading partners by suspending convertibility of the dollar into gold within the Bretton Woods system while imposing a 10% tariff on imports.

The backdrop was a US balance of payments deficit and an accelerating loss of gold from US reserves. According to a Federal Reserve history of the period, President Nixon blamed the deficit “on unfair trading practices and other countries’ unwillingness to share the military burden of the Cold War”. Sound familiar?

The “Nixon shock” triggered a crisis, with global policy-makers fearing that “international monetary relations would collapse amid the uncertainty about exchange rates, the imminent spread of protectionism, and the looming prospects of a serious recession”.

The crisis was resolved, at least temporarily, by the December 1971 Smithsonian Agreement, involving trading partners agreeing to revalue their currencies against the dollar in return for the removal of tariffs. “The net effect was roughly a 10.7 percent average devaluation of the dollar against the other key currencies … Foreign nations also agreed to comply with Nixon’s request to lessen existing trade restrictions and to assume a greater share of the military burden.”

Could a revaluation of currencies against the dollar be part of a “deal” to end the current crisis, once President Trump comes to recognise that the economic costs of his high tariff policy greatly exceed any benefits?

The Nixon shock occurred with the real trade-weighted value of the dollar at a similar premium to its long-run average to today. The shock accelerated a secular decline into and beyond the following housing cycle trough – chart 2.

Chart 2

Real US dollar index vs advanced foreign economies. Based on consumer prices, January 2006 = 100, Source: Federal Reserve / BIS.

Global money growth has picked up since late 2024 but remains subdued, while the stock of money is no longer in excess relative to nominal economic activity and asset prices. The monetary backdrop, therefore, appears insufficiently supportive to offset economic / market damage from US-led tariff hikes.

Prospective tariff effects, meanwhile, require a revision to the previous forecast here of a downside global inflation surprise in 2025 related to extreme monetary weakness in 2023. A price level boost this year is unlikely to yield second-round effects given disinflationary monetary conditions, so a near-term lift to annual inflation should reverse in 2026. The effect may be to extend the lag between the money growth low of 2023 and the associated inflation low from two to three years.

The elimination of a surplus stock of money has been mirrored by erosion of excess labour demand, with job openings / vacancy rates mostly now around or below pre-pandemic levels. Economic weakness, therefore, may be reflected in a rise in unemployment that eventually dominates central bank concerns about inflationary tariff effects, suggesting that current policy caution will give way to renewed easing later in 2025.

Global six-month real narrow money momentum – the key monetary leading indicator followed here – fell between June and October 2024 but has since rebounded, reaching a post-pandemic high in February. (The timing of the mid-2024 dip has changed slightly from previous posts, mainly reflecting annual revisions to seasonal adjustment factors for US monetary data.) Real money momentum, however, remains below its long-run average – see chart 1.

Chart 1

Chart 1 showing Global Manufacturing PMI New Orders & G7 + E7 Real Narrow Money (% 6m) Global six-month real narrow money momentum – the key monetary leading indicator followed here – fell between June and October 2024 but has since rebounded, reaching a post-pandemic high in February. (The timing of the mid-2024 dip has changed slightly from previous posts, mainly reflecting annual revisions to seasonal adjustment factors for US monetary data.) Real money momentum, however, remains below its long-run average – see chart 1.

The lead time between real money momentum and manufacturing PMI new orders has averaged 10 months at the four most recent turning points. Based on this average, the 2024 real money slowdown and subsequent reacceleration suggest a PMI relapse in Q2 / Q3 followed by renewed strength in late 2025 – chart 2.

Chart 2

Chart 2 showing Global Manufacturing PMI New Orders & G7 + E7 Real Narrow Money (% 6m) The lead time between real money momentum and manufacturing PMI new orders has averaged 10 months at the four most recent turning points. Based on this average, the 2024 real money slowdown and subsequent reacceleration suggest a PMI relapse in Q2 / Q3 followed by renewed strength in late 2025 – chart 2.

Tariff effects – including payback for a front-loading of trade flows – are likely to magnify mid-year economic weakness and could push out or even abort a subsequent recovery: delayed central bank easing, a confidence hit to business / consumer credit demand and a near-term inflation lift could reverse the recent pick-up in real money momentum.

Previous posts, meanwhile, argued that stocks of (broad) money in the US, Japan and Eurozone are no longer higher than warranted by prevailing levels of nominal economic activity and asset prices, implying an absence of a monetary “cushion” against negative shocks. Excess money appears to be substantial in China but could remain frozen as US trade aggression and domestic policy caution sustain weak business / consumer confidence.

Chart 3 shows six-month real narrow money momentum in major economies. Chinese strength is a stand-out but may partly reflect payback for earlier weakness – momentum needs to remain solid to warrant continued (relative) optimism. A Eurozone recovery still leaves momentum lagging the US (where revised numbers show less of a recent slowdown), with the UK further behind. Japanese weakness is alarming, suggesting significant downside economic / inflation risk and consistent with recent lacklustre equity market performance.

Chart 3

Chart 3 showing Real Narrow Money (% 6m)

European economic optimism has been boosted by a relaxation of German fiscal rules and a wider drive to increase defence spending. This is significant for medium-term prospects but has limited relevance for the near-term economic outlook, which hinges on whether an uplift from monetary easing will prove sufficient to offset trade war damage.

The two flow indicators of global “excess” money followed here are giving a mixed message: six-month growth of real narrow money has crossed above that of industrial output (positive) but 12-month growth remains below a long-term moving average (negative). This combination was associated with global equities slightly underperforming US dollar cash on average historically.

From a cyclical perspective, a key issue is whether the US tariff war shock brings forward peaks and downswings in the stockbuilding and business investment cycles, which are scheduled to reach lows in 2026-27 and 2027 or later respectively. The previous baseline here was that upswings in the two cycles would extend into 2026, a scenario supported by the current monetary signal of a rebound in economic momentum in late 2025.

The next downswings in the two cycles are likely to coincide with a move of the 18-year housing cycle into another low. Triple downswings are usually associated with severe recessions and financial crises. Such a prospect is probably still two years or more away but the US policy shock may have closed off the possibility of a final boom leg to current upswings before a subsequent crash.

Table 1 updates a comparison of movements in various financial assets so far in the current stockbuilding upswing (which started in Q1 2023) with averages at the same stage of the previous eight cycles, along with changes over the remainder of those cycles. Three months ago, US equities, cyclical sectors, the US dollar and precious metals were performing much more strongly than average, suggesting downside risk. By contrast, EAFE / EM equities, small caps and industrial commodities appeared to have catch-up potential.

Table 1

Table 1 showing Stockbuilding Cycle & Markets Table 1 updates a comparison of movements in various financial assets so far in the current stockbuilding upswing (which started in Q1 2023) with averages at the same stage of the previous eight cycles, along with changes over the remainder of those cycles. Three months ago, US equities, cyclical sectors, the US dollar and precious metals were performing much more strongly than average, suggesting downside risk. By contrast, EAFE / EM equities, small caps and industrial commodities appeared to have catch-up potential.

Q1 moves corrected some of these anomalies, with the US market falling back, Chinese / European equities performing strongly, US cyclical sectors lagging, the dollar falling and industrial commodity prices recovering. Precious metals, however, became even more extended relative to history, while small cap performance has yet to pick up.

The updated table suggests potential for further strength in EM and to a lesser extent EAFE equities, along with industrial commodities. Cyclical sector underperformance and dollar weakness could extend, while gold / silver appear at high risk of a correction. The larger message, however, is that, even assuming a delayed peak, the stockbuilding cycle has entered the mid to late stage that has been unfavourable for risk assets historically.

The suggestion of EM outperformance is supported by monetary considerations. Six-month real money momentum is stronger in the E7 large emerging economies than in the G7, while – as noted earlier – global real money is outpacing industrial output. EM equities beat DM on average historically when these two conditions were met, underperforming in other regimes – chart 4.

Chart 4

Chart 4 showing MSCI EM Cumulative Return vs MSCI World & "Excess" Money Measures