
From Lego towers to managing billions, meet Crestpoint’s founder, CEO and President, Kevin Leon.
From Lego towers to managing billions, meet Crestpoint’s founder, CEO and President, Kevin Leon.

We at CC&L Investment Management believe that if we can successfully tackle the key issues contributing to the leadership gender imbalance, we will substantially broaden the talent pool from which great leaders emerge and create better business outcomes.
This belief led to the founding of our Women in Leadership (WiL) initiative in 2021, which focuses on expanding leadership talent by identifying and addressing issues that have contributed to gender gaps within our organization, industry and society at large.
The work of our collective initiative has resulted in recommendations for new strategic priorities that directly target issues uncovered through discussions and research. An important – and unexpected – discovery has been that the solutions identified to break down the leadership gender imbalance also solve issues that extend beyond gender. In other words, while our focus began with women, the outcomes of our recommendations benefit everyone.
What follows is a high-level summary of WiL’s findings and proposed solutions; however, if you’re interested in learning more about our work, we would love to connect. Please contact us through this link.
Collaborating to unleash potential
Led by a committee with engagement from the majority of women in our organization, WiL’s primary objectives are:
Underpinning our initiative is a considerable volume of academic, media and industry research on workplace gender (in)equality. In aggregate, these findings overwhelmingly point to a systemic and persistent theme that spans almost every industry: the more senior, technical and higher-profile the jobs, the smaller the proportion of women in these roles.
We recognize that many drivers of gender inequality are outside our organization’s control, but also that our interconnectedness as industry players and members of society has tangible implications for CC&L’s ability to effect change.
Our approach in action
When examining this multi-dimensional problem, we took a bottom-up approach as to why women weren’t reaching their full potential at work. For instance, we conducted extensive interviews internally and externally as well as brainstorming sessions and in-depth research. Through this process, we identified key issues facing women in our workplace and distilled these further to determine their underlying root causes. From there, we crafted solutions to directly address the most important root causes. This involved breaking down the WiL initiative into four key areas:
A brighter future for all
We adopted a gender-neutral approach in designing our solutions, which not only promotes inclusivity and diversity but also enhances the overall quality of our work environment. While the task of implementing the more than 20 solutions (outlined in our full report) may seem ambitious, we believe that by breaking it down into smaller, actionable steps, we can effectively prioritize and execute our recommendations over a multi-year period, ensuring we achieve our objectives. We expect that the WiL initiative will continue to grow and evolve over time as needs and expectations change through the implementation process. This will likely result in periodic adjustments to the longer-term implementation roadmap.
By coming together to reinforce a culture of fairness, open dialogue and opportunities, we create conditions for success. With this in mind, we are hopeful that the positive impacts of our WiL initiative will ripple across our organization and into the communities where we live and do business – leading to better leadership, stronger teams and a brighter future for all.


During times of volatility and uncertainty, quality investing can be a common buzzword among investment managers and the media alike. But what is it exactly? This commentary discusses what quality investing means and how Global Alpha incorporates its quality bias into its portfolios.
Novice investors often confuse defensive characteristics for quality, as the quality factor falls under the defensive category. However, defensive stocks are defined by their non-cyclicality, which means their financial performance isn’t significantly affected by the state of the economy. These stocks, such as household products, utilities, food suppliers and discount retailers, tend to outperform cyclicals during recessions and also on an absolute basis.
In contrast, quality investing is unrelated to market cycles or sectors. Instead, it’s defined by certain fundamental characteristics that distinguish a company from its peers. These include factors that give a business a more durable and sustainable competitive advantage, as well as profit and cash flow stability. Key variables that define the quality factor include:
Quality is a well-documented source of alpha. Eugene Fama and Kenneth French, who won the 2013 Nobel prize in Economics for their three-factor model (size, value, market risk) have updated their model to include two factors related to quality: profitability and asset growth. This is backed up by other research that has also shown how profitability and stability are as useful as size, value and market risk at explaining returns.
So why don’t all managers have a quality bias? Although many studies illustrate that quality tends to outperform over long periods, there will be times when it does poorly relative to other factors. Most notably, quality companies tend to underperform in momentum-based environments wherein investors disregard fundamentals and valuation and stock winners keep on winning. The last decade has seen many momentum-driven cycles, including the COVID-19 rebound in 2020 during which tech stocks were in vogue and names like Zoom, Robinhood and Peloton were trading at multiples that implied they would become the next Apple or Microsoft.
Quality-biased fund managers can encounter several challenges in such environments, including avoiding speculative names and selling their winners too soon. Quality strategies often incorporate GARP (Growth at a Reasonable Price) even though discussions of quality as a factor do not technically address valuation. However, their bottom-up approach and consistent growth of their companies make these investment managers more aware of the cost they are paying for that growth. Quality strategies can offer superior downside protection and steadier returns than peers despite not experiencing the same highs as momentum strategies.
An example of a quality holding in our portfolios is CVS Group (CVSG LN), one of the U.K.’s largest veterinary practice operators and consolidators. The company’s complete service offering includes laboratories, surgeries and crematoria. CVS is known for hiring new graduates and providing them with training and development, creating a consistent pool of veterinarians in a talent-scarce and competitive industry.
The company satisfies most of our quality criteria, including:
At Global Alpha, we prioritize quality names like CVS in our investment strategy. The company provides downside protection while capturing above-market rates of sustained EPS and cash flow growth, allowing us to continue to build portfolios from the ground up.

TORONTO, ON, April 5, 2023 – Crestpoint Real Estate Investments Ltd. (Crestpoint) today announced the acquisition of a two building multi-family complex located at 2 & 4 Hanover Road in Brampton, Ontario (the Property).
The Property, comprised of two towers of 18 and 22 storeys, respectively, with a total of 605 units and 946 parking stalls, provides an attractive mix of 1, 2 and 3-bedroom suites that currently have a ~97% occupancy rate. In addition to the two existing towers, the Property’s 10 acre site can also support the development of an additional ~400 units in the future. The desirable location, minutes away from Highway 410 and both the Bramalea and Brampton GO stations, offers tenants easy access to multiple schools and a variety of retail, community and recreational amenities including Chinguacousy Park. Vestcor Inc. and Crestpoint, on behalf of the Crestpoint Core Plus Real Estate Strategy (its open-end fund), split a 90% interest in the Property. InterRent REIT acquired the remaining 10% and will provide property management services on behalf of the ownership group.
The closing of this acquisition brings Crestpoint’s total assets under management to approximately $9.9 billion and 36.5 million square feet.
About Crestpoint
Crestpoint Real Estate Investments Ltd. is a commercial real estate investment manager dedicated to providing investors with direct access to a diversified portfolio of commercial real estate assets. Crestpoint is part of the Connor, Clark & Lunn Financial Group, a multi-boutique asset management company that provides investment management products and services to institutional and high-net-worth clients. With offices across Canada and in Chicago, London and Gurugram, India, Connor, Clark & Lunn Financial Group and its affiliates are collectively responsible for the management of approximately $104 billion in assets. For more information, please visit: www.crestpoint.com.
Contact
Elizabeth Steele
Director, Client Relations
Crestpoint Real Estate Investments Ltd.
(416) 304-8743
[email protected]
Connor, Clark & Lunn Funds Inc. (the “Manager”) has amended language on its website in an effort to clarify that ESG factors and representations made by the Manager are not investment objectives, nor do they form a material element of the investment strategies of its publicly offered mutual funds. The following statement was removed at the request of Ontario Securities Commission Staff in the course of an issue-oriented review of ESG-related funds: “CC&L Funds is committed to engaging in responsible corporate behavior as it relates to environmental, social, and governance (ESG) concerns and seeks to make investments that not only generate superior returns for its investors but have a positive impact on the society, environment, and markets in which they operate.”
In addition to amending its website, the Manager has updated the disclosure in the simplified prospectus for its alternative mutual funds prospectus and is in the process of updating the simplified prospectus for its conventional mutual funds in order to provide specific disclosure to investors regarding the role that ESG factors and considerations play in the investment decision-making process of certain funds.
Funds included in the Manager’s alternative mutual fund simplified prospectus:
Funds included in the Manager’s conventional mutual fund simplified prospectus:
About Connor, Clark & Lunn Funds Inc.
Connor, Clark & Lunn Funds Inc. (CC&L Funds) partners with leading Canadian financial institutions and their investment advisors to deliver unique institutional investment strategies to individual investors through a select offering of funds, alternative investments and separately managed accounts.
By limiting the offering to a focused group of investment solutions, CC&L Funds is able to deliver unique and differentiated strategies designed to enhance traditional investor portfolios. For more information, please visit cclfundsinc.com.
About Connor, Clark & Lunn Financial Group Ltd.
Connor, Clark & Lunn Financial Group Ltd. (CC&L Financial Group) is an independently owned, multi-affiliate asset management firm that provides a broad range of traditional and alternative investment management solutions to institutional and individual investors. CC&L Financial Group brings significant scale and expertise to the delivery of non-investment management functions through the centralization of all operational and distribution functions, allowing talented investment managers to focus on what they do best. CC&L Financial Group’s affiliates manage over $104 billion in assets. For more information, please visit cclgroup.com.
For further information, please contact:
Lisa Wilson
Manager, Product & Client Service
Connor, Clark & Lunn Funds Inc.
416-864-3120
[email protected]
Global economic sentiment has improved on the back of China’s reopening and a collapse in the European gas price but monetary indicators continue to signal a negative outlook. The “excess” money backdrop remains unfavourable for equity markets, with prospective developments suggesting overweighting non-energy defensive sectors and expecting a further relative recovery in quality / growth.
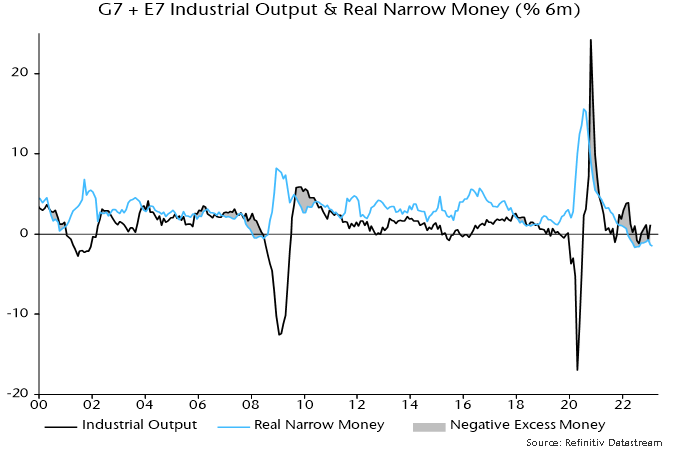
Revisions to US seasonal adjustments have slightly altered the recent profile of global (i.e. G7 plus E7) six-month real narrow money momentum – the key leading indicator in the money / cycles forecasting approach used here. On the new numbers, momentum bottomed in June 2022, recovering modestly into December before falling back in January / February – see chart 1.
Chart 1
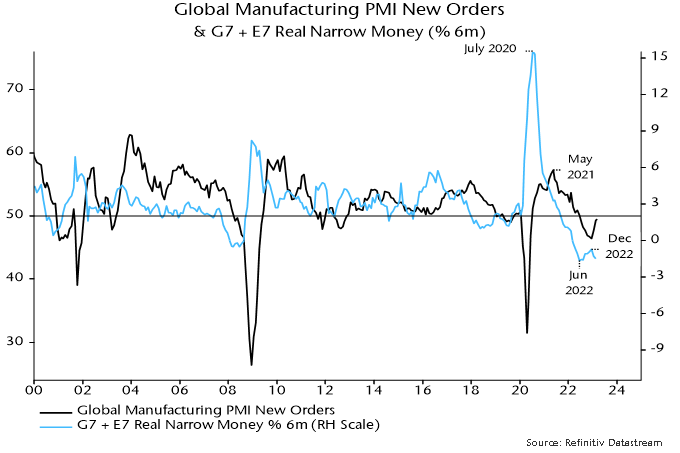
The June turning point has been followed – with a lag within the normal range – by a recovery in global manufacturing PMI new orders from a low in December, with the revival driven by a sharp rise in the Chinese component.
The PMI recovery is expected to fizzle out and reverse into H2, for both monetary and cycle reasons. Six-month real narrow money momentum, as noted, fell back in January / February and remains in negative territory – a sustained economic / PMI recovery has never occurred historically against such a monetary backdrop.
From a cycles perspective, major PMI lows occur around troughs in the stockbuilding cycle but the current downswing phase was only starting when PMI new orders bottomed in December. With the last cycle trough in Q2 2020, the average historical cycle length of 3 1/3 years suggests another low in H2 2023.
The marginal recovery in global six-month real narrow money momentum since June 2022 has been driven entirely by China and several other E7 economies. US / European momentum has slid deeper into negative territory as already restrictive monetary policy settings have been tightened further – chart 2.
Chart 2
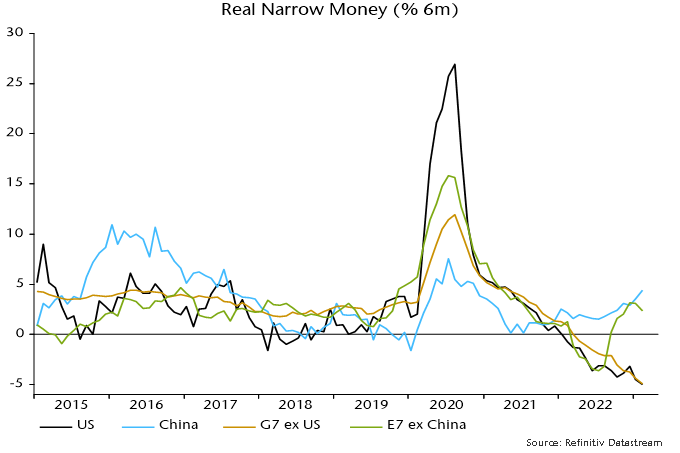
The Chinese pick-up suggests economic acceleration through 2023 but a recovery will be held back by – and won’t offset – global weakness. Current Chinese real money strength, moreover, could fade: higher short-term rates / yield curve flattening since late 2022 suggest a slowdown in nominal money growth while unusually low inflation may revive as the economy normalises.
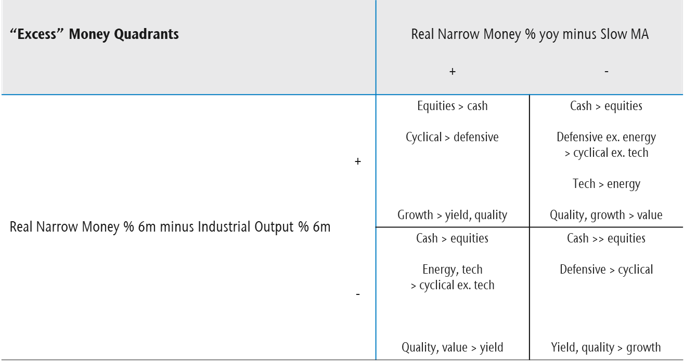
The assessment of market prospects relies on two indicators of global “excess” money – the gap between six-month real narrow money and industrial output momentum, and the deviation of year-on-year real money momentum from a long-term moving average. The signs of the two indicators define four investment quadrants describing different market environments – see table 1. (This presentation echoes Hedgeye’s investment “quads”, in their case defined by the directions of economic growth and inflation – the approach here offers an alternative “monetarist” perspective.)
Table 1
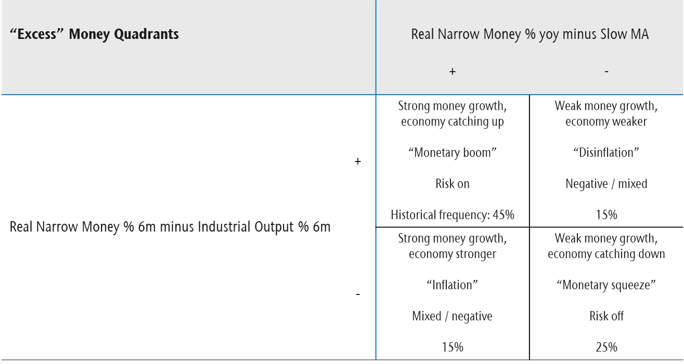
The two indicators were negative from January 2022 (allowing for reporting lags) through year-end but the last quarterly commentary suggested that the first measure would turn positive in early 2023 as weakening industrial output momentum crossed below stable or rising real money momentum. Based on historical patterns, the implied shift from the bottom right to top right quadrant might be associated with less negative equity markets and a reversal of some of last year’s sector / style moves, including relative recoveries in quality / growth and tech – table 2.
Table 2
The suggested sign switch of the first indicator had not occurred by January – chart 3 – but markets appeared to front run the quadrant shift in Q1, with tech / growth outperforming strongly and energy / financials weak. A cross-over of six-month industrial output momentum below real money momentum is still expected here, although timing is uncertain – Chinese reopening has delayed industrial weakness. Some Q1 moves were extreme so it may be advisable to await confirmation before adding to favoured themes.
Chart 3
A common characteristic of the right hand quadrants of the table is a trend of non-energy defensive sectors outperforming non-tech cyclical sectors. The reverse occurred during Q1, although much of the cyclical relative gain unwound later in the quarter as financials were pummelled by banking crises. With no early move to the left hand of the table in prospect, an overweighting of non-energy defensive sectors – along with quality, which also usually outperforms in both right hand quadrants – is suggested.
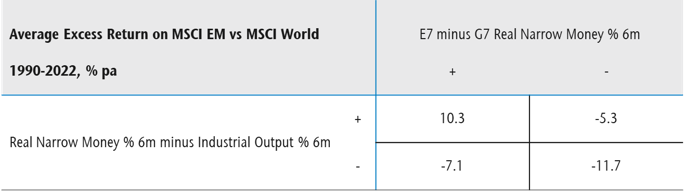
The stark contrast between positive and rising E7 six-month real narrow money momentum and faster contraction in the G7 raises the question of whether investors should overweight EM equities. Over 1990-2022, EM equities outperformed developed markets by 3.2% pa on average when the E7 / G7 real money momentum gap was positive, underperforming by 6.1% when it was negative.
Further investigation, however, indicates that a positive gap is a necessary but not sufficient condition for EM outperformance – the global “excess” money backdrop, in addition, needs to be taken into account. Table 3 shows that, since 1990, EM equities have outperformed on average only when both the E7 / G7 gap and the first global excess money indicator were positive. Confirmation of a sign change in the latter indicator would strengthen the case for overweighting EM.
Table 3
Historically, periods of sustained EM outperformance coincided with trend declines in the US dollar. The dollar reached major peaks in 1969, 1985 and 2002. These peaks occurred 6-7 years before housing cycle lows (in 1975, 1991 and 2009). Assuming a normal (i.e. c.18 year) cycle length, another cycle low is scheduled for the late 2020s. A dollar peak in October 2022, therefore, may turn out to be a major top, preceding a trend decline into or beyond the housing cycle trough.

Each year, the CC&L Foundation supports numerous not-for-profit organizations across Canada in support of:
In particular, it aims to support organizations in which our employees or partners have a personal connection and have made financial or time commitments.
CC&L Foundation commits $125,000 to Ronald McDonald House Charities Alberta
In 2022, the CC&L Foundation committed $125,000 to Ronald McDonald House Charities Alberta. The Ronald McDonald House supports families who need to travel while seeking vital medical treatment for their seriously sick or injured child. They provide a home-away-from-home when those families are experiencing one of life’s most difficult times. Each year, thousands of families will stay at one of the four Ronald McDonald houses in Alberta, and stays can last anywhere from a few nights to several months.
Currently, Ronald McDonald Houses are only able to serve 14% of those who need to travel for pediatric care within Alberta. This results in some families being turned away to make their own arrangements, sometimes resulting in keeping families away from their children. To expand capacity and assist in meeting the high demand, Ronald McDonald Houses are in the process of doubling their capacity in Edmonton and Calgary. The CC&L Foundation’s donation is contributing to these expansion projects.
CC&L Private Capital volunteers at Home for Dinner
Jim Kapeluck is a Wealth Advisor with our CC&L Private Capital team in Edmonton. Earlier this year, Jim and the local team volunteered at one of the Ronald McDonald ‘Home for Dinner’ nights. The team prepared and served meals to families in need.
Find out more about the work of the CC&L Foundation.

It has been an extremely busy period as we navigated the banking environment. The risk of contagion is top of mind as well as the impact on our investments. The difficulty is that for a bank, added outsized risk can come in many shapes and forms. In 1907, the crisis came from overzealous bank owners attempting to corner the copper market. Today, for SVB, it came from duration misalignment of investments and even cryptocurrencies for Signature Bank. Elevated risk taken by banks often occurs when executives allow deposits and loans to grow faster than what their specific team of lenders and investment managers can handle in relation to risk.
Elevated risk can also come from other sources, such as too much government intervention in the case of the Baoshang bank in China in 2019 or severe mismanagement at all levels in the case of Credit Suisse. That’s the bad news. With 25,000 banks globally and 4,844 in the U.S. alone, let’s expect further difficulties to the system. Outflows are at 1.9%.
The good news is this is taken with extreme attention by government and banking associations. In the last two weeks, our team has travelled extensively, especially in Japan and the U.S. We were actually in California when we noticed the SVB debacle on the Friday. During a Monday morning presentation, a non-portfolio company commented that it had a US$80 million deposit with the California bank. All access to deposits was resolved by 11 a.m., certainly a sign of quick response.
Global Alpha holds larger exposure to financial services firms than bank stocks themselves. Its largest exposure is with Rothschild & Co (Roth FP), which provides global financial advisory (mergers and acquisitions and financing advisory). The company also has a wealth division and merchant bank that account for 24% and 16% of sales, respectively. Tracing back to 1760, the company now operates with 4,200 financial specialists across 40 countries. From its strong Europe-based foothold, the company is successfully growing its operations in North America. Rothschild & Co is presently subject to a takeover bid by the founding family’s financial holding.
Another important position for us in financial services is PRA Group (PRAA US). The U.S.-based company is a leading debt collection agency servicing mostly the financial industry, acquiring debt packages from banks and credit card companies. PRA is vertically integrated, from debt acquisition all the way down to call center-based collections, giving it a strong competitive edge. Increasing regulations implemented in the debt collection industry are certainly favouring PRA in the long term. The company has global footprint, with leading operations in North America and Europe.
Our positioning in regulated banks follows our general philosophy of investing in quality assets where we assess balance sheet strength, operational excellence, competitive standing and target markets. We generally tend to be underweight in banks, as most banks have low exposure to higher-growth investment themes and/or are constrained by increasing regulations. Our holdings include:
Seven Bank Ltd. (8410 JP): The company provides banking services mainly through automated teller machines (ATM) across Japan. Culturally, the Japanese continue to rely on cash as their preferred payment method, mostly for security and identity theft reasons. Although licensed under a bank charter, Seven Bank majorly operates as a technology company through its 26,253 ATM outlets. Services are growing rapidly supplementing cash distribution, and novel and growing additions include credit and investment services. Its balance of deposits stands at ¥578 billion while its loan book conservatively stands at ¥32.7 billion.
With over 250 banks in our index, Global Alpha has low exposure to direct commercial real estate lending, an area that is being scrutinized with the increasing vacancies in commercial downtown centers. Our direct exposures are the following:
Wintrust Financial Corp. (WTFC US): Wintrust is a financial holding company with community bank locations in and around Chicago and northern Illinois, southern Wisconsin and northwest Indiana. Branded as Chicago’s bank, its lending book is highly diversified with a low exposure (6%) to residential real estate, all else mostly being small commercial (sub US$1.5 million) suburban business loans, with downtown office commercial real estate being a small part. An additional Wintrust differentiator is that it owns 15 bank charters, providing FDIC coverage 15 times over for every customer, or up to US$3.75 million in total guaranteed deposit coverage. We believe Wintrust will gain market share as it further commercializes this service.
UMB Financial Corp. (UMBF US): UMB is a U.S.-licensed bank operating nationwide, with main branches throughout Missouri, Illinois, Colorado, Kansas, Oklahoma, Nebraska, Arizona and Texas. Its US$31 billion in deposits is only 20% exposed to the consumer market. Deposits are otherwise commercial (46%) and financial services (17%). The majority (54%) of its US$17 billion loan book is in commercial and industrial lending. UMB maintains a low loan-to-value ratio (currently at 59%). With a 54% loan-to-deposit ratio, UMB also remains at the low end of the 74% peer median.
As you can see, our investment process has led us to financial services companies and banks with differentiated offerings, competitive advantages and defendable barriers to entry. These specialty-focused organizations tend to operate outside of the core banking space where increased risk (from volatile and unpredictable deposits and loans) is taken to achieve return targets. We will continue to monitor the bank environment as well as the health of our bank investments through direct engagement.

Connor, Clark & Lunn Funds Inc. (CC&L Funds) is excited to announce two absolute-return oriented portfolios in liquid alternative fund form, CC&L Global Market Neutral II Fund and CC&L Global Long Short Fund (the Funds).
CC&L Global Market Neutral II Fund seeks to earn a positive and attractive risk-adjusted return over the long term while demonstrating low correlation with, and lower volatility than, traditional equity markets. Risk rating: Low to Medium.
CC&L Global Long Short Fund seeks to provide long-term capital appreciation and attractive risk-adjusted returns by actively investing in a portfolio of long and short securities. Risk rating: Medium.
To manage the Funds, CC&L Funds has retained Vancouver-based Connor, Clark & Lunn Investment Management Ltd. (CC&L Investment Management), one of Canada’s largest privately-owned asset management firms, with close to 20 years of experience in managing alternative investment strategies for institutional investors.
“We have been told by our client base that they want access to institutional-caliber alternative investments, managed by a team with a demonstrated track record of success, in the convenience of a liquid alternative fund. By introducing these two new portfolios, we are meeting those objectives and providing investment advisors and their clients with two attractive risk & return profiles to choose from,” said Tim Elliott, President and CEO of CC&L Funds.
“We are excited that these alternative investment solutions are being made available to a broader group of individual Canadian investors. As we have transitioned into an environment with structurally higher interest rates and inflation, we expect market cycles to be shorter, volatility to be higher, and returns from conventional risk assets to be lower. In such an environment, we believe it will become more important for investors to incorporate sources of return that are independent of stock and bond markets to enhance portfolio outcomes,” said Martin Gerber, President and Chief Investment Officer at CC&L Investment Management.
Both CC&L Funds and CC&L Investment Management are affiliates of Connor, Clark and Lunn Financial Group (CC&L), whose multi-affiliate structure brings together the talents of diverse investment teams that offer a broad range of traditional and alternative investment solutions. CC&L is one of Canada’s largest independently owned asset managers, responsible for over $104 billion in assets on behalf of institutional and individual investors.
Available in A and F Series, the Funds conform with the regulatory framework related to alternative mutual funds offered by Simplified Prospectus. The Funds are offered through licensed investment dealers, priced daily, with daily liquidity, and available through FundServ.
About Connor, Clark & Lunn Funds Inc.
Connor, Clark & Lunn Funds Inc. (CC&L Funds) partners with leading Canadian financial institutions and their investment advisors to deliver unique institutional investment strategies to individual investors through a select offering of funds, alternative investments and separately managed accounts.
By limiting the offering to a focused group of investment solutions, CC&L Funds is able to deliver unique and differentiated strategies designed to enhance traditional investor portfolios. For more information, please visit cclfundsinc.com.
About Connor, Clark & Lunn Investment Management Ltd.
Connor, Clark & Lunn Investment Management Ltd. (CC&L Investment Management) is one of the largest independent partner-owned investment management firms in Canada with $54.2 billion in assets under management. Founded in 1982, CC&L Investment Management offers a diverse array of investment services including equity, fixed income, balanced and alternative solutions including portable alpha, market neutral and absolute return strategies.
CC&L Investment Management is a part of Connor, Clark & Lunn Financial Group Ltd. (CC&L Financial Group), a multi-boutique asset management company whose affiliates collectively manage approximately $104 billion in financial assets. For more information, please visit cclinvest.cclgroup.com.
About Connor, Clark & Lunn Financial Group Ltd.
Connor, Clark & Lunn Financial Group Ltd. (CC&L Financial Group) is an independently owned, multi-affiliate asset management firm that provides a broad range of traditional and alternative investment management solutions to institutional and individual investors. CC&L Financial Group brings significant scale and expertise to the delivery of non-investment management functions through the centralization of all operational and distribution functions, allowing talented investment managers to focus on what they do best. CC&L Financial Group’s affiliates manage over $104 billion in assets. For more information, please visit cclgroup.com.
Lisa Wilson
Manager, Product & Client Service
Connor, Clark & Lunn Funds Inc.
416-864-3120
[email protected]