Korean national assembly hall at night in Seoul, South Korea.

Deeply unpopular South Korean president Yoon Suk Yeol committed a monumental act of executive overreach with his declaration of martial law on the 3rd of December. The decree was a wild strike against the opposition Democratic Party, which had effectively paralysed his presidency since taking power in parliament earlier this year.

The move set off a chaotic few hours of street protests with deployment of the military in the streets of Seoul and politicians of all stripes, including the head of the president’s own People Power Party, denouncing the declaration. The drama culminated in a unanimous vote by the country’s legislature (including members of the president’s party) to reverse the failed coup attempt.

Big moves in the Won and Korean equities

Titled

Titled
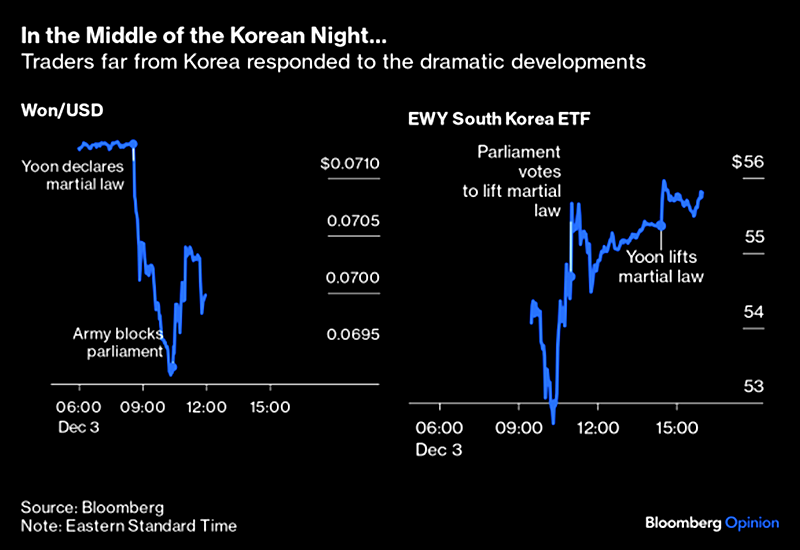
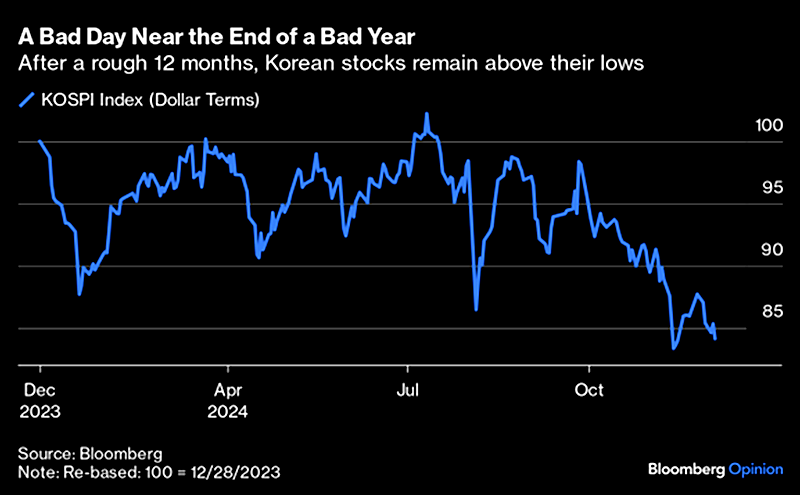
Source: Bloomberg Opinion, December 4, 2024

Yoon now faces the threat of impeachment, but that is probably the least of his worries. Around half of South Korea’s living former presidents are sitting in prison, and Yoon may be set to join their ranks.

Is it too rose-tinted a view to argue that the legislature’s swift move to strike down the declaration is a positive demonstration of institutional checks shifting into gear? Almost certainly, as the People Power Party has said that it will seek to block any impeachment motion in the legislature (the motion requires a two-thirds majority of the 300-seat parliament). It is safe to say that this political crisis is set to grind on for some time yet.

Sitting tight

We have been underweight South Korea, with low exposure to the domestic economy  through bank KB Financial, Kia and Hyundai, partly reflecting weak monetary trends. DRAM export giants SK Hynix and Samsung Electronics make up two-thirds of our holding.

Earlier this year we wrote to investors on the prospects for the Value-Up corporate reform program promoted by the Yoon government to boost perennially cheap Korean equities (Super-cheap Korean equities rally on market reform talks). At the time we had shifted to a significant overweight, favouring likely domestic reform beneficiaries.

However, a landslide win for the opposition DPP in the legislature in April made it less likely the program would be implemented in full. The political shift occurred against a weakening economic backdrop globally, and also in South Korea’s highly cyclical domestic economy.

Following a downgrade to our country rating, we reduced exposure to Kia and Hyundai. We also took some profits from our position in SK Hynix after strong performance on its monopoly as a high-bandwidth memory supplier to Nvidia.

Given the above, we are not tempted to try and catch a falling knife by doubling down in South Korea.

Samsung Electronics is cheap, but is that enough?

Following a strong start to the year, Samsung Electronics fell sharply since July and now ranks as one of the worst performers year-to-date in our portfolio. What happened?

Sell-off for Samsung Electronics since July
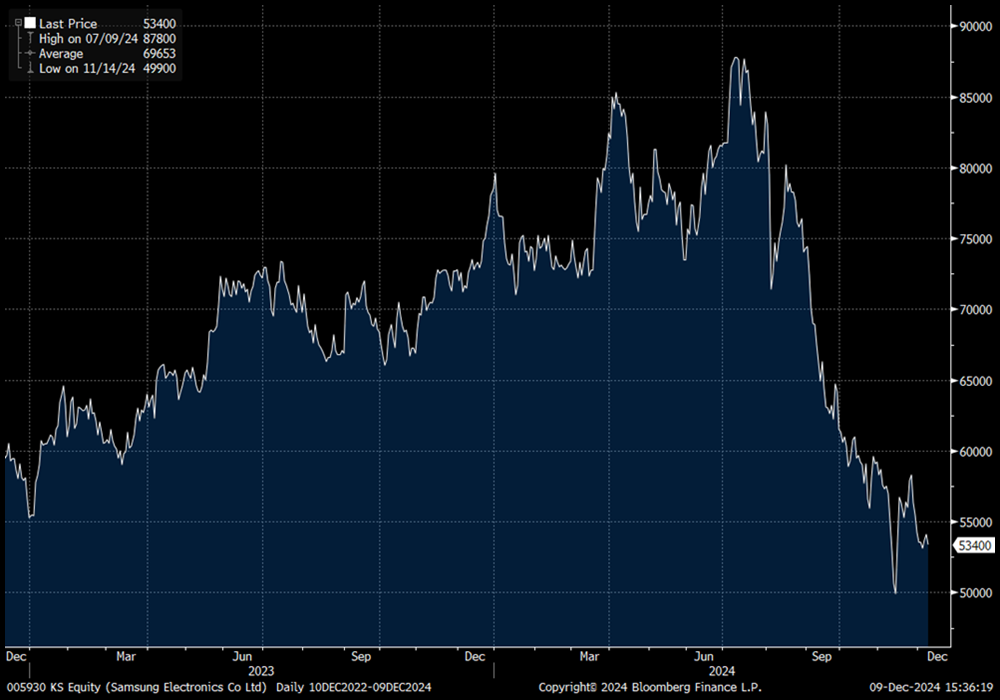
A line graph illustrating the value of Samsung Electronics Co. Ltd over the past 12 months.
Source: Bloomberg

Investors fear that management missteps have cost the company its technological edge in chipmaking. Indeed, we have been surprised by how badly Samsung has lagged SK Hynix in high-bandwidth memory. It ranks as a distant second to Hynix as a supplier of HBM3E memory to Nvidia and it is uncertain whether the company can close the gap in the next generation of HBM products.

In addition, the long hoped-for demand recovery in commoditised DRAM products is yet to arrive. More bearish analysts fret over the rise of Chinese memory and what this could mean for the Samsung-Hynix-Micron oligopoly, which has kept supply in check over the past decade.

Samsung Electronics, SK Hynix and Micron have maintained an iron grip on DRAM supply
A bar chart illustrating the share of DRAM revenue between the leading manufacturers.
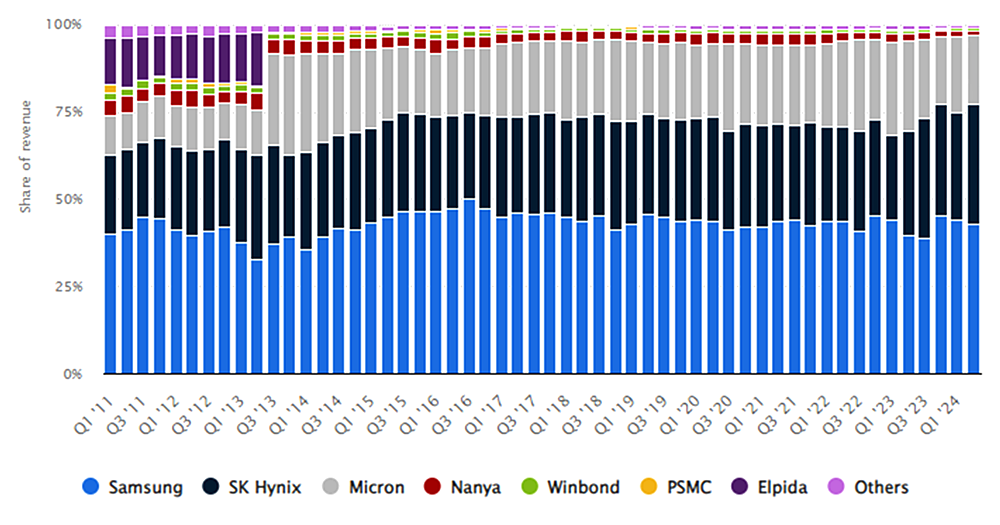
Source: Statista 2024

Major Chinese DRAM players like CMXT are yet to register in global market share, but risks to the oligopoly may emerge down the road.

All of the above paints a pretty sorry picture for Samsung, reflected in valuations that are at the bottom of historic ranges.

Buying at these levels has historically been a good bet – Samsung Electronics Price/Book

A line graph illustrating the price to book ratio of Samsung Electronics Co. Ltd over the years.
Source: Bloomberg

Management is desperate to turn this around through deep restructuring, boosting R&D spend and buying back shares. Samsung has a history of pivoting out of trouble, and the valuation is incredibly cheap for one Asia’s most successful tech behemoths.

We are not tempted to double down at these levels, but plan to maintain the current weighting. Moving forward, we will look to see whether Samsung can reassure investors by gaining qualification as a HBM supplier for Nvidia’s leading-edge products. Not only would this boost earnings, it would also signal that it can close the tech gap with SK Hynix.

Mindful of “success bias” in US equities

Investors in emerging markets are going against the grain. Today the herd is stampeding into US stocks. The drivers for the dominance of US equities are compelling, propelled by better economic performance, higher productivity growth and innovation.

Equity flows by region
A series of bar and line charts illustrating equity flows by region.
Source: EPFR

And yet, making money as an investor is all about the delta between reality and expectations. Investors myopically fixated on market narratives about US exceptionalism as justification for extreme outperformance versus the rest of the world risk overstaying their welcome, along with missing opportunities in unloved markets.

Ruchir Sharma’s Financial Times article The Mother of All Bubbles opines on just how dominant the United States has been as an investment destination:

  • Global investors are committing more capital to a single country than ever before in modern history.
  • And the dollar, by some measures, trades at a higher value than at any time since the developed world abandoned fixed exchange rates 50 years ago.  
  • The US now attracts more than 70 per cent of the flows into the $13tn global market for private investments, which include equity and credit.
  • America’s share of global stock markets is far greater than its 27 per cent share of the global economy.
  • Thoroughly dominating the mind space of global investors, America is over-owned, overvalued and overhyped to a degree never seen before.

UBS just published some excellent charts illustrating just how stark this dominance has been:

Relative sizes of world stock markets, end – 1899 (left) versus start – 2024 (right)
Two circle graphs comparing the relative sizes of world stock markets from the end of 1899 and the beginning of 2024.

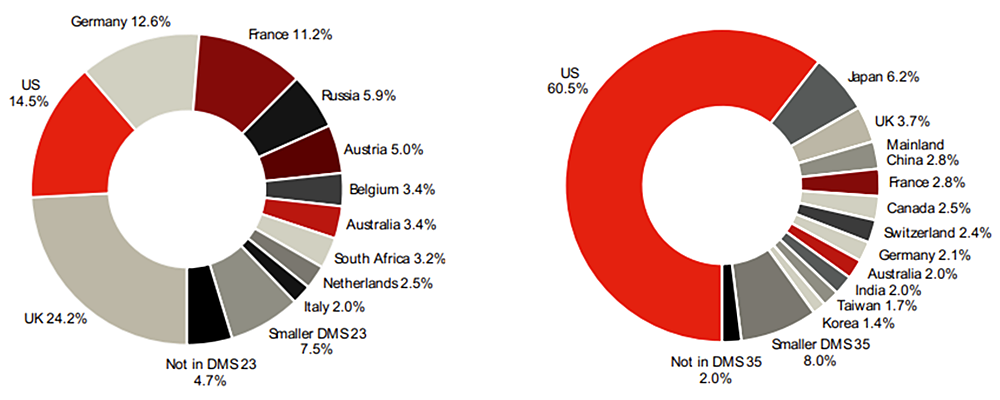
Source: Global Investment Returns Yearbook 2024, UBS

Investors adding to US exposure at the expense of the rest are making a bet that such scorching outperformance can continue.

While it seems unlikely, author of liquidity theory and bubble expert Gordon Pepper said that to work out the duration of a bubble, take your best analysis to work out how long it will go, double that, and then subtract a month. In other words, extenuated bull markets (or bubbles) have a habit of going on longer than we could ever imagine before ending abruptly (and often brutally).

We believe it is a fool’s errand to attempt to predict when equities ex-US will be back in vogue. However, what we know for sure is that less competition among buyers in unloved emerging markets tilts the odds of unearthing value-creating businesses at attractive prices in our favour.

Monthly UK money growth was boosted by households scrambling to dispose of assets ahead of the Budget, with a reversal likely and corporate liquidity trends worryingly weak.

The narrow and broad money measures tracked here – non-financial M1 / M4 – rose by 0.9% in October, in both cases representing the largest monthly increase since 2021, when the Bank of England was still conducting QE.

Strength was focused on the household sector, with a monthly rise in M4 holdings of £20.2 billion (1.1%) versus a £7.6 billion average over the previous half-year – see chart 1.

Chart 1

Chart 1 showing UK Household Money (mom change, £ bn)

Six-month momentum of household real narrow money, which had edged into positive territory in September, rose to a three-year high. Corporate real narrow money momentum, by contrast, was the most negative since March, suggesting that firms were facing a financial squeeze before the Budget national insurance grab – chart 2.

Chart 2

Chart 2 showing UK GDP & Real Narrow Money (% 6m)

Corporate broad money holdings contracted at a 1.7% annualised rate in nominal terms in the six months to October, while M4 lending to the sector grew by 5.6%. The corporate liquidity ratio, therefore, fell at a 6.9% pace.

Households crystallised capital gains, accelerated property transactions and withdrew cash from pension funds to avoid mooted Budget tax hikes. Retail savers sold £5.9 billion of investment funds in October, the most since September 2022, according to the Investment Association. The number of residential property transactions rose by 10% on the month, with non-residential deals jumping 40% to a record.

An increase in asset turnover has no monetary impact where transactions are between UK residents and involve offsetting changes in the bank balances of buyers / sellers. A monetary boost occurs when UK-owned assets are sold to overseas residents and / or when transactions are associated with an increase in bank lending.

Non-financial M4 lending (i.e. to households and private non-financial corporations) rose by £7.2 billion in October versus a prior six-month average of £4.1 billion.

UK buyers of assets, moreover, may have made room for purchases by reducing demand for gilts, requiring an offsetting rise in bank lending to the public sector. Gilt sales to the UK non-bank private sector slowed to £6.1 billion in October versus a prior six-month average of £12.3 billion. The credit counterparts analysis shows a positive public sector contribution to the change in M4 of £11.0 billion (0.4%).

Sales of assets to overseas investors, meanwhile, may have been significant, judging from a £9.1 billion monthly fall in non-resident net sterling deposits.

Sellers of assets for tax reasons are unlikely to wish to retain permanently higher money balances. “Excess” funds may be used to repay bank lending, increase gilt purchases and buy assets from non-residents, resulting in a reversal of the monetary boost.

The suggestion is that the pick-up in household money momentum should be discounted, with greater weight given to deteriorating corporate trends.

Group of people eating assorted cupcakes at a party.

SK Capital Partners announced the recent acquisition of Spectra Confectionery Limited, continuing their focus on the food ingredients sector. Debt funding for the deal was provided by MidStar Capital.

Read more

GACM_COMM_2024-12-05_Banner
Source: Hyundai Heavy Industries

Last month, we visited Korea (South, not North) which remains in the “Emerging Markets” indices. We visited to conduct due diligence on existing and prospective holdings, attend a conference and meet with and learn from local asset managers who share the same approach to investing as us.

From the Miracle on the Han River to K-everything

From the ruins of the Korean War (1950 – 1953), Korea emerged to become the tenth largest economy in the world in 2005. Dubbed “the Miracle on the Han River,” Korea’s GDP grew from USD1.3 billion (GDP per capita of USD67) immediately after the war to over USD1.7 trillion (GDP per capita of over USD33,000) 70 years later in 2023. Continuous investment in technology and human capital has been a driving force behind the economic development. According to Organisation for Economic Co-operation and Development’s (OECD) latest publication on R&D spending as a percentage of GDP data, Korea (5.2%) ranked second only to Israel (6.0%) and higher than the United States (ranked third with 3.6%) in 2022.

First used to denote Korean pop culture (K-pop) and Korean drama (K-drama), the use of the “K-” prefix to introduce anything Korean to the outside world has spread to K-food (Korean BBQ, Buldak ramen), K-beauty (Beauty of Joseon, Anua, Cosrx), K-defense (K2 tank, K9 artillery), etc. What is interesting is that given the diversity of industries represented in the Korean Stock Exchange, these K-themes present potential investment opportunities. In this week’s commentary, we take a closer look at one of the themes that has been gaining traction among the local asset managers: K-shipbuilding.

Korea as a global shipbuilding powerhouse

Korea, China and Japan dominate the global shipbuilding scene, with combined market share of 91% in terms of Compensated Gross Tonnage (CGT) in 2023. China accounted for 51% and leads the world in dry bulks, tankers and containerships as the world’s largest importer of commodities. Korea, which came second with 26% share, has differentiated by prioritizing high-value ship orders (liquified natural gas carriers (LNG carriers), gas carriers and drill ships) given its cost disadvantage versus China. When we visited HD Hyundai Heavy Industries (329180 KS)’s shipyard in Ulsan – which is the largest shipyard in the world – we were able to see with our own eyes that of the ten fully occupied dry docks, six or seven of them had LNG carriers under construction. In 2022, the world saw an unprecedented number of orders for LNG carriers. One hundred and sixty-three LNG carriers were ordered in 2022, up 117% year-over-year and nearly five times the prior 20-year average of 34. Korean shipyards won orders for 121 LNG carriers or 74% of total.

LNG is widely regarded as a “bridge fuel” to smooth the transition to net zero. Over the years, the United States has emerged as a major exporter of LNG, joining the ranks of the Middle East and Australia as top exporters of LNG. The demand for LNG is mostly found in Asia and Europe, sparking demand for LNG carriers that can transport the liquid across the seas.

GACM_COMM_2024-12-05_Chart01
Source: LNG export & import shipping routes. Incorrys, used with permission.

LNG is also increasingly being used to power ships (as dual fuel), and this is driven by the strengthening greenhouse gas (GHG) emission regulations in the maritime industry. On January 1, 2020, the International Maritime Organization’s rule (known as IMO 2020) to limit the sulphur content in the fuel oil used to power ships came into force. Last year, the IMO unanimously agreed to reach net-zero GHG emissions from international shipping by 2050. This year, the EU ETS (EU Emissions Trading System) introduced the first ever carbon tax for ships entering and exiting EU ports.

Against this backdrop of strengthening GHG emission regulations in vessels, Shell projects LNG bunkering to increase as more containerships are expected to run on LNG. We met with senior engineers from Samsung Heavy Industries (010140 KS) and HD Hyundai Mipo (010620 KS) during our trip and learned about how the regulations are driving the Korean shipyards to develop next generation ships powered by LNG, ammonia and liquified hydrogen. HD Hyundai Mipo expects LNG bunkering to remain the primary fuel choice until 2040, after which ammonia is expected to take over. Year to date, of the eight orders for LNG bunkering vessels, HD Hyundai Mipo alone won three.

GACM_COMM_2024-12-05_Chart02
Source: Shell interpretation of Clarksons Research, DNV. Shell LNG Outlook 2024.

Investment spotlight: Dongsung Finetec

Korean shipyards (including Hanwha Ocean (042660 KS) not mentioned above) offer investment opportunities to capitalize on this long-term trend of increasing demand for LNG and vessels powered by alternative energy sources. However, their market caps are either above our limit or closer to the limit offering limited upside. At Global Alpha, we study an industry’s supply/value chain to identify how and where else the value is captured in the ecosystem.

Dongsung Finetec (033500 KS) is a Korean manufacturer of Mark III (licensed from GTT) membrane type cargo containment system (CCS) that is used to store LNG. The company serves both the Korean and Chinese shipyards and is one of only two companies (duopoly with 50% market share) that manufactures the CCS in the Korean LNG carrier supply chain. The company also manufactures LNG fuel tanks for ships using LNG as dual fuel and for LNG bunkering vessels and is currently developing an ammonia fuel tank.

When we invested in the company in late October, its share price had not reflected the company’s order backlog – which amounted to over four times the company’s 2023 revenue on the back of record LNG carrier order wins by the Korean shipyards – or the increased production capacity to convert more of the backlog to revenue. Trading at the time at only mid to high single digit price to forward earnings and against the backdrop of structural growth in demand for its CCS and fuel tank, we knew we had found a mispriced opportunity.

Jean-Philippe LemayConnor, Clark & Lunn Financial Group (CC&LFG) is pleased to announce that Jean-Philippe Lemay is joining its leadership team as a Managing Director, effective January 6, 2025.

Jean-Philippe’s responsibilities will include oversight of its global institutional distribution and marketing teams, as well as providing a broad leadership presence for CC&LFG in Quebec.

Prior to joining CC&LFG, Jean-Philippe spent 13 years with Fiera Capital, where he built its Liability Driven Investment Solution business before rising to the position of Chief Executive Officer. Jean-Philippe’s credentials include a BSc in Actuarial Sciences from Université Laval and an MSc in Financial Mathematics from Stanford University. He is also a Fellow of the Society of Actuaries (FSA) and a Fellow of the Canadian Institute of Actuaries (FCIA).

“We are thrilled to welcome Jean-Philippe to our firm,” said Warren Stoddart, CEO of CC&LFG. “He is an accomplished individual with deep experience and proven leadership skills who will be an invaluable addition to our leadership team. An individual of his caliber located in our Montreal office is an important step in the further development of our presence in Quebec in the years ahead.”

“I am honoured to join CC&LFG and look forward to helping shape the firm’s future development,” said Jean-Philippe Lemay. “CC&LFG is undeniably a success story in Canada’s financial services industry, having quietly grown to become one of the country’s largest independent asset management firms. Its affiliated businesses, including Global Alpha Capital Management, Baker Gilmore & Associates and CC&L Private Capital, have established a significant presence among institutional and high-net-worth clients in the province. I look forward to collaborating with the talented team at CC&LFG to build on this success and drive continued growth both locally and globally.”

CC&LFG and its affiliates manage over $135 billion in assets across a range of traditional and alternative investment strategies from offices in Canada, the US, the UK and India.

For more information, please contact:

Stephanie Wei
Senior Manager
Connor, Clark & Lunn Financial Group
416-823-2954
[email protected]

Eurozone services price momentum is “unsticking” as expected, supporting the forecast of sub-2% 2025 inflation.

post in September suggested that the ECB staff’s latest inflation forecast – like earlier projections – would be undershot.

With November’s favourable surprise, annual headline and core (i.e. ex. energy and food) consumer price inflation are on course to average 2.2% and 2.7% respectively in Q4, versus ECB September central projections of 2.6% and 2.9%.

Six-month headline / core momentum is still loosely tracking the profile of broad money growth two years earlier, a relationship suggesting a further decline and undershoot of the 2% target – see chart 1.

Chart 1

Chart 1 showing Eurozone Consumer Prices & Broad Money (% 6m annualised)

A fall in six-month core momentum to 2.1% annualised in November was driven by a sharp slowdown in services prices, which fell marginally on the month (ECB seasonally adjusted series).

Previous posts questioned central banks’ focus on “sticky” services inflation. Monetary conditions determine aggregate inflation, with the component breakdown partly shaped by “exogenous” factors. Earlier weakness in energy / food and core goods prices suppressed headline inflation while allowing consumers to spend more on services, delaying price deceleration in that sector. The suggestion was that services disinflation would speed up as downward pressure on goods prices eased.

This appears to be playing out: six-month goods momentum has recovered, mainly reflecting food price reacceleration and a slower fall in energy costs, with the headline impact neutralised by a “surprise” services slowdown – chart 2.

Chart 2

Chart 2 showing Eurozone Consumer Prices (% 6m annualised)

The “monetarist” relationship, taken at face value, implies a period of falling prices in 2025. The judgement here is to downplay this possibility and regard the monetary signal as directional rather than giving strong guidance about the level of price momentum.

The stock of money could still be above “equilibrium”, implying a cushion against deflation. This question can be addressed using the “quantity theory of wealth” – the idea that asset prices and incomes adjust such that a geometric average of wealth and nominal GDP rises in line with broad money over the medium term.

Chart 3 shows that, using Q4 2018 as a base, nominal GDP has lagged broad money significantly while wealth has slightly outpaced it. The nominal GDP / wealth average was still 2% short of the level implied by the money stock as of Q2 2024.

Chart 3

Chart 3 showing Eurozone Broad Money, Nominal GDP & Gross Wealth* Q4 2018 = 100 *Gross Wealth = Financial Assets (ex Money) of Households & NFCs + Residential Real Estate

A small “excess” money cushion, along with recent currency weakness, may head off an extreme scenario but money trends still suggest a sustained inflation undershoot and a need for further policy easing to achieve medium-term realignment.

November results confirm a September low in global manufacturing PMI new orders, with money trends suggesting a further rise through spring 2025, subject to tariff distortions.

The baseline scenario here has been that global industrial momentum – proxied by the manufacturing PMI new orders index – would bottom out in late 2024 and recover weakly into H1 2025. A manufacturing upturn was expected to be offset by loss of services momentum, with associated labour market weakness combining with favourable inflation news to support faster monetary policy easing.

The manufacturing part of the story is on track. The forecast of a late 2024 PMI new orders low was based on a recovery in global six-month real narrow money momentum from a trough in September 2023, taking into account a recent average interval of about a year between turning points in the two series. The new orders index reached a 22-month low on schedule in September, recovering solidly in October / November – see chart 1.

Chart 1

Chart 1 showing Global Manufacturing PMI New Orders & G7 + E7 Real Narrow Money (% 6m)

The turnaround has been mirrored by an alternative indicator based on national business surveys, although this bottomed one month earlier in August and has recovered by slightly less – chart 2.

Chart 2

Chart 2 showing Global Manufacturing PMI New Orders & G7 + E7 National Survey New Orders / Output Expectations

Chart 3 highlights the recent relationship between swings in six-month real narrow money momentum and directional changes in the alternative indicator. Real money momentum recovered between September 2023 and April 2024 but has since stalled at a weak level by historical standards, falling back in September / October.

Chart 3

Chart 3 showing G7 + E7 National Survey New Orders / Output Expectations & Real Narrow Money (% 6m)

Assuming that the lead time remains at about a year, the suggestion is that a rise in the survey indicator / PMI new orders will level off in spring 2025, falling short of prior historical peaks.

Forecast uncertainty is higher than normal because tariff threats are distorting behaviour. Accelerated stockbuilding could result in a stronger near-term pick-up and earlier peak with a subsequent normalisation – or worse if threats crystallise.

A group of business people in discussions at a corporate office.

Global shareholder activism reached a record high in the first half of 2024, with 147 activist campaigns launched, driven by the United States and Japan. US activity rose 15% to 61 campaigns compared with the same period in 2023. Japan reported 38 campaigns versus 14 a year ago, almost triple.

Behind the substantial uptick in Japan are structural changes in the capital markets and a significant shift in Japan’s corporate governance culture.

In April 2022, Tokyo Stock Exchange restructured the stock market from four to three segments, namely Prime, Standard and Growth, based on liquidity, corporate governance and other criteria. Then, on March 31, 2023, it requested that all listed companies on the Prime and Standard Markets “take action to implement management that is conscious of cost of capital and stock price.” The key focus is to increase capital efficiency of companies, especially those with a price-to-book ratio (PBR) of less than 1.0.

As of October 31, 2024, 88% of Prime Market listed companies (1452) and 47% of Standard Market listed companies (742) have disclosed initiatives or status. Regarding companies with market capitalization of JPY 100 billion or more and with PBR below 1.0, 98% have made the disclosure.

However, disclosure is one thing and improvement is another. As of September 30, 2024, about 38% of TOPIX 500 companies were still trading below book value. Return on equity of Japanese listed companies is expected to be around 8.6% for the fiscal year ending March 2025, well below the United States at 20% and Europe at 14%.

The good news is that almost half of these companies are cash-rich. Below is a comparison between the median of the largest 500 listed companies in the United States and Japan.

% of Companies with Net Cash Interest Expense / EBIT
  2000 2010 2024   2000 2010 2024
US 29.4% 31.2% 22.4% US 16.1% 14.8% 12.9%
Japan 26.8% 44.6% 47.6% Japan 20.5% 8.4% 3.4%

Source: Compustat. As of April 1, 2024

A solid balance sheet facilitates measures to increase shareholder return and unlock value. The following progress in various aspects is encouraging.

  • Dividend increase
    According to Nikkei, about 40% of companies plan to increase their dividends for the fiscal year ending March 2025. Total dividends are expected to reach a record high for the fourth consecutive year at approximately 18 trillion yen, up 8% from the previous year, and up 50% from five years ago.
  • Share buybacks
    From April to September 2024, 649 listed companies in Japan set aside 10.65 trillion yen to buy back shares, which is almost a double from a year ago. Some of these companies have low PBR, but many with high PBR also bought back shares to improve capital efficiency.

Number of MBOs and transaction value
A combined line and bar graph showing the numbers of management buyouts in Japan and the transactional value.
Source: Bloomberg as of December 2023


  • Divestment of non-core assets
    This is a popular tactic that activists in Japan are applying. It is estimated that in Japan, there is a huge gap of 22 trillion yen between real estate assets’ book value and market value. For example, companies such as Keisei Electric Railway, Tokyo Gas and Sapporo were all pushed by activists to sell some non-core real estate assets.

As the corporate culture in Japan is getting more investor-friendly, the line between shareholder activism and stewardship is getting increasingly blurred. Engaging in dialogues with management does not have to be hostile. At Global Alpha, we have been vocal at proxy voting and company meetings. In many cases, we voted against management in Japan due to board independence and board diversity, and suggested companies buy back shares, increase dividends and divest non-core assets. We are encouraged to see the progress in Japan and believe a greater emphasis on growth, profitability, sustainability and corporate governance will continue to benefit shareholders in the long term.

Greenkeeper. Golf course maintenance worker, cutting green grass.

Oakcreek Golf & Turf is pleased to announce leadership changes, effective January 1, 2025. Barrie Carpenter will transition to the role of Chairman of the Board, and Patrick Nolan will succeed him as President and CEO.

Read more

Aerial view of Cairo, Egypt showing the 6th October Bridge crossing over the Nile.

The strategy focuses on investing in frontier and emerging market companies that our team expects will benefit from demographic trends, changing consumer behaviour, policy and regulatory reform and technological advancements.

Below, we explore several key factors influencing returns and share observations on the portfolio and the markets.

Internet and technology portfolio

Investments that we wrote about in previous letters, including Lithuania’s Baltic Classifieds Group (BCG) and Egypt’s Fawry for Banking Technology and E-Payments (Fawry), performed well in the quarter.

BCG is the leading online classifieds group in the Baltics with a dominant position in auto, real estate, jobs and services and generalist marketplaces in Lithuania and Estonia. The company’s shares rallied in the quarter as the market reacted positively to the exit of Apax Partners LLP, the private equity firm that brought BCG to market via IPO in July 2021. Private equity ownership of public companies can often lead to an overhang on the share price and liquidity in the market. Typically, incremental buyers are discouraged by the prospect of an eventual wall of shares hitting the market when the private equity owner(s) decides to sell, and liquidity is lower because a relatively large percentage of the outstanding shares is not freely floated. A high-quality business like BCG, whose revenues and operating profits grew approximately14% annually over the last 4 years, generally absorb this type of overhang on their shares as incremental buyers step into liquidity events with more confidence. This was the mindset with which we approached BCG and thus actively participated in Apax Partners’ share sales this year, ramping up our participation as they approached their exit sale in July.

Fawry is the leading payments technology company in Egypt. The business is anchored by a base of over 360k point of sale machines (POS) that enable merchants to accept payments for the sale of their own merchandise (e.g.: a carbonated beverage) or on behalf of other large businesses like telecoms and utilities. Fawry has leveraged its first mover advantage in POS by introducing value-added services to their merchants such as supply chain financing (i.e.: working capital loans), ATM (a consumer can take out cash from a POS using the merchant’s float at the till for a fee), payment acceptance across many services and agency banking where it acts as a distributor of bank products to underbanked merchants and consumers through dedicated branches that are branded FawryPlus.

Fawry’s merchant offering extends beyond brick and mortar; it is also a leading payment gateway enabling online payments between consumers and merchants and, in the process, captures a piece of the fast-growing e-commerce market in Egypt. On the consumer side, Fawry’s app (MyFawry) counts over 5 million downloads and is experiencing strong momentum, driven by the introduction of a wide range of use cases including bill payments, virtual debit card wallets, buy-now-pay-later, insurance and savings products. In an inflationary environment like Egypt’s, Fawry’s transaction-based revenue model means it can grow revenues at a faster rate than costs due to the operating leverage inherent in its business. This was evident in second quarter 2024 results with operating margins expanding by more than 6% compared to the same period last year. Fawry shares reacted positively to the results, and more importantly to management guidance on net income for the full year, which implied a growth of about 67% y-o-y in local currency.

Like BCG, Fawry shares also benefited from the exit of private equity firm Helios Investment Partners (Helios) from the company in the quarter. Helios has been pressuring the shares through open market sales. Like the BCG case, we took advantage of the liquidity event and were involved in a discounted clean-up sale in which Helios sold its remaining 5% stake in Fawry, which helped remove the overhang on the shares.

Healthcare portfolio

The strategy experienced good returns from the healthcare portfolio during the quarter, driven mainly by Morocco’s Aktidal Group (AKT).

AKT is the leading healthcare provider in the country with approximately 15% of the private bed capacity in the country. The Moroccan healthcare market is severely underserved, with the rates of beds and physicians per 1,000 persons below regional averages and well below WHO recommended levels. (A WHO study ranks Morocco 79th of 115 countries in doctors per capita.) This has severely curtailed investment in the sector, with private providers accounting for under 30% of bed capacity in the country of around 40 million people. To address this shortage, the Moroccan government embarked on a series of reforms including rolling out a universal healthcare scheme and removing a restriction that allowed only doctors to invest in the sector. AKT operates 2,532 beds in 23 sites spread across 11 cities.

The clinics managed by AKT are known for their quality of care and the strength of their oncology department (30% of consolidated revenue). AKT is at the forefront of the growth in the sector: its 2023 results which showed revenue and operating profit growth of 84% and 86% respectively. On a recent trip to Morocco, we conducted site visits and meetings with Moroccan doctors and competitors of AKT which validated the company’s brand and reputation in the market and highlighted the growth opportunity that lies ahead for the company.

Outlook

We continue to be constructive on the opportunity set for the strategy as we enter the fourth quarter of the year. We believe we positioned the portfolio to be considerate of changes in the interest rate cycle, political environment and portfolio company valuations. As always, the ultimate objective of our decision-making process is to express our best research opinions through a diversified portfolio of high-quality businesses that we believe will help us deliver on the strategy’s return objective.

We look forward to continuing to update you on the strategy over the rest of the year.