Photo of Michael Mortimore

Michael Mortimore, NSP’s Client Portfolio Manager spoke to WealthBriefing on how analysis of liquidity cycles can help provide discipline in stock selection and asset allocation.

Michael joined NS Partners in February 2022, and previously worked at Somerset Capital and Macquarie Bank.

In the article, he explains how watching the flow of money from central banks can guide decisions on investing in those economies. He illustrates this theme using current emerging market examples, such as southeast Asia. According to Michael, “Our thinking behind exposure to the region was partly the chance that oil prices will stay high for longer, along with strong commodity prices and supportive money numbers. These markets have had a really good run this year and have recently been a source of cash for us.”

The article was published on August 11, 2022 in WealthBriefing, and was syndicated in WealthBriefing Asia.

Read the full article now.

There are three messages from Eurozone monetary data for May released yesterday.

  1. The region faces a major recession that is likely to extend into early 2023, at least.
  2. Economic prospects are at least as bad for core countries as for the periphery.
  3. Nominal monetary trends are consistent with inflation returning to – or falling below – the 2% target in 2023-24, arguing for an immediate suspension of ECB tightening plans.

The “best” monetary leading indicator of Eurozone GDP, according to ECB research, is real non-financial M1, i.e. holdings of currency and overnight deposits by households and non-financial corporations deflated by consumer prices.

The six-month rate of change of real non-financial M1 turned negative in January and fell further to -1.9% (not annualised) in May, below the lows reached before / during the 2008-09 and 2011-12 recessions – see chart 1.

Chart 1

Chart 1 showing Eurozone GDP & Real Narrow Money* (% 6m) *Non-Financial M1 from 2003, M1 before

Based on longer-run data for real M1, the current rate of real narrow money contraction is the fastest since 1981.

All previous recessions ended only after the six-month rate of change turned positive. The ECB research, meanwhile, found that real narrow money led GDP by three to four quarters on average. The suggestion is that an incipient recession will extend into Q1 2023, at least.

Chart 2 shows six-month rate of changes of real non-financial M1 deposits in the big four economies. (A country breakdown of currency holdings is unavailable.) In a reversal of the pattern before the 2011-12 recession, weakness is more pronounced in Germany and now France than in Spain and Italy. German divergence partly reflects higher inflation but nominal growth of deposits is also weaker in France / Germany than Spain / Italy.

Chart 2

Chart 2 showing Real Narrow Money* (% 6m) *Excluding Currency in Circulation, i.e. Overnight Deposits Only

Eurozone nominal money trends, meanwhile, indicate rapidly improving medium-term inflation prospects. Annual growth of broad money, as measured by non-financial M3, slowed to 4.8% in May, with three-month momentum down to 2.8% annualised, the lowest since 2018 – chart 3.

Chart 3

Chart 3 showing Eurozone Narrow / Broad Money

The slowdown has occurred despite a rise in annual growth in bank loan to a post-GFC high of 5.3% in May. This pick-up does not contradict the negative monetary signal – lending is a coincident or lagging indicator of GDP (confirmed by the ECB research). The coincident / lagging relationship partly reflects a correlation of corporate credit growth with the stockbuilding cycle – demand for short-term loans is strongest as inventories swell at the peak of the cycle. Consistent with this explanation, loans to corporations with a maturity of up to a year grew by an annual 7.0% in May.

The counterparts analysis of M3 shows that the slowdown has been driven by the ending of QE but also a significant balance of payments outflow, reflected in a fall in banks’ net external assets. This outflow is the mirror-image of a basic balance deficit, which has widened as a current account surplus has been wiped out by high energy prices while the Ukraine crisis and other factors have triggered an exodus of capital from the region.

Shorter-term leading indicators are confirming the negative signal for US economic prospects from monetary trends.

An independent calculation of the OECD’s US composite leading indicator suggests another fall in the indicator in June along with upward revisions to declines in prior months – see chart 1.

Chart 1

Chart 1 showing OECD US Leading Indicator* *Relative to Trend, Own Calculation

The indicator is calculated as a ratio to trend, i.e. a decline indicates that output will lag its trend rate of growth. The extent of the shortfall should be related to the speed of descent of the indicator. The current pace has been consistent with a recession historically.

The June indicator estimate incorporates new information for four of the seven components: housing starts, consumer sentiment, stock prices and the yield spread between 10-year Treasuries and Fed funds. Data for the remaining three – durable goods orders, the ISM manufacturing PMI and average weekly hours worked in manufacturing – will be released on 27 June, 1 July and 8 July respectively.

The indicator’s decline is notable for its breadth as well as speed: all seven components have contributed to recent weakness.

The June indicator estimate assumes little change in the three missing components. The ISM PMI could fall significantly. The Philadelphia Fed manufacturing survey for June reported a plunge in new orders (average of current and future balances), mirroring weakness in May’s Richmond Fed survey and suggesting a crash in the ISM orders index – chart 2. The latter has a 20% weight in the PMI and usually leads the other components.

Chart 2

Chart 2 showing US ISM Manufacturing New Orders & Regional Fed Manufacturing New Orders (Average of Current & Future)

A vicious real money squeeze, meanwhile, is intensifying. A weekly broad money measure calculated here was unchanged in nominal terms in early June from its level at the start of the year – chart 3. With consumer prices up by 4.1% over December-May and expected to post another large rise in June, real broad money will have contracted by about 5% (10% annualised) during H1.

Chart 3

Chart 3 showing US Weekly Broad Money Proxy* *Currency in Circulation + Commercial Bank Deposits + Money Funds

Global six-month real narrow money momentum – a key monetary leading indicator of the economy – is estimated to have moved deeper into negative territory in May, suggesting that a likely recession over the remainder of 2022 will extend into early 2023 – see chart 1.

Chart 1

Chart 1 showing G7 + E7 Industrial Output & Real Money (% 6m)

The May estimate is based on monetary data for countries accounting for a combined 65% weight in the G7 plus E7 aggregate tracked here, along with 93% CPI coverage. Missing numbers are assumed to have maintained stable rates of change.

Real money momentum of an estimated -1.2% (not annualised) compares with lows of 0.4% and -0.5% associated with the 2001 and 2008-09 recessions respectively.

Chart 2 shows a longer-term history using G7-only data. The current rate of contraction of G7 real narrow money was reached only twice over the last 50+ years – in 1973 and 1979 before severe recessions. The rate of contraction of real broad money is faster than during those episodes.

Chart 2

Chart 2 showing G7 Industrial Output & Real Money (% 6m)

Global real narrow money weakness intensified in May despite stable growth in China, mainly because of faster US contraction – chart 3. China’s positive monetary divergence may explain recent better equity market performance, with the MSCI China index now outperforming global indices year-to-date – chart 4.

Chart 3

Chart 3 showing Real Narrow Money (% 6m)

Chart 4

Chart 4 showing MSCI Price Indices USD Terms, 31 December 2021 = 100

The fall in global six-month real money momentum in May was driven by a further slowdown in nominal money growth, with six-month CPI inflation stabilising after a January-April surge – chart 5.

Chart 5

Chart 5 showing G7 + E7 Narrow Money & Consumer Prices (% 6m)

CPI momentum will almost certainly fall back in H2 – the relationship in chart 6 suggests that commodity prices would have to rise by a further 50% by December to prevent a decline.

Chart 6

Chart 6 showing G7 + E7 Consumer Prices & Commodity Prices (% 6m)

A CPI slowdown, however, could be offset by further loss of nominal money momentum – unless rising growth in China (22% weight in the G7 plus E7 aggregate) offsets likely weakness in the US / Europe.

Recent economic data have been interpreted as supporting the view that global growth is showing “resilience” in the face of significant shocks, in turn suggesting scope for central banks to continue to dial up hawkishness.

This reading of the data is disputed here while monetary trends continue to signal a high probability of a recession by end-2022 followed by a sharp inflation drop in 2023-24. Central bankers ratcheting up interest rate expectations are as off-beam now as they were when engaging in outsized stimulus in 2020-21.

Additional April monetary data confirm that the six-month change in global real narrow money moved deeper into negative territory and has now undershot a low reached in June 2008 as the financial crisis and associated recession escalated – see chart 1.

Chart 1

Chart 1 showing G7 + E7 Industrial Output & Real Narrow Money (% 6m)

The comparison with June 2008 is relevant in other respects. The two-year Treasury yield surged from 1.35% to 3.05% between March and June as the oil price spiked above $140 and markets priced in significant Fed tightening. The next move in the Fed funds rate, then 2.0%, was an October cut, by which time the two-year was back below 1.5%.

The fall in global real money momentum in late 2021 / early 2022 reflected rising inflation. Nominal money weakness has been the driver more recently.

With Canada yet to report, three-month growth of G7 broad money is estimated to have fallen to 1.9% annualised in April – chart 2. Annual expansion is likely to have moved down to around 5% in May, close to the pre-pandemic average, based on weekly US data and a sizeable base effect.

Chart 2

Chart 2 showing G7 Broad Money

Annual broad money growth peaked in February 2021, suggesting that a fall in CPI inflation will start in 2023-24 rather than later this year, assuming a typical lead time of about two years. An “optimistic” view is that the transmission mechanism has been accelerated by supply-side shocks, implying an earlier but higher inflation peak and a faster subsequent slowdown.

Recent news giving apparent support to the view that the global economy is displaying “resilience” includes May rises in new orders indices in the global PMI and US ISM manufacturing surveys. Both indices, however, are well down on three months earlier and the May recoveries were associated with further strength in stockbuilding – chart 3. A moderation of inventory accumulation – and likely eventual liquidation – will act as a major and sustained drag on order flow.

Chart 3

Chart 3 showing Global Manufacturing PMI Inventories Average of Finished Goods Inventories & Stocks of Purchases

US payrolls growth beat expectations in May but alternative ADP and household survey employment measures have slowed sharply over the latest three months – chart 4. Meanwhile, weaker labour market responses in the Conference Board consumer survey and a rise in involuntary part-time working suggest that a sideways move in the unemployment rate in May is the precursor to an upturn – chart 5.

Chart 4

Chart 4 showing US Private Jobs Measures (% 3m annualised)

Chart 5

Chart 5 showing US Unemployment Rate & Consumer Survey Labour Market Indicator / Involuntary Part-time Working

Recent UK monetary trends are consistent with a medium-term return of inflation to target, implying that the Bank of England should hold policy even though current inflationary pressures will be slow to fade and the consensus will claim that it is “behind the curve”.

The alternative would be to exacerbate a severe squeeze on real money balances that – on the view here – already guarantees a GDP recession.

Satisfactory inflation performance in the five years before the pandemic was a consequence of low and reasonably stable money growth. Three-month expansion of the preferred broad aggregate here, non-financial M4*, averaged 4.4% annualised, mostly fluctuating between 2% and 7% – see chart 1.

Chart 1

Chart 1 showing UK Narrow / Broad Money & Bank Lending (% 3m annualised)

The covid shock arguably warranted policy action to move money growth temporarily to the top of this range. Instead, the Bank’s grotesquely miscalibrated QE programme drove three-month growth to 31% annualised in May 2020. A subsequent sharp slowdown was followed by a rise to a second peak of 15% in January 2021 following an incomprehensible decision to extend QE in November 2020.

Three-month growth, however, has been back inside the pre-pandemic range since July last year – it was 4.2% annualised in April.

Monetary trends have yet to reflect fully recent policy tightening. The April-only numbers hint at further weakness: non-financial M4 rose by only 0.2% on the month, while non-financial M1 was flat.

The latest three-month increase of 4.2% annualised may overstate underlying growth because of retail investors switching out of mutual funds into bank and building society deposits in response to recent market losses. A broader savings measure including National Savings, foreign currency deposits and retail mutual funds grew by an estimated 2.9% annualised in the three months to April**.

A further rise in consumer price momentum, meanwhile, has intensified the squeeze on real money balances. Non-financial M4 and M1 fell by 3.4% and 3.3% (not annualised) respectively in the six months to April – chart 2.

Chart 2

Chart 2 showing UK GDP & Real Money (% 6m)

Although three-month money growth has been running at a target-consistent pace for several quarters, the usual “long and variable lag” suggests that a normalisation of inflation may be delayed until late 2023 or 2024.

Economists were last week debating whether Chancellor Sunak’s latest cost of living support package would add to inflationary pressures. The net cost of £10 billion equates to only 0.4% of non-financial M4, i.e. the package won’t shift the dial on monetary trends and, by extension, inflation prospects even if fully financed via the banking system (unlikely).

*M4 holdings of the household sector and private non-financial corporations.
 **This assumes zero net purchases of retail mutual funds in April, following net sales in February and March.

Incoming monetary data continue to give an ominous message for near-term global economic prospects while suggesting major inflation relief in 2023-24.

Fed numbers released on Tuesday confirm that the US broad money aggregate tracked here* fell month-on-month in April, resulting in the three-month change turning marginally negative. Weekly data on currency in circulation, commercial bank deposits and money funds suggest another decline in May.

Monthly growth in Eurozone broad money**, meanwhile, was today reported to have fallen to 0.1% in April, pulling three-month expansion down to 3.7% annualised – see chart 1.

Chart 1

Chart 1 showing Eurozone Narrow / Broad Money & Bank Lending (% 3m annualised)

Three-month growth rates of narrow and broad money are now below pre-pandemic averages (i.e. over 2015-19). The ECB should wait to see if money growth rebounds before hiking rates but appears to be set on hawkish autopilot, with potentially disastrous consequences.

Three-month growth of loans to households and non-financial corporations remains solid but is below its peak and expected here to slow further as demand for inventory financing falls off and higher mortgage rates curb housing credit.

The slower expansion of broad money than lending mainly reflects a fall in banks’ net external assets – the counterpart of a basic balance of payments deficit – and an increase in their capital reserves. The Ukraine conflict is likely to have boosted capital outflows while causing banks to become more risk-averse. ECB purchases of government securities remained substantial in the three months to April, at the equivalent of 0.7% of broad money, or 2.7% at an annualised rate. Further monetary weakness is likely as this support ends.

The slump in US and Eurozone nominal money growth implies a severe squeeze on real money balances, given current high inflation – consumer prices rose by 9.9% and 10.9% annualised respectively in the three months to April.

The current six-month rate of contraction of Eurozone real narrow money was exceeded only in 1973-74 and the early 1980s. Smaller declines in 1991, 2007 and 2011 also foreshadowed recessions – chart 2. There is stiff competition for the prize of worst recent official forecast but the March ECB staff projection that Eurozone GDP would grow by 4% annualised in Q2 / Q3 is a strong contender.

Chart 2

Chart 2 showing Eurozone GDP & Real Narrow Money* (% 6m) *Non-Financial M1 from 2003, M1 before

*”M2+” = M2 + large time deposits at commercial banks + institutional money funds
**Non-financial M3

US broad money growth has slowed significantly despite a strong pick-up in bank lending expansion. How has this occurred and does lending strength portend a rebound in money growth?

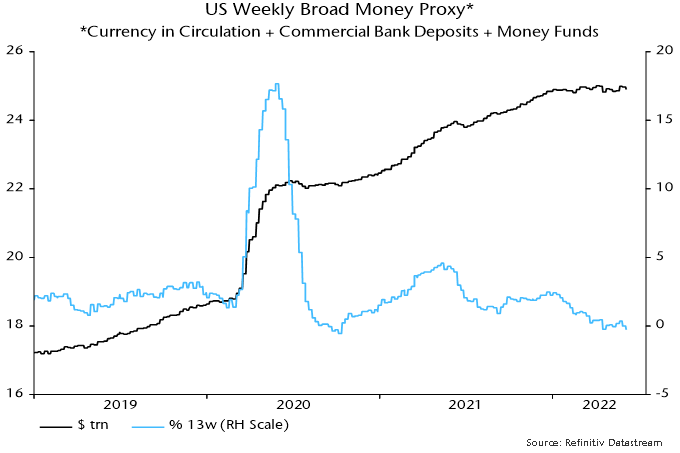
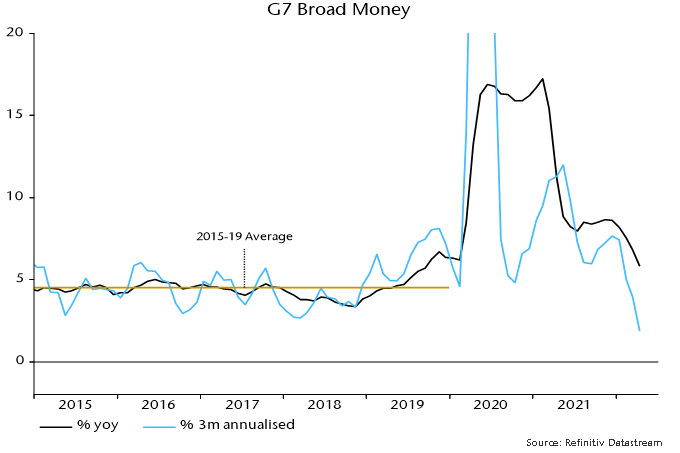
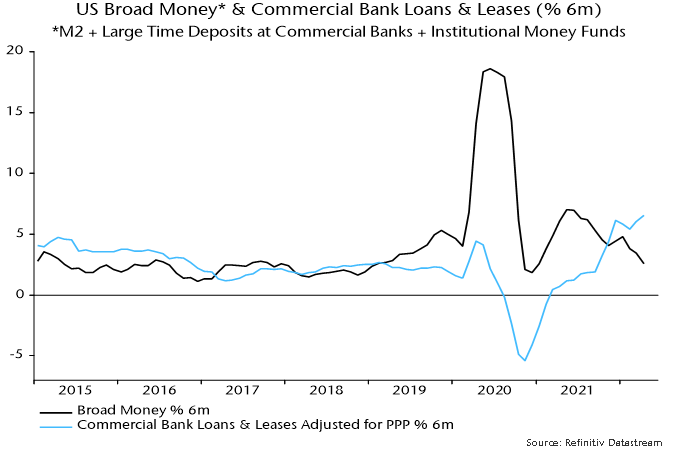
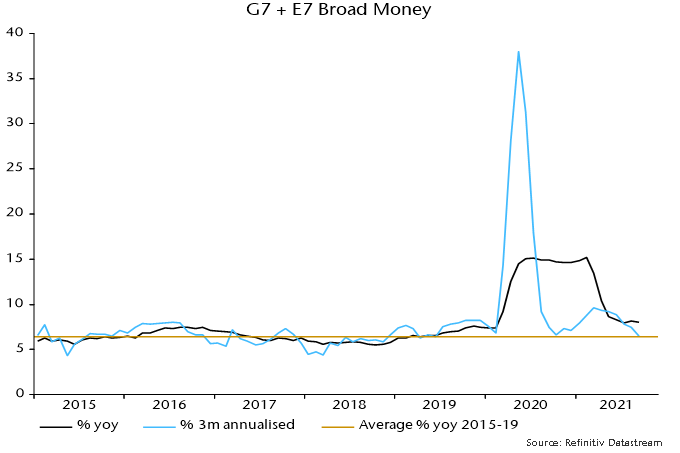
The broad money aggregate calculated here* rose by 2.6% (5.2% annualised) in the six months to April, down from 4.5% (9.2%) in the prior six months – see chart 1. All the growth over the last six months occurred over November-January: the aggregate has flatlined over the last three months.

Chart 1

Chart 1 showing US Broad Money* & Commercial Bank Loans & Leases (% 6m) *M2 + Large Time Deposits at Commercial Banks + Institutional Money Funds

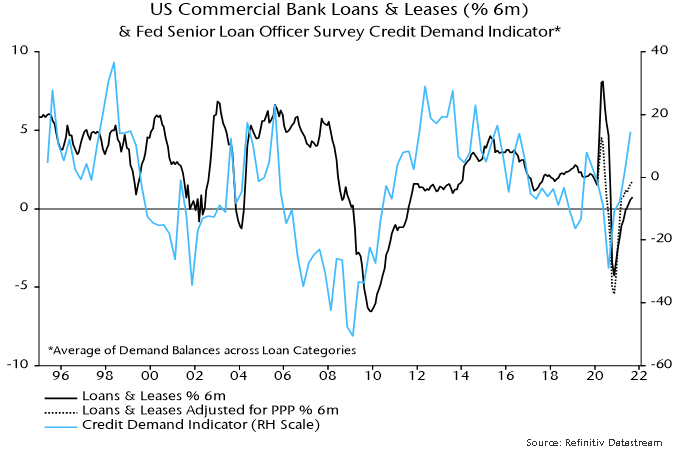
The monetary slowdown contrasts with further strength in bank lending. Commercial bank loans and leases, adjusted for Payment Protection Program forgiveness, grew by 6.5% (13.5% annualised) in the six months to April, up from 3.3% (6.6%) in the previous six months.
 
Q. What happened to the additional deposit money created by the expansion of banks’ loan books?

A. It was mostly diverted into the coffers of the US Treasury.

Political wrangling over raising the debt ceiling resulted in the Treasury running down its cash balance at the Fed from over $800 billion in mid-2021 to below $100 billion by December. This monetary injection boosted broad money growth late last year.

Since the ceiling was raised in December, the Treasury has “overfunded” the federal deficit to replenish its cash balance, which currently stands at over $900 billion.

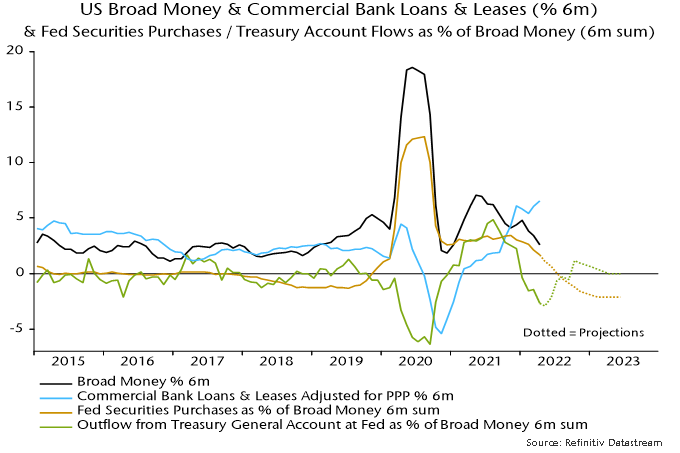
The monetary inflow to the Treasury amounted to 2.7% of broad money in the six months to April – chart 2.

Chart 2

Chart 2 showing US Broad Money & Commercial Bank Loans & Leases (% 6m) & Fed Securities Purchases / Treasury Account Flows as % of Broad Money (6m sum)

The monetary slowdown has also reflected – to a lesser extent – the wind-down of QE: securities purchases by the Fed were 1.7% of broad money in the six months to April, down from 3.4% in the prior six months.

Adding together the effects of QE and changes in the Treasury’s cash balance, there was a net monetary withdrawal of 1.0% of broad money in the six months to April, following an injection of 6.2% in the previous six months. This reversal more than offset the monetary impact of stronger bank lending expansion.

What happens next?

The Treasury’s latest financing projections assume a cash balance of $650 billion at end-September, representing a fall of about $310 billion from its level at end-April.

The Fed, meanwhile, plans to reduce its securities holdings at a monthly pace of $47.5 billion starting in June rising to $95 billion in September. This suggests cumulative QT of about $330 billion over the six months to October.

In combination, QT and changes in the Treasury’s cash balance may, therefore, result in a net monetary withdrawal of only about $20 billion, or 0.1% of broad money, in the six months to October, down from $280 billion or 1.0% in the six months to April.

In terms of the combined influence of the Treasury and Fed, QT effectively started in January and is about to slow temporarily before stepping up later in the year – assuming no further change in the Treasury’s cash balance beyond the expected fall to $650 billion and an ongoing $95 billion per month reduction in the Fed’s securities holdings.

Will a temporarily reduced “public sector” drag allow broad money growth to recover into H2?

The forecast here is that this small positive will be outweighed by a slowdown in bank lending. Corporate credit demand has been boosted by inventory financing but the stockbuilding cycle is now entering a downswing. Higher mortgage rates will cool demand for real estate loans, while banks may rein back on consumer lending as economic prospects deteriorate.

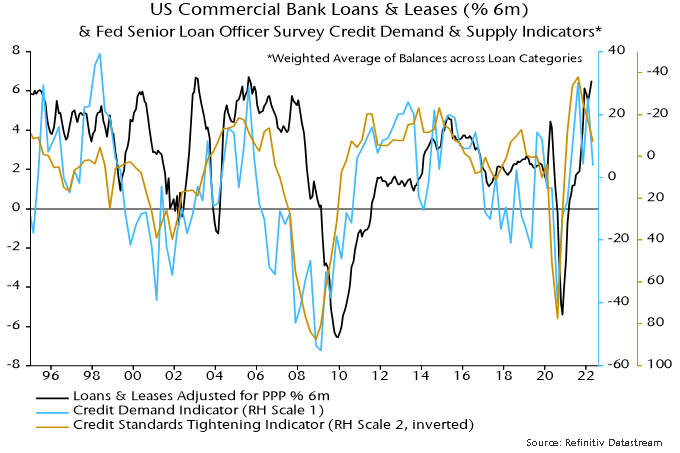
The suggestion of a lending slowdown is supported by the April Fed senior loan officer survey: the aggregate credit demand indicator fell sharply while the net percentage of banks tightening loan standards rose for a third successive quarter – chart 3.

Chart 3

Chart 3 showing US Commercial Bank Loans & Leases (% 6m) & Fed Senior Loan Officer Survey Credit Demand & Supply Indicators* *Weighted Average of Balances across Loan Categories

*”M2+” = M2 + large time deposits at commercial banks + institutional money funds. M2 = currency + demand deposits + other liquid deposits + small time deposits + retail money funds. April estimated.

Global* six-month real narrow money momentum turned negative in March and is estimated to have fallen slightly further in April, based on monetary and CPI data covering two-thirds and 90% of the aggregate respectively – see chart 1.

Chart 1

Chart 1 showing Global Manufacturing PMI New Orders & G7 + E7 Real Narrow Money (% 6m)

Current weakness is more pronounced than before the 2001 recession and almost on a par with early 2008 before the escalation of the financial crisis.

The leading relationship with the global manufacturing PMI new orders index suggests a sizeable further decline in the latter with no recovery before Q4. A move below 45 would confirm a recession.

The further fall in real narrow money momentum in April reflected another rise in global six-month CPI inflation, with small CPI slowdowns in the US and Eurozone more than offset by pick-ups in China, Japan (Tokyo data) and the UK (estimated), among others – chart 2.

Chart 2

Chart 2 showing G7 + E7 Narrow Money & Consumer Prices (% 6m)

Six-month nominal narrow money growth has been moving sideways since December. With CPI inflation probably peaking, real money momentum could be bottoming. Any recovery, however, could be limited by a renewed nominal money slowdown as central bank policy tightening proceeds.

*G7 plus E7. E7 defined here as BRIC plus Korea, Mexico and Taiwan.

Additional monetary data confirm an earlier estimate here that global (i.e. G7 plus E7) six-month real narrow money growth fell slightly further in September, reaching its lowest level since August 2019 – chart 1. Allowing for the usual lead, the suggestion is that global industrial demand momentum – proxied by the manufacturing PMI new orders index – will weaken into end-Q1 2022 and possibly beyond.

Chart 1

Real narrow money is growing at a similar pace in the US, Japan, Eurozone and UK, i.e. there is no longer a monetary case for expecting superior US economic and asset price performance – chart 2.

Chart 2

Real narrow money growth remains relatively strong in Canada (one month behind), Australia and Sweden. Economic and / or inflation data have been surprising positively in all three cases, triggering policy shifts by the BoC and RBA – will the currently dovish Riksbank be next to capitulate?

Real money growth remains lower in the E7 than the G7, partly reflecting drags from Russia and Brazil, where monetary policies may have been tightened excessively – charts 3 and 4.

Chart 3

Chart 4

Money trends are perkier in EM Far East economies. Real narrow money growth remains relatively strong in Korea / Taiwan and has ticked up recently, while there have been notable rebounds in Indonesia, the Philippines and Thailand, partly reflecting reopenings – chart 5.

Chart 5

Will China be next? The worry has been that Evergrande fallout would lead to a tightening of credit conditions, aborting an incipient recovery in money growth due to modest policy easing since Q2. The October Cheung Kong business survey was hopeful in this regard: the corporate financing index (a gauge of ease of access to external funds) fell slightly but remains at a normal level – chart 6.

Chart 6

Monetarists have a straightforward response to the ongoing debate about whether global inflation is shifting to a permanently higher level: it won’t if global broad money growth reverts to its pre-covid norm.

While annual growth remains elevated, G7 plus E7 nominal broad money expanded at a 6.5% annualised rate in the three months to September, in line with the 2015-19 average – chart 7. Central banks won’t need to raise interest rates by much to contain inflation if this pace is sustained.

Chart 7

Money growth has slowed despite ongoing QE, suggesting a risk of an undershoot as these programmes wind down. The more likely scenario, however, is that a pick-up in bank lending provides offsetting support.

US commercial bank loan growth continues to firm, with the recovery underappreciated because of the distorting effect on headline data of PPP loan forgiveness – chart 8. The July Fed senior loan officer survey had signalled stronger credit demand; an October survey is due shortly.

Chart 8

The corresponding ECB survey has already been released and showed a pull-back in credit demand indicators, although they remain in hopeful territory – chart 9. Actual loan growth, however, has remained modest / stable.

Chart 9