The analytical approach used here is giving mixed messages for 2026 prospects. Global monetary trends appear modestly supportive of economic growth and markets, but the stockbuilding cycle remains on course to enter a downswing this year, with the housing cycle also in a time window for weakness.

Further considerations are likely suppression of labour demand from AI deployment and the unusual magnitude of gains in risk asset prices during the upswing phase of the current stockbuilding cycle.

The judgement here is to give greater weight to cyclical influences and plan for a negative shift in the investment environment during 2026, with caution to be reinforced in the event of deterioration in monetary indicators and / or data confirmation that a stockbuilding downswing is under way.

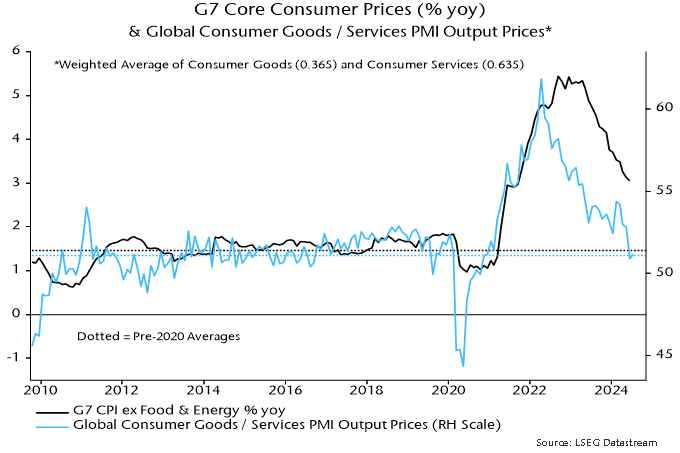
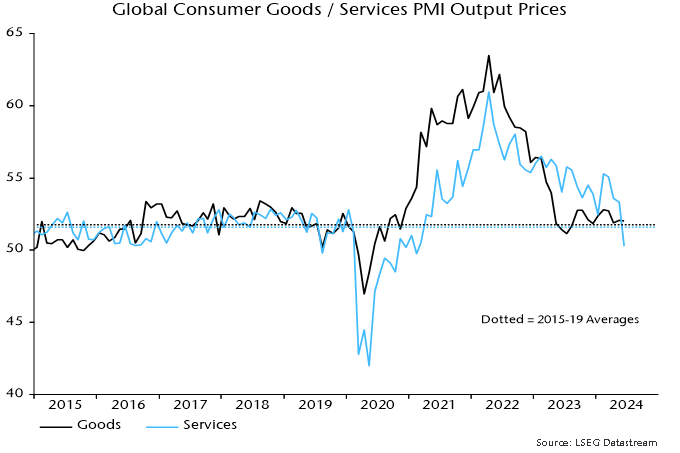
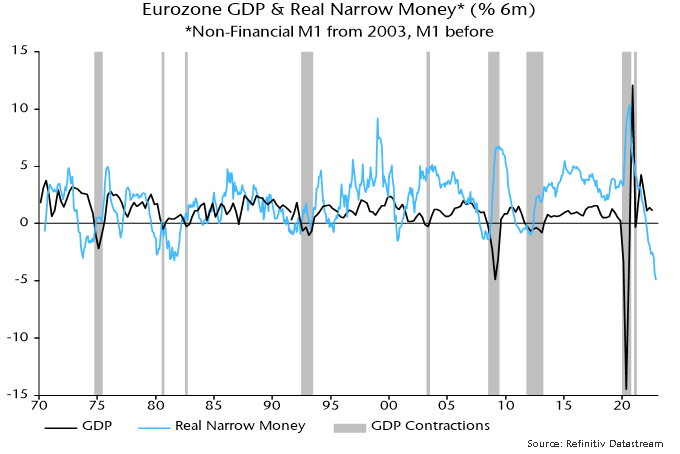
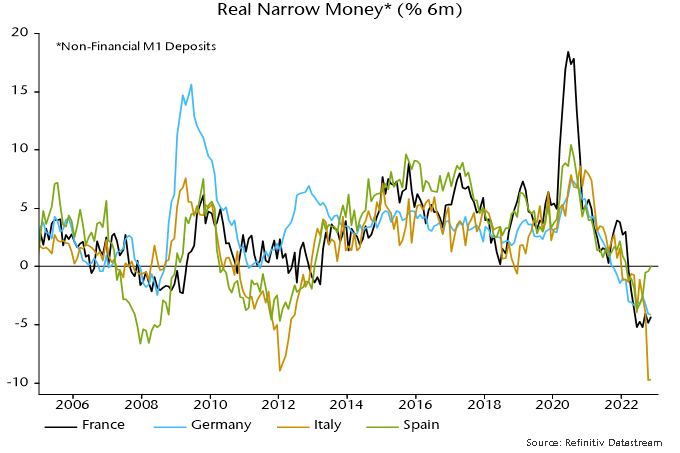
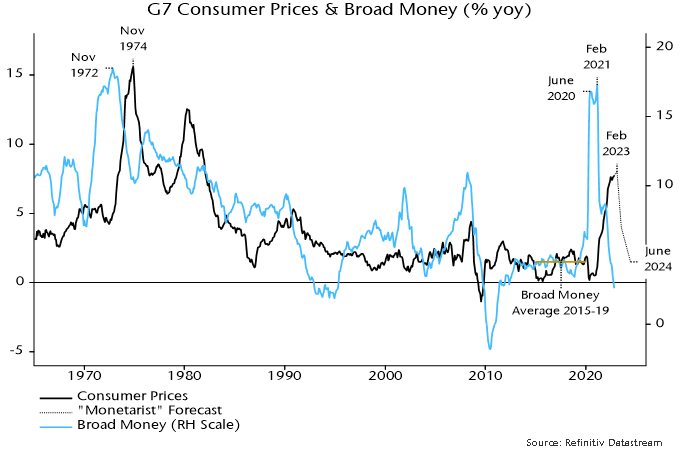
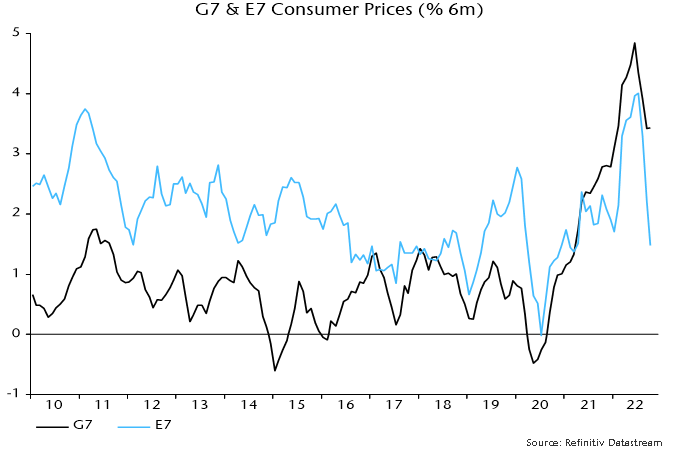
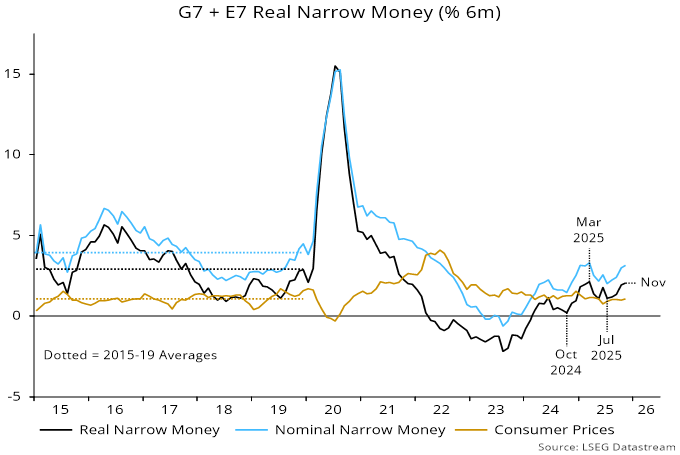
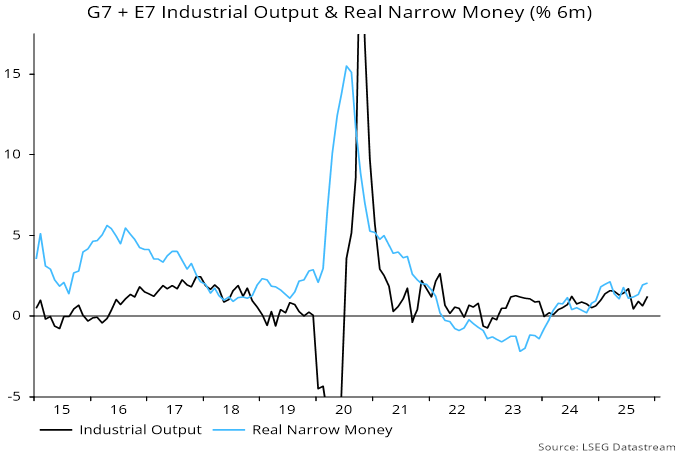
Global six-month real narrow money momentum – the key monetary leading indicator employed here – fell between March and July 2025 but recovered into November. The decline and rebound were driven by nominal money trends, with global CPI momentum stable at around its pre-pandemic pace (vindicating the monetarist forecast of full retracement of the 2021-22 inflation spike) – see chart 1.

Chart 1

Chart 1 showing G7 + E7 Real Narrow Money (% 6m)

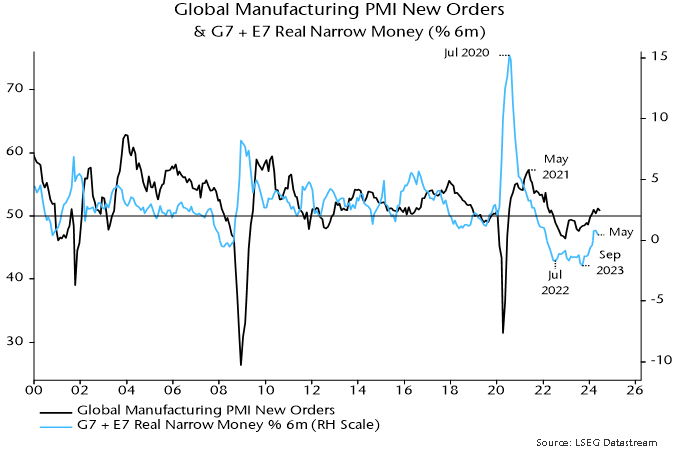
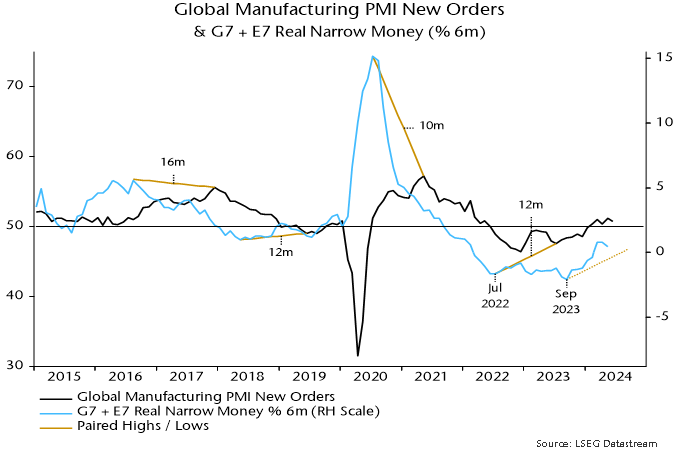
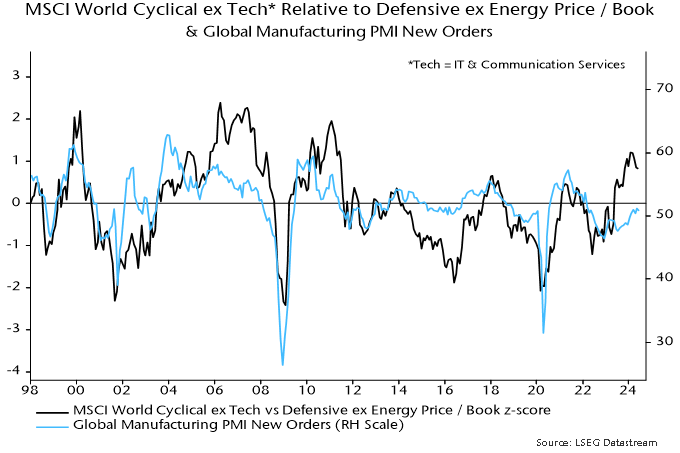
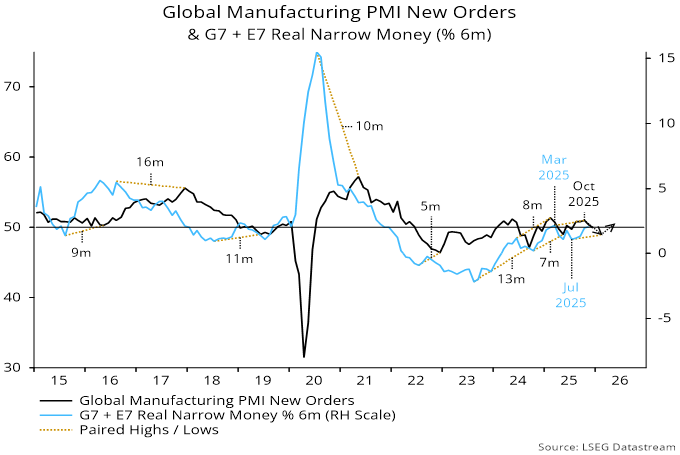
The earlier fall in real money momentum has been reflected in a decline in global manufacturing PMI new orders – a timely indicator of economic momentum – from an October peak. Based on recent lead times, however, the monetary rebound suggests that the PMI will bottom out in early 2026, with a recovery into mid-year – chart 2.

Chart 2

Chart 2 showing Global Manufacturing PMI New Orders & G7 + E7 Real Narrow Money (% 6m)

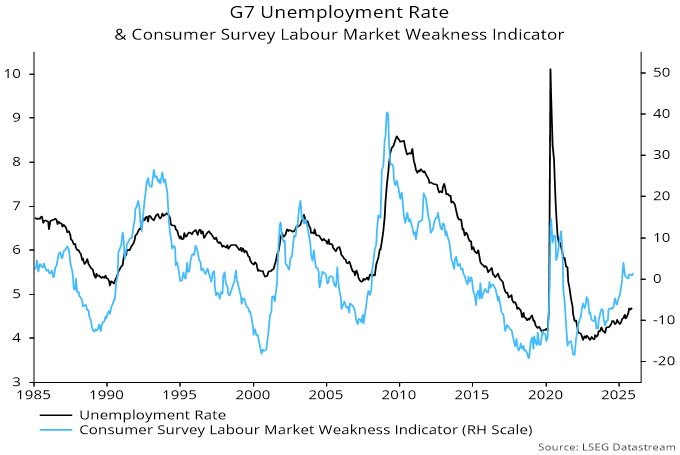
While global growth may hold up in H1, it may not be strong enough to prevent a further rise in unemployment rates, partly reflecting AI job displacement – chart 3.

Chart 3

Chart 3 showing G7 Unemployment Rate & Consumer Survey Labour Market Weakness Indicator

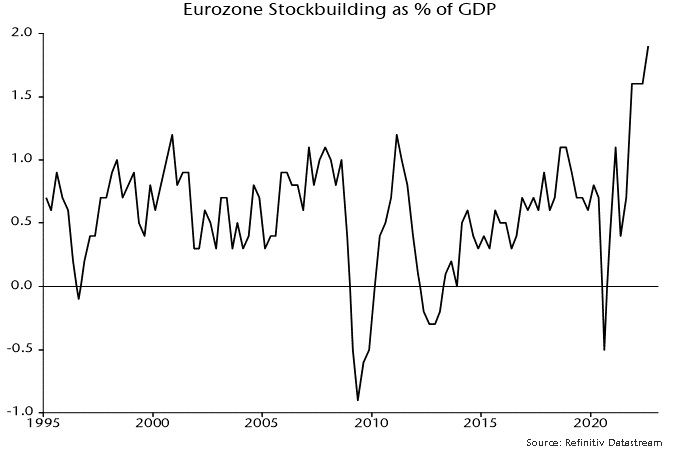
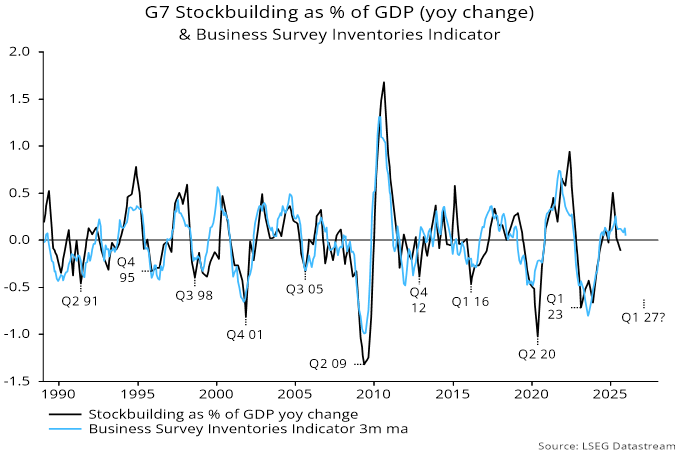
Meanwhile, the stockbuilding cycle – averaging 3.5 years in length historically – remains on course to enter a downswing in 2026, with a possible low in H1 2027. The focus here is on the survey-based indicator shown in chart 4, which has been moving sideways at a level consistent with a cycle peak – a decline into negative territory would confirm a phase shift.

Chart 4

Chart 4 showing G7 Stockbuilding as % of GDP (yoy change) & Business Survey Inventories Indicator

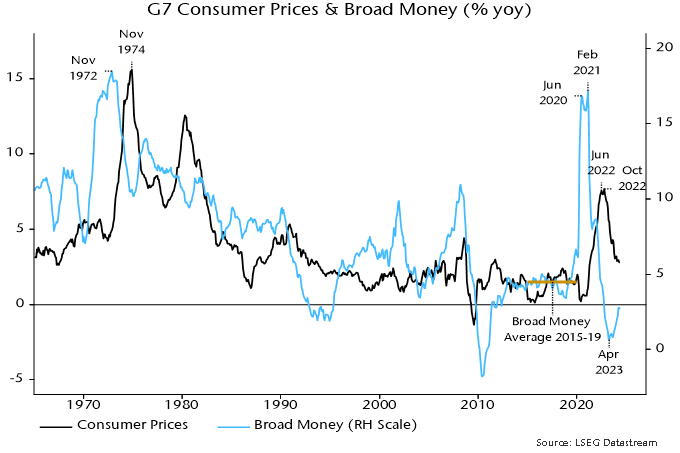
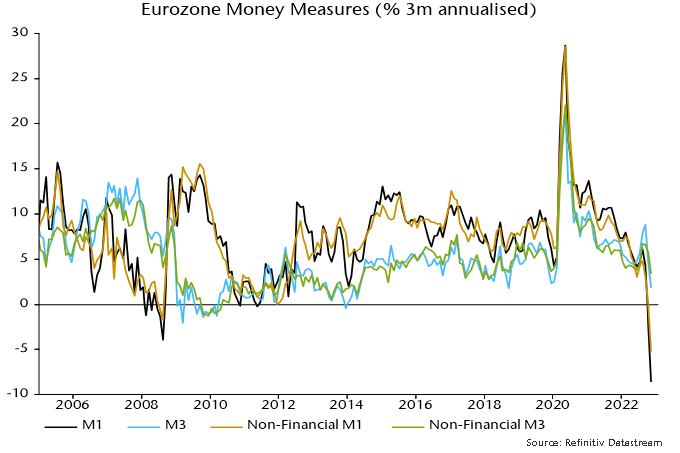
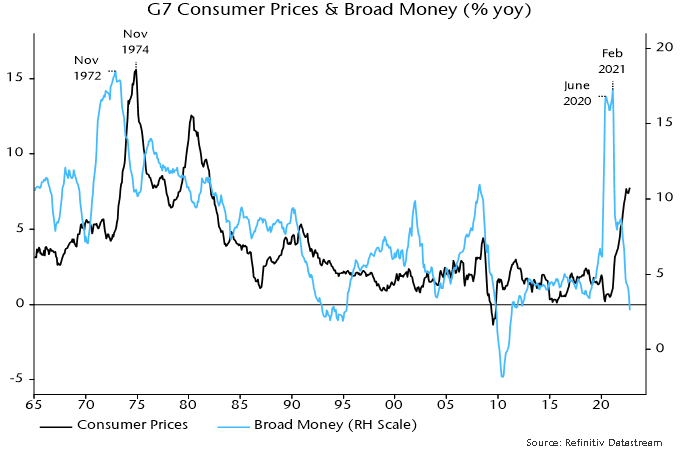
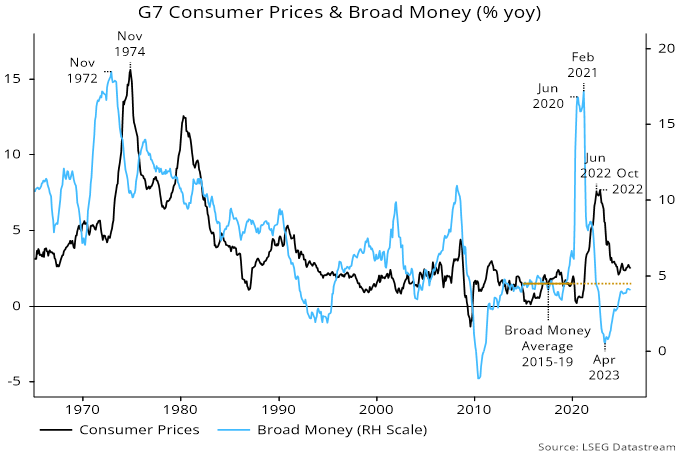
Global inflation is expected to be little changed in 2026, with downside risk judged greater than upside. A key consideration is that G7 annual broad money growth, while recovering further over the past year, remains below its pre-pandemic average – chart 5.

Chart 5

Chart 5 showing G7 Consumer Prices & Broad Money (% yoy)

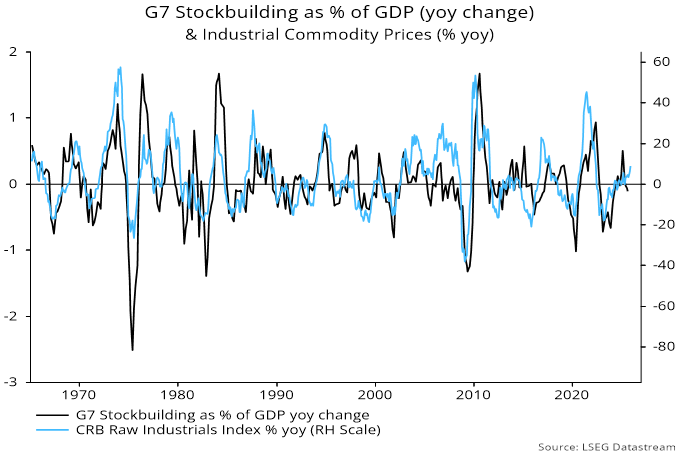
A downside surprise could arise from AI job displacement depressing wage growth. One upside risk is a near-term burst of commodity price strength before the stockbuilding cycle moves into a downswing. Industrial commodity prices rose by less than usual earlier in the upswing and a catch-up could be in progress – chart 6.

Chart 6

Chart 6 showing G7 Stockbuilding as % of GDP (yoy change) & Industrial Commodity Prices (% yoy)

The expected transition in the stockbuilding cycle coincides with the housing cycle – averaging 18 years, with a previous trough in 2009 – being in a time window for weakness. G7 housing investment moved sideways between 2023 and H1 2025 but fell to a new low in Q3 – chart 7.

Chart 7

Chart 7 showing G7 Housing Investment (Q1 1970 = 100)

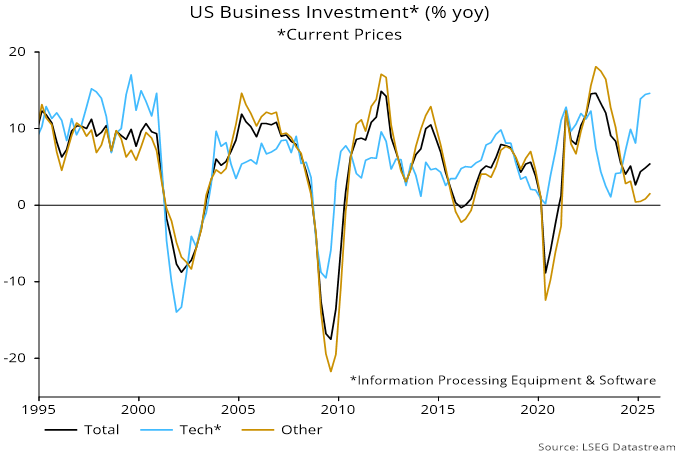
Cyclical hopes rest on further strength in business investment, which follows an average 9-year cycle, with a previous low in 2020. While tech capex is booming, however, it accounts for only one-third of US business investment (and less than 5% of GDP), with other segments weak – chart 8.

Chart 8

Chart 8 showing US Business Investment* (% yoy) *Current Prices

The dispersion of real narrow money momentum across countries has narrowed – chart 9. Adjusted for a recent apparent data distortion, US momentum remains slightly below the Eurozone level. Japan is still a negative outlier but the UK has returned to mid-range. Strength in Australia / Canada suggests upside economic and rates risk, with an opposite message from a Swedish move into contraction.

Chart 9

Chart 9 showing Real Narrow Money (% 6m)

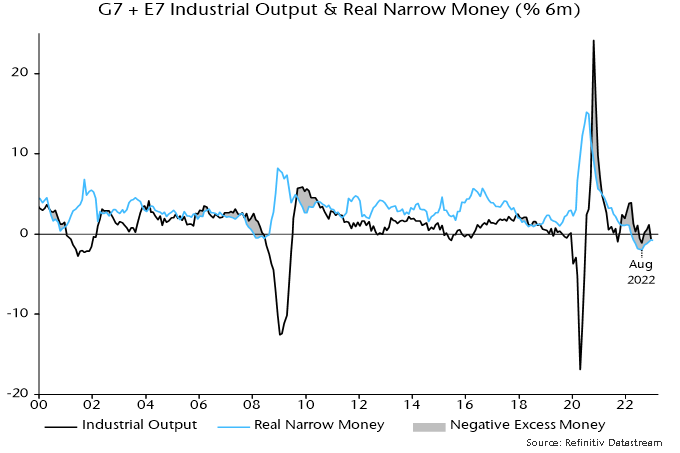
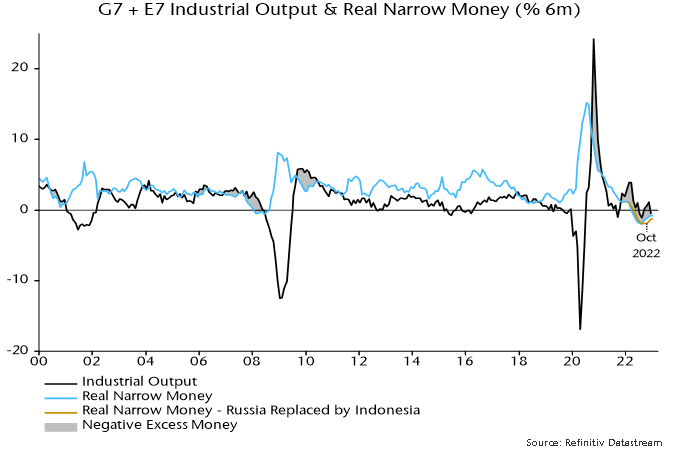
Global real narrow money momentum remains below its long-run average but is nevertheless above weak industrial output momentum, suggesting “excess” money support for markets – chart 10.

Chart 10

Chart 10 showing G7 + E7 Industrial Output & Real Narrow Money (% 6m)

Against this, risk assets have usually corrected – or worse – in the 18 months leading up to stockbuilding cycle troughs, with another such window now open on the analysis here. Table 1 compares moves in selected asset prices in the current cycle with averages across the previous nine cycles, with the mean maximum rise from the beginning of the cycle in column 1 and the subsequent fall into the cycle trough in column 2.

Table 1

Table 1 compares moves in selected asset prices in the current cycle with averages across the previous nine cycles, with the mean maximum rise from the beginning of the cycle in column 1 and the subsequent fall into the cycle trough in column 2.

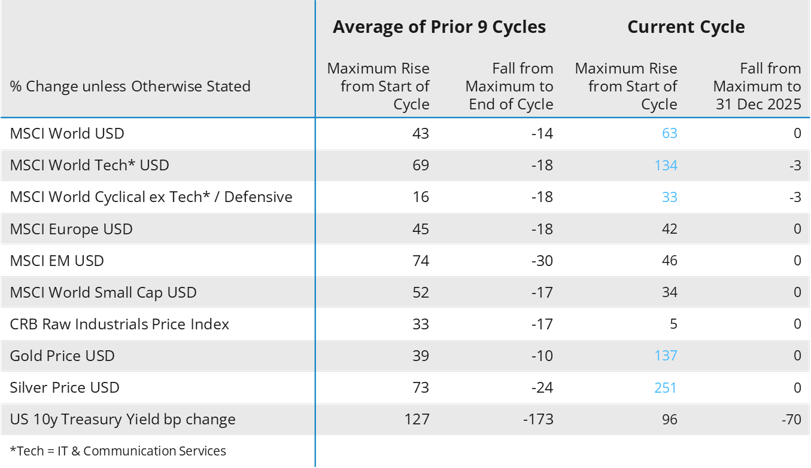
Global / US equities, tech and other cyclical sectors, and precious metals have significantly outperformed their average gains in the current cycle, suggesting larger-than-normal reversals into the cycle trough. By contrast, European equities, EM, small caps and industrial commodity prices are lagging their respective averages, so may have more upside potential while a positive environment persists and / or prove more resilient in a subsequent risk-off phase.

A fall in the US dollar boosted risk appetite in 2025. The timing of the decline echoes the last three housing cycles, in which the dollar trended lower from an overvalued level in the years preceding and beyond the cycle trough – chart 11.

Chart 11

Chart 11 showing Real US Dollar Index vs Advanced Foreign Economies Based on Consumer Prices, January 2006 = 100, Source: Federal Reserve / BIS

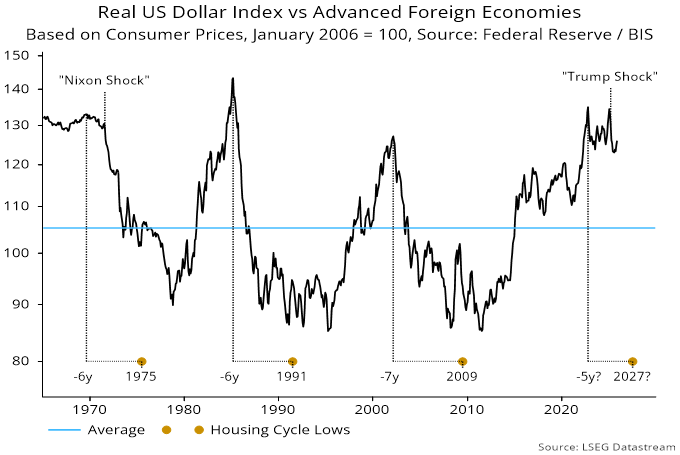
US currency weakness could become market-negative if a decline becomes disorderly, resulting in upward pressure on longer-term rates, for example in the event of further fiscal profligacy or unwarranted additional rate cuts by a politically controlled Fed. Alternatively, a negative market shift could be triggered by a temporary dollar rebound, if US economic news surprises positively and the Fed remains orthodox. Dollar sentiment and positioning were contrarian-bearish at the start of 2025 but current signals are neutral / positive.

The most important issue in the global economic outlook is the meaning of Chinese monetary weakness.

Six-month rates of change of narrow / broad money, bank lending and total social financing (on both new and old definitions*) reached record lows in June / July – see chart 1.

Chart 1

Chart 1 showing China Nominal GDP and Money/Social Financing (% 6months)

Monetary weakness has been entirely focused on the corporate sector: M2 deposits of non-financial enterprises plunged 6.6% (13.6% annualised) in the six months to July (own seasonal adjustment) – chart 2.

Chart 2

Chart 2 showing China M2ex Breakdown (% 6 months)

Recent regulatory changes appear to account for only a small portion of the corporate broad money decline.

A clampdown on banks paying interest above regulatory ceilings has resulted in a shift out of demand deposits but money has largely stayed in the banking system – available data suggest modest inflows to wealth management products and other non-monetary assets.

The clampdown has also discouraged the practice of “fund idling” (round-tripping in UK monetary parlance), whereby banks offered loans to corporate borrowers to meet official lending targets, with borrowers incentivised to hold the funds on deposit.

If an unwinding of such activity accounted for the decline in corporate money, however, short-term bank lending to corporations would be expected to show equivalent weakness. Such lending has continued to grow, albeit at a slower pace recently, as have longer-term loans.

A trend decline in the ratio of corporate M2 deposits to bank borrowing, therefore, has accelerated – chart 3.

Chart 3

Chart 3 showing China Corporate Liquidity Ratio

Household money holdings, by contrast, have been growing solidly – chart 2. An alternative explanation for the corporate money decline is simply that households are still hunkering down as the property crisis deepens, with weakening demand for consumer goods / services and housing transferring income and liquidity from the corporate sector.

The latest PBoC and NBS consumer surveys confirm rock-bottom sentiment – chart 4. If this explanation is correct, corporate money weakness may presage a collapse in profits – chart 5.

Chart 4

Chart 4 showing China Consumer Confidence Measures

Chart 5

Chart 5 showing China INdustrial Profits and M2 Deposits Non-Financial Enterprises (% year over year)

Why hasn’t the PBoC hit the panic button? Policy easing has been constrained by currency weakness: the most comprehensive measure of f/x intervention (h/t Brad Setser) reached $58 billion in July, the highest since 2016 – chart 6. The recent yen rally has offered some relief, reflected in a narrower offshore forward discount, but the authorities may be concerned that this will prove temporary.

Chart 6

Chart 6 showing China Net F/x Settlement Banks Adjusted Forwards ($ billions) and Forward Premium/Discount on Offshore RMB (%)

The strange policy of trying to push longer-term yields higher against a recessionary / deflationary backdrop may represent an attempt to support the currency, rather than being motivated primarily by concern about financial risks. To the extent that the policy results in banks selling bonds, however, the result will be to exacerbate monetary weakness and economic woes.

*The previous definition excludes government bonds so is a measure of credit expansion to the “real economy”.

A sharp fall in the global manufacturing PMI new orders index in July confirms renewed industrial weakness. The companion services survey, however, reported an uptick in the new business component, which is close to its post-GFC average. Will services resilience sustain respectable overall growth?

The understanding here is that economic fluctuations originate in the goods sector, reflecting cycles in three components of investment – stockbuilding, business fixed capex and housing. Multiplier effects transmit these fluctuations to the services sector – there is no independent services cycle.

The manufacturing new orders and services new business indices have been strongly correlated historically, with Granger-causality tests indicating that the former leads the latter but not vice versa*.

Several considerations suggest that the recent divergence will be resolved by the services new business index moving lower:

1. The services future output index correlates with new business and fell to an eight-month low in July – see chart 1.

Chart 1

Chart 1 showing Global Services PMI New Business Future Output

2. Recent new business readings have been inflated by strength in financial services – chart 2. Financial services new business correlates with stock market movements, suggesting weakness ahead.

Chart 2

Chart 2 showing Global Services PMI New Business

3. Consumer services new business correlates with the manufacturing consumer goods new orders index, which fell below 50 in July – chart 3.

Chart 3

Chart 3 showing Global Consumer Goods/Services PMI New Orders/Business

Output price indices for consumer goods and services support the optimism here about inflation prospects through mid-2025. A weighted average has fallen back to its October 2009-December 2019 average, a period in which G7 annual CPI inflation excluding food / energy averaged 1.5% – chart 4.

Chart 4

Chart 4 showing Global Consumer Prices and Global Consumer Goods/Services PMI Output Prices

*Contemporaneous correlation coefficient since 1998 = +0.84. Granger-causality tests included six lags. Manufacturing terms were significant in the services equation but not vice versa.

Monetary analysis suggests that the global economy will weaken into early 2025, while inflation will continue to decline. A cyclical forecasting framework, on the other hand, points to the possibility of strong economic growth in H2 2025 and 2026.

Are the two perspectives inconsistent? A reconciliation could involve downside economic and inflation surprises in H2 2024 triggering a dramatic escalation of monetary policy easing. A subsequent pick-up in money growth would lay the foundation for a H2 2025 / 2026 economic boom.

How would equities perform in this scenario? Bulls would argue that any near-term weakness due to negative economic news would be swiftly reversed as policies eased and markets shifted focus to the sunlit uplands of H2 2025 / 2026.

More likely, a significant fall in risk asset prices would be necessary to generate easing of the required speed and scale, and a subsequent recovery might take time to gather pace.

Global six-month real narrow money momentum has recovered from a major low in September 2023 but remains weak by historical standards and fell back in May – see chart 1. The assessment here is that the decline into the 2023 low will be reflected in a weakening of global economic momentum in H2 2024.

Chart 1

Chart 1 showing Global Manufacturing PMI New Orders and G7 plus E7 Real Narrow Money

A counter-argument is that a typical lead-time between lows in real money and economic momentum historically has been six to 12 months. On this basis, negative fall-out from the September 2023 real money momentum low should be reaching a maximum now, with the subsequent recovery to be reflected in economic acceleration in late 2024.

The latter interpretation is consistent with the consensus view that a sustainable economic upswing is under way and will gather pace as inflation progress allows gradual monetary policy easing.

The pessimistic view here reflects three main considerations. First, economic acceleration now would imply an absence of any negative counterpart to the September 2023 real money momentum low – historically very unusual.

Secondly, the lag between money and the economy has recently been at the top end of the historical range, suggesting that a significant portion of 2023 monetary weakness has yet to feed through.

Highs in real money momentum in August 2016 and July 2020 preceded highs in global manufacturing PMI new orders by 16 and 10 months respectively, while a low in May 2018 occurred a year before a corresponding PMI trough – chart 2.

Chart 2

Chart 2 showing Global Manufacturing PMI New Orders and G7 plus E7 Real Narrow Money

So a PMI low associated with the September 2023 real money momentum trough could occur as late as January 2025.

Thirdly, stock as well as flow considerations have been important for analysing the impact of money on the economy in recent years, and a current shortfall of real narrow money from its pre-pandemic trend may counteract a positive influence from the (tepid) recovery in momentum since September 2023 – chart 3.

Chart 3

Chart 3 showing Ratio of G7 and E7 Real Narrow Money to Industrial Output and 1995 to 2019 Log-Linear Trend

The decline in real money momentum into the September 2023 low began from a minor peak in December 2022, suggesting that the PMI – even allowing for a longer-than-normal lag – should have peaked by early 2024. Global manufacturing PMI new orders rose into March and made a marginal new high in May. However, two indicators displaying a significant contemporaneous correlation with PMI new orders historically – PMI future output and US ISM new orders – peaked in January. The future output series fell sharply in June, consistent with the view that another PMI downturn is starting – chart 4.

Chart 4

Chart 4 showing Global Manufacturing PMI New Orders and Global Manufacturing PMI Future Output / US ISM Manufacturing New Orders

Signs of weakness are also apparent under the hood of the services PMI survey. Overall new business has been boosted by financial sector strength, reflecting buoyant markets, but the consumer services component fell to a six-month low in June – chart 5.

Chart 5

Chart 5 showing Global Services PMI New Business

Could a weakening of economic momentum in H2 2024 snowball into a deep / prolonged recession? The cycles element of the forecasting process used here suggests not.

Severe / sustained recessions occur when the three investment cycles – stockbuilding, business capex and housing – move into lows simultaneously. The most recent troughs in the three cycles are judged to have occurred in Q1 2023, 2020 and 2009 respectively. Allowing for their usual lengths (3-5, 7-11 and 15-25 years), the next feasible window for simultaneous lows is 2027-28 – chart 6. Cycle influences should be positive until then.

Chart 6

Chart 6 showing Actual and Possible Cycle Trough Years

Major busts associated with triple-cycle lows, indeed, are usually preceded by economic booms. Such booms often involve policy shifts that super-charge positive cyclical forces. The 1987 stock market crash, for example, triggered rate cuts by the Fed and other central banks that magnified a late 1980s housing cycle peak.

Could significant policy easing in H2 2024 / H1 2025 similarly catalyse a H2 2025 / 2026 boom? Such a policy shift, on the view here, is plausible because negative economic news into early 2025 is likely to be accompanied a melting of inflation concerns.

The latter suggestion is based on the monetarist rule-of-thumb that inflation follows money trends with a roughly two-year lag. G7 broad money growth of about 4.5% pa is consistent with 2% inflation. Annual growth returned to this level in mid-2022, reflected in a forecast here that inflation rates would move back to target in H2 2024 – chart 7.

Chart 7

Chart 7 showing G7 Consumer Prices and Broad Money

The forecast is within reach. Annual US PCE and Eurozone CPI inflation rates were 2.5% in May and June respectively, with a fall to 2% in prospect by end-Q3 on reasonable assumptions for monthly index changes. UK CPI inflation has already dropped to 2.0%.

G7 annual broad money growth continued to decline into 2023, reaching a low of 0.6% in April 2023 and recovering gradually to 2.7% in May 2024. The suggestion from the monetarist rule, therefore, is that inflation rates will move below target in H1 2025 and remain low into 2026.

Central banks have been focusing on stickier services inflation, neglecting historical evidence that services prices lag both food / energy costs and core goods prices. Those relationships, and easing wage pressures, suggest that services resilience is about to crumble, a possibility supported by a sharp drop in the global consumer services PMI output price index in June to below its pre-pandemic average – chart 8.

Chart 8

Chart 8 showing Global Consumer Goods / Services PMI Output Prices

The approach here uses two flow measures of global “excess” money to assess the monetary backdrop for equity markets: the gap between global six-month real narrow money and industrial output momentum, and the deviation of annual real money growth from a long-term moving average.

The two measures turned negative around end-2021, ahead of 2022 market weakness, but remained sub-zero as global indices rallied to new highs in H1 2024. The latter “miss” may be attributable to a money stock overshoot shown in chart 3 – the flow measures of excess money may have failed to capture the deployment of existing precautionary money holdings.

Still, the MSCI World index in US dollars outperformed dollar deposits by only 3.9% between end-2021 and end-June 2024, with the gain dependent on a small number of US mega-caps: the equal-weighted version of the index underperformed deposits by 8.4% over the same period.

What now? The money stock overshoot has reversed. The first excess money measure has recovered to zero but the second remains significantly negative. Mixed readings have been associated with equities underperforming deposits on average historically, with some examples of significant losses. Caution still appears warranted.

An obvious suggestion based on the economic scenario described above is to overweight defensive sectors. Non-tech cyclical sectors gave back some of their outperformance in Q2 but are still relatively expensive by historical standards, apparently discounting PMI strength – chart 9.

Chart 9

Chart 9 showing MSCI World Cyclical ex Tech* Relative to Devensive ex Energy Price/Book and Global Manufacturing PMI New Orders

Accelerated monetary policy easing could be favourable for EM equities, especially if associated with a weaker US dollar. Monetary indicators are promising. EM equities have outperformed historically when real narrow money growth has been higher in the E7 than the G7 and the first global excess money measure has been positive – chart 10. The former condition remains in place and the second is borderline.

Chart 10

Chart 10 showing MSCI EM Cumulative Return vs MSCI World and "Excess" Money Measures

Image of office skyscrapers with reflections in the sunlight

Connor, Clark & Lunn Funds Inc. (CC&L Funds) is excited to announce two absolute-return oriented portfolios in liquid alternative fund form, CC&L Global Market Neutral II Fund and CC&L Global Long Short Fund (the Funds).

CC&L Global Market Neutral II Fund seeks to earn a positive and attractive risk-adjusted return over the long term while demonstrating low correlation with, and lower volatility than, traditional equity markets. Risk rating: Low to Medium.

CC&L Global Long Short Fund seeks to provide long-term capital appreciation and attractive risk-adjusted returns by actively investing in a portfolio of long and short securities. Risk rating: Medium.

To manage the Funds, CC&L Funds has retained Vancouver-based Connor, Clark & Lunn Investment Management Ltd. (CC&L Investment Management), one of Canada’s largest privately-owned asset management firms, with close to 20 years of experience in managing alternative investment strategies for institutional investors.

“We have been told by our client base that they want access to institutional-caliber alternative investments, managed by a team with a demonstrated track record of success, in the convenience of a liquid alternative fund. By introducing these two new portfolios, we are meeting those objectives and providing investment advisors and their clients with two attractive risk & return profiles to choose from,” said Tim Elliott, President and CEO of CC&L Funds.

“We are excited that these alternative investment solutions are being made available to a broader group of individual Canadian investors. As we have transitioned into an environment with structurally higher interest rates and inflation, we expect market cycles to be shorter, volatility to be higher, and returns from conventional risk assets to be lower. In such an environment, we believe it will become more important for investors to incorporate sources of return that are independent of stock and bond markets to enhance portfolio outcomes,” said Martin Gerber, President and Chief Investment Officer at CC&L Investment Management.

Both CC&L Funds and CC&L Investment Management are affiliates of Connor, Clark and Lunn Financial Group (CC&L), whose multi-affiliate structure brings together the talents of diverse investment teams that offer a broad range of traditional and alternative investment solutions. CC&L is one of Canada’s largest independently owned asset managers, responsible for over $104 billion in assets on behalf of institutional and individual investors.

About the funds

Available in A and F Series, the Funds conform with the regulatory framework related to alternative mutual funds offered by Simplified Prospectus. The Funds are offered through licensed investment dealers, priced daily, with daily liquidity, and available through FundServ.

About Connor, Clark & Lunn Funds Inc.

Connor, Clark & Lunn Funds Inc. (CC&L Funds) partners with leading Canadian financial institutions and their investment advisors to deliver unique institutional investment strategies to individual investors through a select offering of funds, alternative investments and separately managed accounts.

By limiting the offering to a focused group of investment solutions, CC&L Funds is able to deliver unique and differentiated strategies designed to enhance traditional investor portfolios. For more information, please visit cclfundsinc.com.

About Connor, Clark & Lunn Investment Management Ltd.

Connor, Clark & Lunn Investment Management Ltd. (CC&L Investment Management) is one of the largest independent partner-owned investment management firms in Canada with $54.2 billion in assets under management. Founded in 1982, CC&L Investment Management offers a diverse array of investment services including equity, fixed income, balanced and alternative solutions including portable alpha, market neutral and absolute return strategies.

CC&L Investment Management is a part of Connor, Clark & Lunn Financial Group Ltd. (CC&L Financial Group), a multi-boutique asset management company whose affiliates collectively manage approximately $104 billion in financial assets. For more information, please visit cclinvest.cclgroup.com.

About Connor, Clark & Lunn Financial Group Ltd.

Connor, Clark & Lunn Financial Group Ltd. (CC&L Financial Group) is an independently owned, multi-affiliate asset management firm that provides a broad range of traditional and alternative investment management solutions to institutional and individual investors. CC&L Financial Group brings significant scale and expertise to the delivery of non-investment management functions through the centralization of all operational and distribution functions, allowing talented investment managers to focus on what they do best. CC&L Financial Group’s affiliates manage over $104 billion in assets. For more information, please visit cclgroup.com.

Contact

Lisa Wilson
Manager, Product & Client Service
Connor, Clark & Lunn Funds Inc.
416-864-3120
[email protected]

Downtown skyline of Toronto Canada at twilight.

Connor, Clark & Lunn Funds Inc., the manager of PCJ Absolute Return II Fund (the “Fund”) is pleased to announce a change to the liquidity terms of the Fund.

Effective immediately, Fund purchase, sale and switch orders will move from weekly at 4 pm Eastern Time on Fridays, to daily at 3 pm Eastern Time on each Business Day or before the TSX closes for the day, whichever is earlier, and all orders will be processed based on the net asset value calculated that day. Orders received after 3 pm Eastern Time will be processed on the next Business Day based on that day’s net asset value.

About Connor, Clark & Lunn Funds Inc.

Connor, Clark & Lunn Funds Inc. (CC&L Funds) partners with leading Canadian financial institutions and their investment advisors to deliver unique institutional investment strategies to individual investors through a select offering of funds, alternative investments and separately managed accounts.

By limiting the offering to a focused group of investment solutions, CC&L Funds is able to deliver unique and differentiated strategies designed to enhance traditional investor portfolios. For more information, please visit cclfundsinc.com.

Forward-Looking Information

This news release may contain forward-looking information (within the meaning of applicable securities laws) relating to the business and operations of the Manager and the Fund (“forward-looking statements”). Forward-looking statements may be identified by words such as “believe”, “anticipate”, “project”, “expect”, “intend”, “plan”, “will”, “may”, “estimate” and other similar expressions. The forward-looking statements in this news release are based on certain assumptions; they are not guarantees of future performance and involve risks and uncertainties that are difficult to control or predict. A number of factors could cause actual results to differ materially from the results discussed in the forward-looking statements, including, but not limited to, the factors discussed under the heading “What is a Mutual Fund and What Are the Risks of Investing in a Mutual Fund?” in the simplified prospectus available on the SEDAR profile of the Fund at www.sedar.com. There can be no assurance that forward-looking statements will prove to be accurate as actual outcomes and results may differ materially from those expressed in these forward-looking statements. Readers, therefore, should not place undue reliance on any such forward-looking statements. Further, these forward-looking statements are made as of the date of this news release and, except as expressly required by applicable law, the Manager and the Fund assume no obligation to publicly update or revise any forward-looking statement, whether as a result of new information, future events or otherwise.

Contact

Lisa Wilson
Manager, Product & Client Service
Connor, Clark & Lunn Funds Inc.
416-864-3120
[email protected]

Luminated office buildings at Canary Wharf, London at night.

Connor, Clark & Lunn Funds Inc. (CC&L Funds) is excited to announce the recent launch of a prospectus qualified version of the NS Partners International Equity Focus portfolio, which is now available to individual Canadian investors. The NS Partners International Equity Focus Fund is based on a similar portfolio, previously available only to institutional and internal investors.

The Fund seeks to provide investors with long term capital appreciation by investing in a portfolio comprised primarily of non-North American equities, including up to 20% in emerging markets.

To manage the fund, CC&L Funds has retained NS Partners Ltd (NS Partners) a London, UK-based manager with over 30 years of experience in managing international equity portfolios, including developed and emerging markets. NS Partners combines a bottom-up quality/growth framework to analyze companies with a unique top-down global liquidity analysis to help identify regions, countries and sectors that are expected to out and underperform, as well as whether to position the portfolio for a ‘risk-seeking’ or ‘risk averse’ environment.

“For investors allocated to large-cap global equity portfolios, there is a compelling case to make a stand-alone allocation to international equities, given the valuation and concentration issues in the large-cap U.S. equity market, and the headwind of a strong U.S. dollar. By introducing our NS Partners International Equity Focus portfolio in fund format, we can offer a compelling solution for individual investors, managed by a proven, institutional caliber investment team with a differentiated approach” said Tim Elliott, President and CEO of CC&L Funds.

“We’re excited that our International Equity Focus portfolio is being made accessible to a broader group of Canadian investors. With our proven process, a strong record on the institutional side and our talented and committed investment team, we believe this portfolio will provide an attractive solution for those seeking long-term growth from international equity markets.” said Tim Bray, President and Chief Investment Officer at NS Partners.

Both CC&L Funds and NS Partners are affiliates of Connor, Clark and Lunn Financial Group (“CC&L”), whose multi-affiliate structure brings together the talents of diverse investment teams who offer a broad range of traditional and alternative investment solutions. CC&L is one of Canada’s largest independently owned asset managers, responsible for over $104 billion in assets on behalf of institutional and individual investors.

About the fund

Available in A and F Series, the fund conforms with the regulatory framework related to conventional mutual funds offered by Simplified Prospects. The fund will be offered through licensed investment dealers, priced daily, with daily liquidity, and available through FundServ.

About Connor, Clark & Lunn Funds Inc.

Connor, Clark & Lunn Funds Inc. (CC&L Funds) partners with leading Canadian financial institutions and their investment advisors to deliver unique institutional investment strategies to individual investors through a select offering of funds, alternative investments and separately managed accounts.

By limiting the offering to a focused group of investment solutions, CC&L Funds is able to deliver unique and differentiated strategies designed to enhance traditional investor portfolios. For more information, please visit www.cclfundsinc.com.

About NS Partners Ltd

NS Partners Ltd is an independent investment management firm specializing in actively managed global equity portfolios on behalf of major companies, pension funds, foundations, endowments and sovereign wealth funds. NS Partners Ltd is part of the Connor, Clark & Lunn Financial Group, a multi-boutique asset management firm. For more information, please visit www.ns-partners.co.uk.

About Connor, Clark & Lunn Financial Group Ltd.

Connor, Clark & Lunn Financial Group Ltd. (CC&L Financial Group) is an independently owned, multi-affiliate asset management firm that provides a broad range of traditional and alternative investment management solutions to institutional and individual investors. CC&L Financial Group brings significant scale and expertise to the delivery of non-investment management functions through the centralization of all operational and distribution functions, allowing talented investment managers to focus on what they do best. CC&L Financial Group’s affiliates manage over $104 billion in assets. For more information, please visit www.cclgroup.com.

Contact

Lisa Wilson
Manager, Product & Client Service
Connor, Clark & Lunn Funds Inc.
416-864-3120
[email protected]

The two measures of global “excess” money tracked here remain negative, arguing for a cautious view of equity market prospects. 

Excess (or deficient) money refers to the difference between the actual money stock and the demand for money to support economic transactions. According to “monetarist” theory, a surplus is associated with increased demand for financial / real assets and upward pressure on their prices, assuming no change in supply. 

Excess money is unobservable so two proxies are followed here: the difference between six-month rates of change of global (i.e. G7 plus E7) real narrow money and industrial output; and the deviation of 12-month real narrow money growth from a slow moving average. 

Historically (i.e. over 1970-2021), global equities outperformed US dollar cash on average only when both measures were positive. Unsurprisingly, average performance was worst when both were negative (underperformance of 8.9% pa). These results allow for reporting lags in monetary / economic data. 

The second measure turned negative in October 2021, which was known by end-November. The first measure followed in November, which was known by end-January 2022 (a longer lag because industrial output numbers are released after monetary / CPI data). 

Previous posts noted a recovery in global six-month real narrow money momentum during H2 2022*. With industrial output expected to weaken, it was suggested that the first measure would turn positive, possibly by December. 

The second measure – based on 12- rather than six-month real money momentum – was deeply negative in late 2022, with a switch to positive deemed unlikely before mid-2023. 

The suggested switch positive in the first measure has yet to occur. The six-month rate of change of industrial output crossed below zero in December but remained just above real narrow money momentum – see chart 1. 

Chart 1

Chart 1 showing G7 + E7 Industrial Output & Real Narrow Money (% 6m) highlighting August 2022

Will a cross-over have occurred in January? Partial data suggest that the recovery in real money momentum stalled last month. A reliable January estimate of industrial output won’t be available until mid-March. A reopening bounce in China could offset weakness elsewhere. 

A further point is that the recovery in global real narrow money momentum since mid-2022 partly reflected a strong pick-up in Russia, which may be of limited global relevance given the country’s enforced economic and financial isolation. 

Chart 2 shows the result of replacing Russia with Indonesia in the G7 plus E7 real money calculation from January 2022, before the February invasion of Ukraine**. The trough in real money momentum is placed in October rather than August, with the subsequent recovery even more anaemic. 

Chart 2

Chart 2 showing G7 + E7 Industrial Output & Real Narrow Money (% 6m) highlighting October 2022

*The trough in real money momentum originally occurred in June but is now placed in August, partly reflecting revisions to US CPI seasonal adjustments.

**The other E7 countries (as defined here) are Brazil, China, India, Korea, Mexico and Taiwan.

Gas price relief and Chinese reopening have tempered pessimism about Eurozone economic prospects, contributing to a Q4 rally in equities. Monetary trends, by contrast, suggest a worsening outlook due to the ECB’s scorched earth policy tightening. 

The preferred narrow money measure here – non-financial M1 – contracted for a third straight month in November. The three-month annualised rate of decline of 5.3% compares with a maximum fall of 1.7% during the GFC – see chart 1. 

Chart 1

Chart showing Eurozone Money Measures

Narrow money weakness is being driven by households and firms switching out of overnight deposits into time deposits and notice accounts – a normal pre-recessionary development. Broad money, in addition, is slowing – non-financial M3 rose by only 0.2% in November, pulling three-month annualised growth down to 3.4%, the slowest since 2018. 

The headline M1 and M3 measures are displaying greater weakness, reflecting a fall in money holdings of non-bank financial corporations.

Broad money growth had been supported by solid expansion of bank loans to the private sector but, as expected and signalled by the ECB’s lending survey, momentum is now fading – chart 2. Slumping credit demand and forthcoming QT suggest that broad money will follow narrow into contraction. 

Chart 2

Chart showing Eurozone Bank Loans to Private Sector and ECB Bank Lending Survey Credit Demand Indicator

Corporate loan demand had been boosted by inventory financing but stockbuilding reached a record share of GDP in Q3 – chart 3 – and is probably now being cut back sharply, contributing to a move into recession. Consistent with this story, short-term loans to corporations contracted in both October and November. 

Chart 3

Chart showing Eurozone Stockbuilding as Percent of GDP

A sharp fall in inflation will support real money trends but has yet to arrive. The six-month rate of contraction of real non-financial M1 reached another new record in November – chart 4. 

Chart 4

Eurozone GDP and Real Narrow Money

Monetary tightening in 2007-08 and 2010-11 was associated with a divergence of money trends across countries, reflecting and contributing to financial fragmentation. This is occurring again, with weakness focused on Italy. 

Italian real narrow money deposits contracted by 9.7%, or an annualised 18.4%, in the six months to November, with the larger decline than elsewhere due to both greater nominal weakness and higher CPI inflation – chart 5.

Chart 5

Chart showing Real Narrow Money

In nominal terms, total bank deposits in Italy were unchanged in the year to November – chart 6. Italian banks’ assets grew modestly over this period. The banks funded this expansion by increasing their net borrowing from Banca d’Italia, which in turn accessed additional funding from the Eurosystem, resulting in a further widening of its TARGET2 deficit. The deficit reached a record €715 billion in September following a surge in Italian BTP yields, falling back in October / November – chart 7. Another rise in yields since early December may have been associated with deposit outflows from the banking system and renewed upward pressure on the TARGET2 shortfall. 

Chart 6

Chart showing Bank Deposits of Eurozone Residents

Chart 7

Chart showing TARGET2 Balances

The “monetarist” rule of thumb that broad money growth leads inflation by two years suggests a rapid fall in G7 CPI inflation in 2023 and an undershoot of targets by H2 2024.

Annual growth of the G7 broad money measure calculated here is likely to have fallen below 3% in October, based on US and Japanese data. The money stock appears to have stagnated in the latest three months, with a contraction in the US offsetting weak growth elsewhere*.

The monetarist rule worked perfectly in the early 1970s, when a surge in annual money growth to a peak in November 1972 was followed by a spike in annual CPI inflation to a high exactly two years later – see chart 1.

Chart 1

Chart 1 showing G7 Consumer Prices and Broad Money (% yoy)

Inflation fell sharply from its 1974 peak, mirroring a big decline in money growth in 1973-74. The difference from now is that annual money growth bottomed above 10%, resulting in inflation stalling at a still-high level.

The money growth surge in 2020-21 was almost complete by June 2020 but a final peak was delayed until February 2021. Consistent with the two-year rule, CPI inflation spiked into June 2022, since moving sideways. It may or may not make a final peak but the rule suggests that a major decline will be delayed until after February 2023.

Broad money growth averaged 4.5% in the five years to end-2019. CPI inflation averaged 1.9% in the five years to end-2021 (i.e. allowing for the two-year lag). Money growth returned to the 2015-19 average in June 2022 (4.4%). The monetarist rule, therefore, suggests that inflation will be back below 2% by mid-2024 and will continue to move lower later in the year, reflecting the further decline in money growth since June.

How fast will inflation fall? A reasonable assumption is that its decline will mirror the rapid drop in money growth two years earlier, consistent with the 1970s experience. An illustrative projection is shown in chart 2. Inflation, currently at 7.8% (October estimate), falls to 4% in July 2023 and below 3% by December.

Chart 2

Chart 2 showing G7 Consumer Prices & Broad Money (% yoy) with “Monetarist” Forecast

Some monetarist economists expect inflation to be stickier in 2023. They argue that there is still a monetary “overhang” from the growth surge in 2020-21. Inflation, according to this view, will remain high into H2 2023 to “absorb” this excess. The impact of current monetary weakness will be delayed until 2024-25.

The assessment here is that the overhang is much reduced and its removal is consistent with the optimistic inflation projection shown in chart 2 as long as money trends remain as weak as currently, which is likely.

One measure of the monetary overhang is the deviation of the real broad money stock from its 2010-19 trend. This deviation peaked at 16% in May 2021 and has since narrowed to 6% as inflation has overtaken slowing nominal money growth – chart 3. 

Chart 3

Chart 3 showing G7 Real Broad Money where January 1964 = 100

The projection in chart 3 is based on the inflation profile in chart 2 and an assumption that broad money grows by 2% pa. The deviation of the real money stock from trend falls below 2% in H2 2023 and is eliminated by mid-2024.

Is the assumption of 2% money growth realistic? As noted, there has been no expansion in the latest three months.

As the chart shows, there was a larger deviation of real money from trend than currently at the end of the GFC in 2009. The adjustment back to trend was driven by nominal money weakness rather than high inflation – the money stock contracted by 1.9% between July 2009 and June 2010.

Bank lending has been supporting money growth but central bank loan officer surveys suggest a sharp slowdown ahead: October Fed survey results released this week echo weakness in earlier ECB and BoE surveys – chart 4.

Chart 4

Chart 4 showing US Commercial Bank Loans and Leases (% 6m) with Fed Senior Loan Officer Survey Credit Demand and Supply Indicators* *Weighted Average of Balances across Loan Categories

Continued monetary stagnation – or worse – would confirm that G7 central banks, with the honourable exception of the BoJ, have overtightened policies, compounding their 2020-21 policy error.

G7 monetary gyrations may be contrasted with relative stability around trend in E7** real broad money – chart 5. E7 central bank eased policies conventionally in 2020 and were quick to reverse course as economies rebounded and / or inflationary pressures emerged. This has been reflected in lower average inflation than in the G7 and a faster turnaround – chart 6.

Chart 5

Chart 5 showing E7 Real Broad Money where June 1995 = 100

Chart 6

Chart 6 showing G7 and E7 Consumer Prices (% 6m)

*Money measures used: US M2+ (M2 plus large time deposits and institutional money funds), Japan M3, Eurozone non-financial M3, UK non-financial M4, Canada expanded M2+ (M2+ plus non-personal time deposits).

**E7 defined here as BRIC plus Korea, Mexico and Taiwan.