Six-month core CPI momentum has returned to a target-consistent level in the Eurozone and UK, with January readings of 2.1% and 1.9% annualised respectively*. US momentum is significantly higher, at 3.6% – see chart 1. What explains this gap?

Chart 1

Chart 1 showing Core Consumer Prices (% 6m annualised)

One answer is that the US CPI is overstating core pressure. The six-month increase in the Fed’s preferred core PCE measure was 1.9% annualised in December. Assuming a monthly rise of 0.4% in January (the same as for core CPI), six-month momentum would firm to 2.4% – still little different from Eurozone / UK core CPI readings.

The stronger rise in the US CPI than the PCE index reflects a higher weighting of housing rents and a faster measured increase in “supercore” services prices.

Perhaps reality lies somewhere between the two gauges, i.e. the stickiness of US core CPI momentum is at least partly genuine. If so, the US / European divergence may be explicable by monetary trends in 2021-22.

Previous posts highlighted the close correspondence between the slowdowns in Eurozone and UK six-month CPI momentum and profiles of broad money growth two years earlier. Chart 2 updates the UK comparison to incorporate January CPI data.

Chart 2

Chart 2 showing UK Consumer Prices & Broad Money (% 6m annualised)

UK and Eurozone six-month broad money momentum peaked in summer 2020 and had returned to the pre-pandemic range by late 2021. This is consistent with the reversion of six-month headline and core CPI momentum to target-consistent levels around end-2023.

US broad money momentum followed a different path, with a more extreme surge in summer 2020, a return to earth in H2 2020 and a secondary rise in H1 2021, driven partly by disbursement of stimulus checks in December 2020 and March 2021 – chart 3.

Chart 3

Chart 3 showing US Consumer Prices & Broad Money (% 6m annualised)

The sharp fall in US six-month money growth during H2 2020 was echoed by a slowdown in CPI momentum into end-2022 – much earlier than occurred in the Eurozone and UK. More recent CPI stickiness may reflect the lagged effects of the secondary monetary acceleration into mid-2021.

What does this suggest for absolute and relative prospects? The judgement here is that broad money growth of 4-5% pa is consistent with 2% inflation over the medium term. US six-month money momentum crossed below both this range and UK / Eurozone momentum in May 2022, reaching an eventual low in February 2023, at a weaker level than (later) lows in the UK / Eurozone.

Assuming a two-year lead, this suggests that US six-month core CPI momentum will move down to 2% around mid-2024 on the way to a larger (though possibly shorter) undershoot than in the UK / Eurozone.

*Eurozone = ECB seasonally adjusted CPI excluding energy and food including alcohol and tobacco. UK = own measure additionally excluding education and incorporating estimated effects of VAT changes, seasonally adjusted.

The money and cycles forecasting approach suggested that global inflation would fall rapidly during 2023 but at the expense of significant economic weakness. The inflation forecast played out but activity proved more resilient than expected. What are the implications for the coming year?

One school of thought is that economic resilience will limit further inflation progress, resulting in central banks disappointing end-2023 market expectations for rate cuts, with negative implications for growth prospects for late 2024 / 2025.

A second scenario, favoured here, is that the economic impact of monetary tightening has been delayed rather than avoided, and a further inflation fall during H1 2024 will be accompanied by significant activity and labour market weakness, with corresponding underperformance of cyclical assets.

The dominant market view, by contrast, is that further inflation progress will allow central banks to ease pre-emptively and sufficiently to avoid material near-term weakness and lay the foundation for economic acceleration into 2025.

On the analysis here, the second scenario might warrant a two-thirds probability weighting versus one-sixth for the first and third. This assessment reflects several considerations.

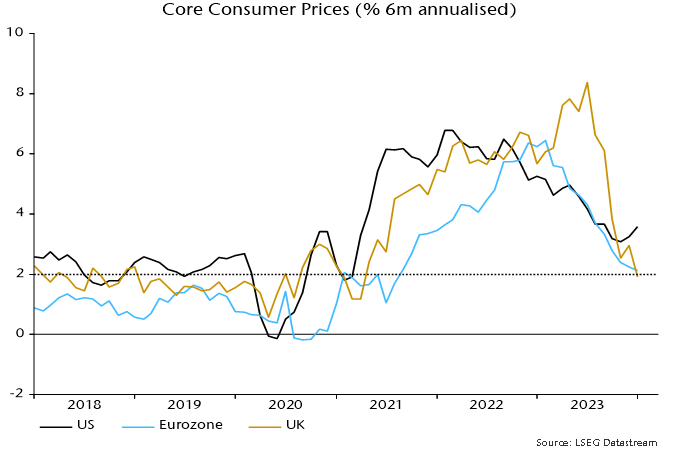
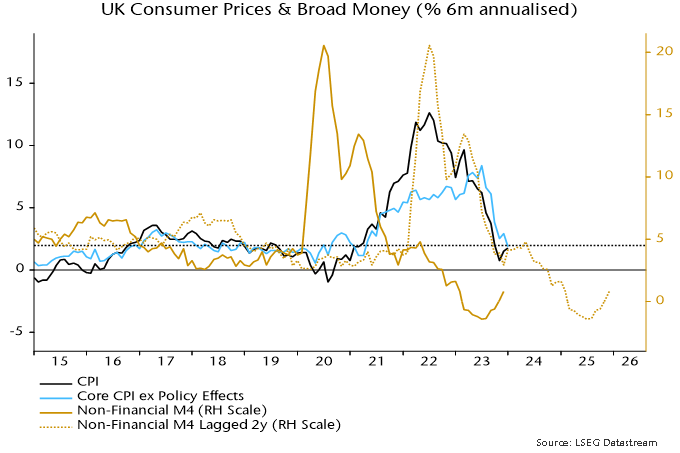
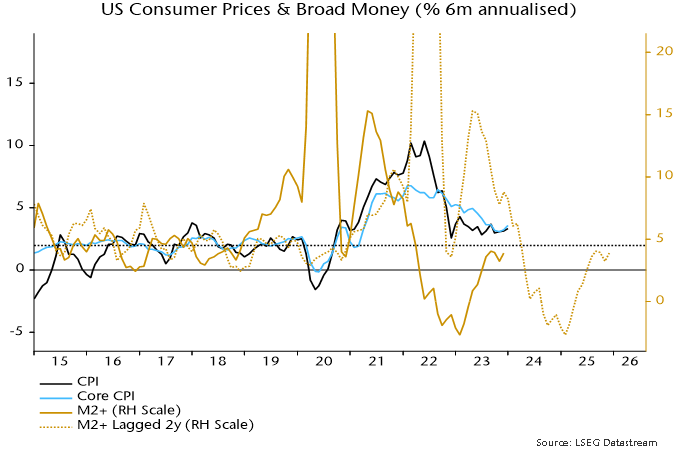
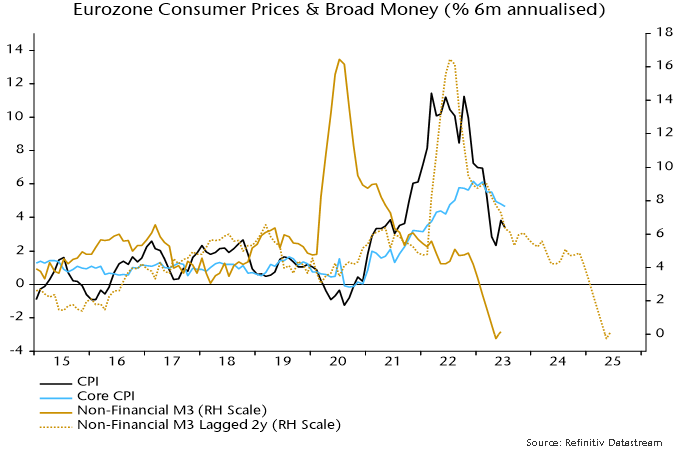
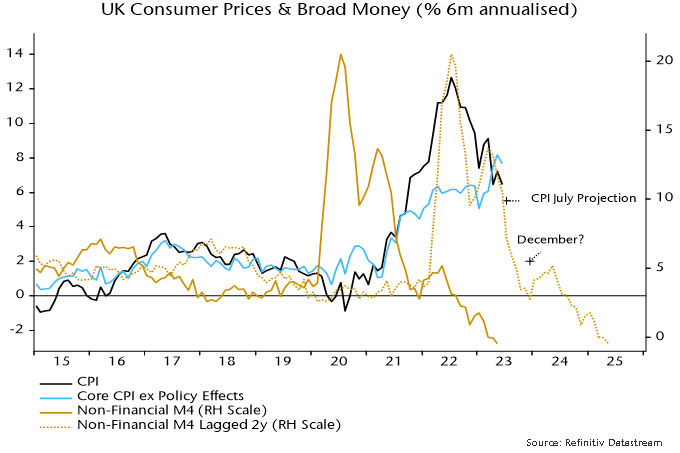
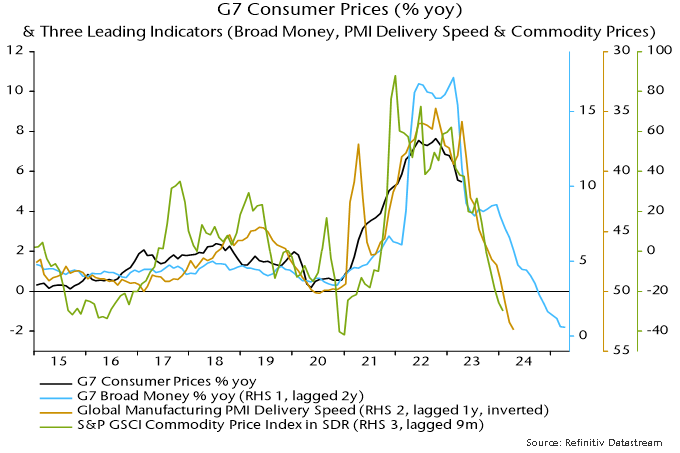
First, on inflation, developments continue to play out in line with the simplistic “monetarist” proposition of a two-year lead from money to prices. G7 annual broad money growth formed a double top between June 2020 and February 2021 – mid-point October 2020 – and declined rapidly thereafter. Annual CPI inflation peaked in October 2022, falling by 60% by November 2023 – chart 1.

Chart 1

Chart 1 showing G7 Consumer Prices & Broad Money (% yoy)

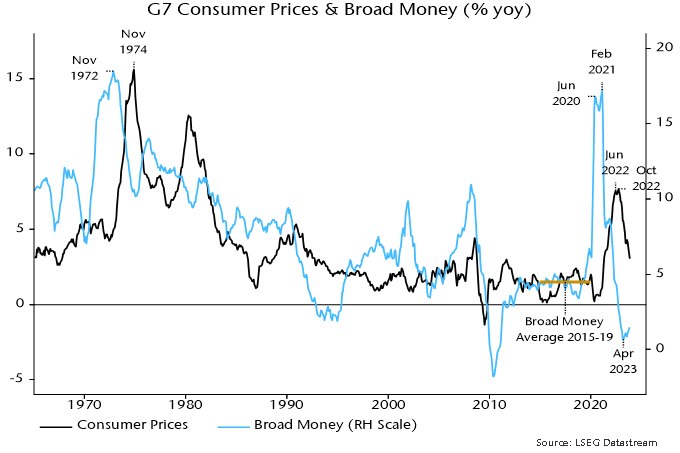
Broad money growth returned to its pre-pandemic average in mid-2022 and continued to decline into early 2023. The suggestion is that inflation rates will return to targets by H2 2024 with a subsequent undershoot and no sustained revival before mid-2025.

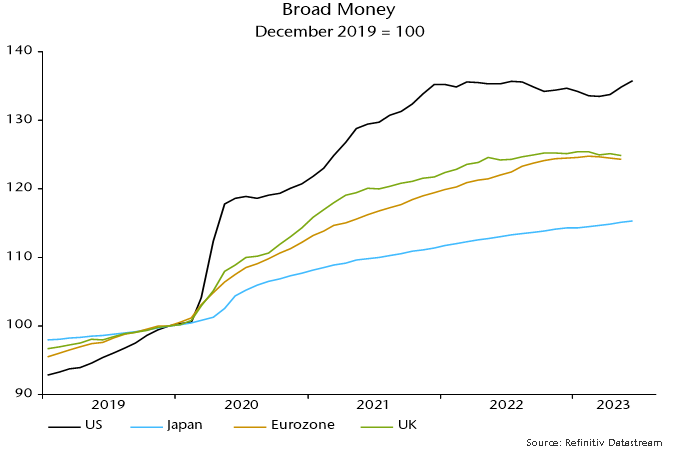
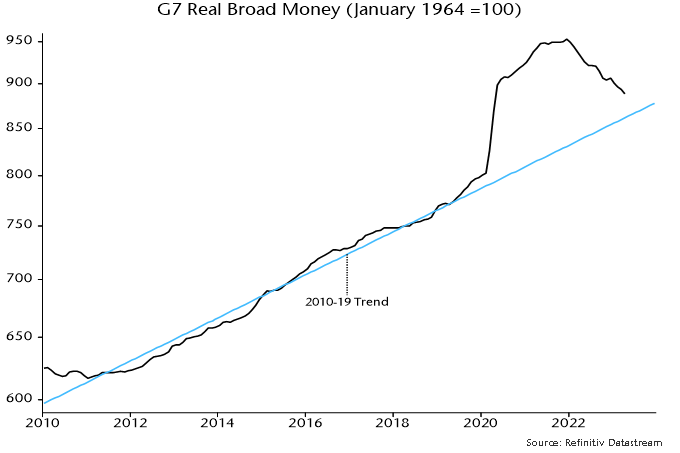
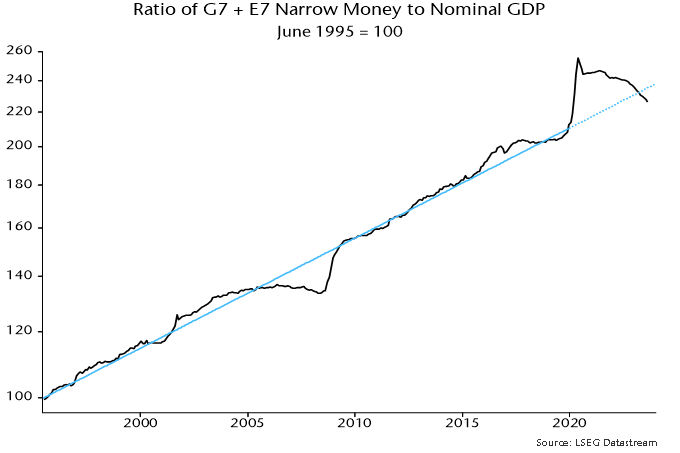
Secondly, economic resilience in 2023 partly reflected post-pandemic demand / supply catch-up effects. On the demand side, an analytical mistake here was to downplay the supportive potential of an overhang of “excess” money balances following the 2020-21 monetary explosion. Globally, this excess stock has probably now been eliminated – chart 2.

Chart 2

Chart 2 showing Ratio of G7 + E7 Narrow Money to Nominal GDP June 1995 = 100

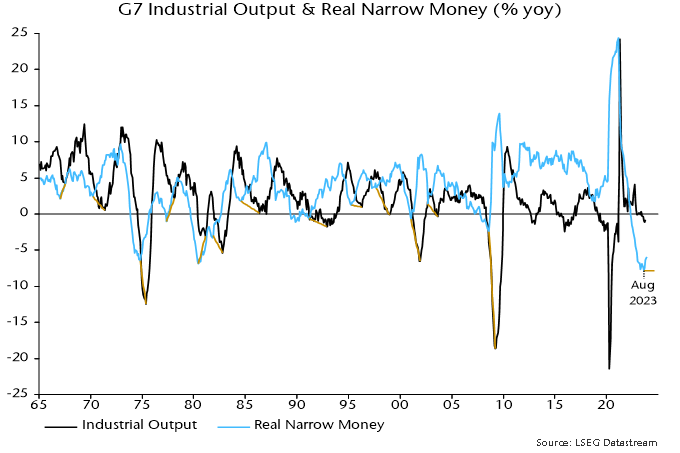
The moderate economic impact of monetary tightening to date, moreover, is consistent with historical experience. Major lows in G7 annual real narrow money momentum led lows in industrial output momentum by an average 12 months historically – chart 3. With a trough in the former reached as recently as August 2023, economic fall-out may not be fully apparent until H2 2024.

Chart 3

Chart 3 showing G7 Industrial Output & Real Narrow Money (% yoy)

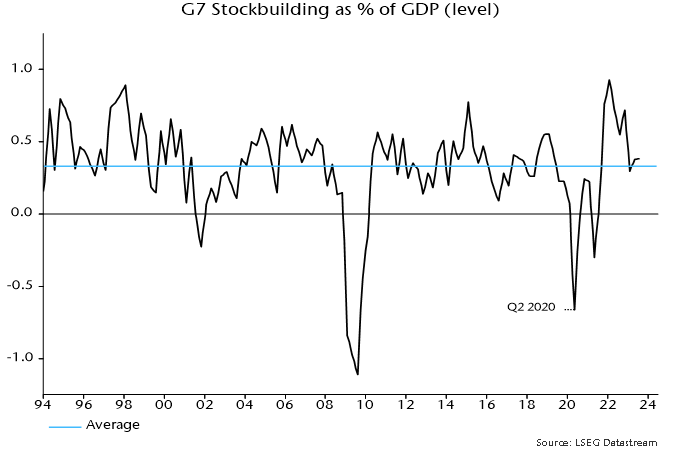
The suggestion that economic downside is incomplete is supported by a revised assessment of cyclical influences. The previous hypothesis here was that the global stockbuilding cycle would bottom out in late 2023 and recover during 2024. Recent stockbuilding data, however, appear to signal that the cycle has extended, with a recovery pushed back until H2 2024.

The assumption of a late 2023 trough was based on a previous low in Q2 2020 and the average historical cycle length of 3 1/3 years. This seemed on track at mid-2023: G7 stockbuilding had crossed below its long-run average in Q1, consistent with a trough-compatible level being reached in H2 – chart 4. The downswing, however, was interrupted in Q2 / Q3, with a further decline likely to be necessary to complete the cycle and form the basis for a recovery.

Chart 4

Chart 4 showing G7 Stockbuilding as % of GDP (level)

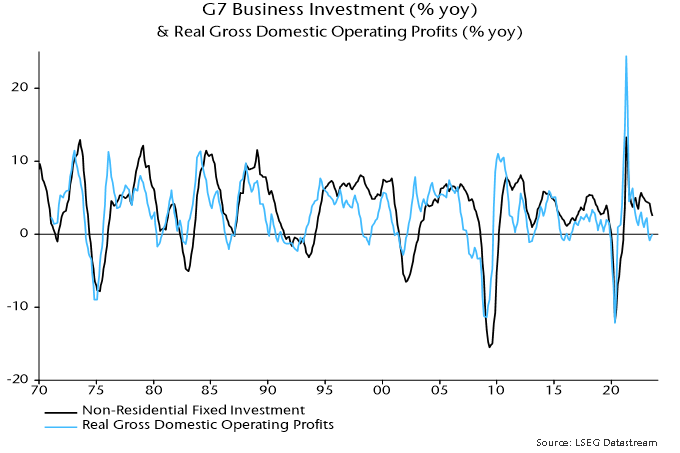
A resumed drag from stockbuilding may be accompanied by a further slowdown or outright weakness in business investment, reflecting recent stagnation in real profits – chart 5. Capex is closely correlated with hiring decisions, so this also argues for a faster loosening of labour market conditions.

Chart 5

Chart 5 showing G7 Business Investment (% yoy) & Real Gross Domestic Operating Profits (% yoy)

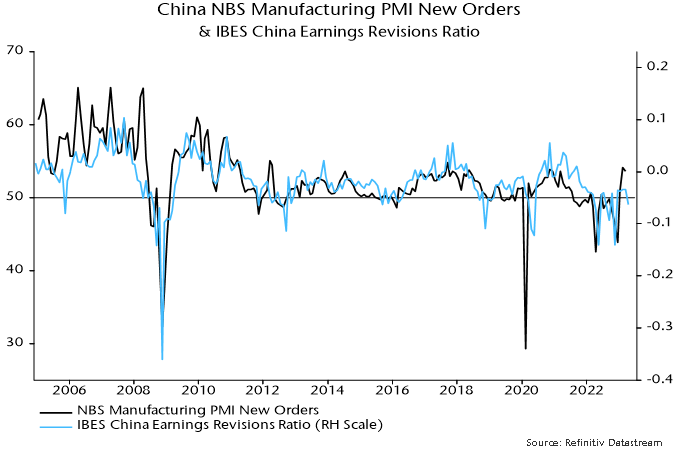
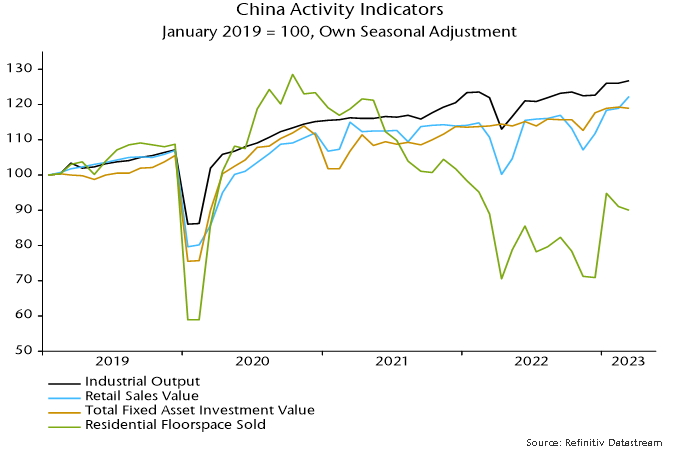
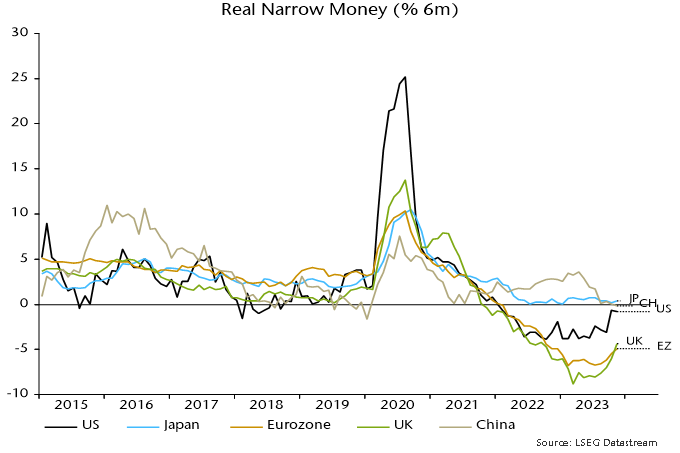
Real narrow money momentum remains weaker in Europe than the US, suggesting continued economic underperformance and a more urgent need for policy relaxation – chart 6. Six-month rates of change are off the lows but need to rise significantly to warrant H2 recovery hopes. Globally, the US / European revivals have been partly offset by a further slowdown in China, suggesting still-weakening economic prospects.

Chart 6

Chart 6 showing Real Narrow Money (% 6m)

The frenetic rally of the final two months resulted in global equities delivering a strong return during 2023 despite the two “excess” money indicators tracked here* remaining negative throughout the year. The indicators, however, started flashing red around end-2021, since when the MSCI World index has slightly underperformed US dollar cash.

Historically (i.e. since 1970), equities outperformed cash on average only when both indicators were positive, a condition unlikely to be met until mid-2024 at the earliest.

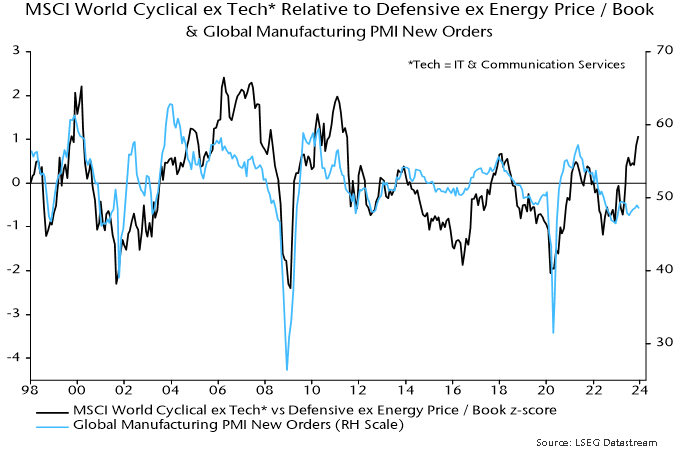
The late 2023 rally was led by cyclical sectors as investors embraced a “soft landing” scenario. Non-tech cyclical sectors ended the year more than one standard deviation expensive relative to history versus defensive ex. energy sectors on a price / book basis – chart 7. Current prices appear to discount an early / strong PMI recovery, which the earlier discussion suggests is unlikely.

Chart 7

Chart 7 showing MSCI World Cyclical ex Tech* Relative to Defensive ex Energy Price / Book & Global Manufacturing PMI New Orders *Tech = IT & Communication Services

Quality stocks outperformed during 2023, reversing a relative loss in 2022 and consistent with the historical tendency when “excess” money readings were negative. Earlier underperformance partly reflected an inverse correlation with Treasury yields, a relationship now suggesting further catch-up potential.

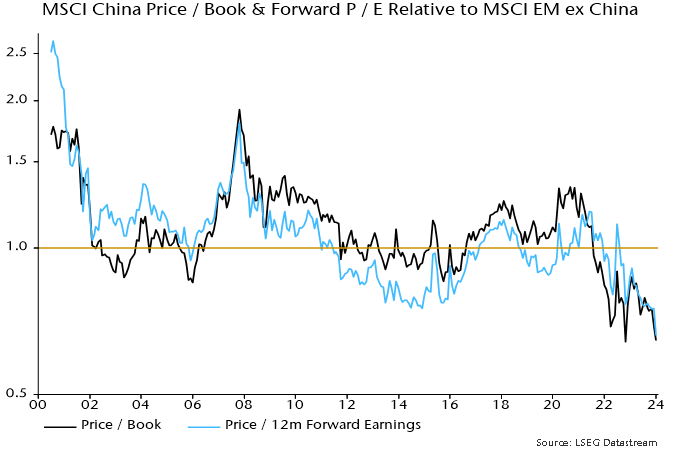
Contributing factors to the dramatic underperformance of Chinese stocks during 2023 include excessively optimistic post-reopening economic expectations at end-2022 and unexpectedly restrictive monetary / fiscal policies. MSCI China is at a record** valuation discount to the rest of EM – chart 8 – while monetary / economic weakness suggests an early policy pivot.

Chart 8

Chart 8 showing MSCI China Price / Book & Forward P / E Relative to MSCI EM ex China

A key issue for 2024 is the extent to which central bank policy easing will revive money growth. While inflation is expected to trend lower into early 2025, the cycles framework suggests another upswing later this decade – the 54-year Kondratyev price / inflation cycle last peaked in 1974. Aggressive Fed easing 54 years ago – in 1970 – pushed annual broad money growth into double-digits the following year, creating the conditions for the final Kondratyev ascent. Signs that a similar scenario is playing out would warrant adding to inflation hedges.

*The differential between G7 plus E7 six-month real narrow money and industrial output momentum and the deviation of 12-month real narrow money momentum from a long-term moving average.

**Since June 2000. MSCI China included only B-shares through May 2000, when red chips and H-shares were added.

Eurozone CPI numbers for July were deemed disappointing because annual core inflation – excluding energy, food, alcohol and tobacco – stalled at 5.5%. 

Or did it? The annual rise in the ECB’s seasonally adjusted core series slowed to 5.3%, below the consensus forecast of 5.4% for the Eurostat unadjusted measure. The two gauges rarely diverge to this extent (they both recorded 5.5% inflation in June). 

The six-month rate of increase of the ECB series eased to 4.7% annualised in July, the slowest since June 2022 and down from a December peak of 6.2%. Six-month headline momentum was lower at 3.4%. 

As in the UK, six-month headline inflation is tracking a simplistic “monetarist” forecast based on the profile of broad money momentum two years earlier – see chart 1. This relationship suggests that six-month CPI momentum will be back at about 2% in spring 2024, with the annual rate following during H2. 

Chart 1

Chart 1 showing Eurozone Consumer Prices & Broad Money (% 6m annualised)

The projected return to 2% next spring is a reflection of a fall in six-month broad money momentum below 5% annualised in spring 2022. A subsequent decline in money momentum to zero suggests an inflation undershoot or even falling prices in 2025. 

The shocking implication is that monetary trends were already consistent with a return of inflation to target before the ECB started hiking rates in July 2022. The 425 bp rise since then represents grotesque overkill, confirmed by recent monetary stagnation / contraction. 

The corollary is that a huge and embarrassing policy reversal is likely to be necessary over the next 12-24 months, unless some other factor causes broad money momentum to recover to a target-consistent pace. 

That seems a remote possibility, based on consideration of the “credit counterparts”. Loan demand balances in the latest ECB bank lending survey were less negative but still suggestive of negligible private credit expansion – chart 2. 

Chart 2

Chart 2 showing Eurozone Bank Loans to Private Sector (% 6m) & ECB Bank Lending Survey Credit Demand Indicator* *Average of Demand Balances across Loan Categories

Credit to government may contract given QT, withdrawal of TLTRO funding and inverted yield curves. (Banks previously used cheap TLTRO finance to buy higher-yielding government securities.) Redemptions of public sector debt held under the ECB’s Asset Purchase Programme amount to €262 billion over the next 12 months, equivalent to 1.6% of M3. 

Broad money momentum has been supported recently by an increase in banks’ net external assets, reflecting a strengthening basic balance of payments (current account plus non-bank capital flows) – chart 3. This could accelerate as a Eurozone recession swells the current account surplus but is unlikely to outweigh domestic credit weakness. 

Chart 3

Chart 3 showing Eurozone M3 & Credit Counterparts Contributions to M3 % 6m

UK headline CPI momentum continues to track a simplistic “monetarist” forecast based on the profile of broad money momentum two years earlier. 

Six-month growth of headline prices, seasonally adjusted, peaked at 12.7% annualised in July 2022 and had halved to 6.5% as of June. This mirrors a halving of six-month broad money momentum from a peak of 20.5% annualised in July 2020 to 10.5% in June 2021 – see chart 1. 

Chart 1

Chart 1 showing UK Consumer Prices & Broad Money (% 6m annualised)

Broad money continued to slow sharply during H2 2021, with six-month momentum down to 2.7% by December, suggesting a fall in six-month CPI momentum to 2% annualised or lower by late 2023 / early 2024. 

A 2% rate of increase of prices during H2 2023 could be achieved by the following combination: 

The energy price cap falling by a further 10% in October, in line with current estimates based on wholesale prices, following the 17% July reduction. 

Food, alcohol and tobacco prices slowing to an 8% annual inflation rate by December from 14.9% in June. 

Core prices rising at a 4% seasonally adjusted annualised rate during H2 2023, down from 7.7% in H1. 

The latter two possibilities are supported by producer output price developments – annual inflation of food products is already down from a 16.8% peak to 8.7%, while core output prices flatlined during H1, following a 6.4% annualised rise during H2 2022. 

A 2% annualised CPI increase during H2 2023 would imply a headline annual rate of about 4% by year-end, well with PM Sunak’s target of a halving from 10%+ levels, although he will have made no contribution to the “success”. 

Why has UK CPI inflation exceeded US / Eurozone levels, both recently and cumulatively since end-2019? 

The assessment here is that the divergence reflects relatively weak UK supply-side economic performance and a larger negative terms of trade effect, rather than more egregious monetary excess. 

Charts 2 and 3 show that UK / Eurozone broad money expansion since end-2019 has been similar and less than in the US, with the relative movements mirrored in nominal GDP outcomes. 

Chart 2

Chart 2 showing Broad Money December 2019 = 100

Chart 3

Chart 3 showing Nominal GDP Q4 2019 = 100

The UK has, however, underperformed the US and Eurozone in terms of the division of nominal GDP expansion between real GDP and domestically-generated inflation, as measured by the GDP deflator – charts 4 and 5. 

Chart 4

Chart 4 showing GDP Q4 2019 = 100

Chart 5

Chart 5 showing GDP Deflator Q4 2019 = 100

UK consumer prices were additionally boosted relative to the US by opposite movements in the terms of trade (i.e. the ratio of export to import prices), reflecting different exposures to energy prices as well as currency movements (i.e. a strong dollar through last autumn) – chart 6. 

Chart 6

Chart 6 showing Terms of Trade* Q4 2019 = 100 *Ratio of Deflators for Exports & Imports of Goods & Services

UK supply-side weakness may be structural but monetary and terms of trade considerations suggest an improvement in UK relative inflation performance – annual broad money growth is now similar to the US and below the Eurozone level, while sterling appreciation since late 2022 may extend a recent recovery in the terms of trade.

It might be expected that G7 central bankers, in attempting to judge inflation prospects and the appropriate policy stance, would be paying close attention to indicators that signalled the recent inflationary upsurge.

Such indicators include:

  • Broad money growth, which led the inflation increase by about two years.
  • The global manufacturing PMI delivery speed index, a gauge of excess supply / demand in goods markets, which led by about a year.
  • Broad commodity price indices, such as the S&P GSCI, which displayed a sharp pick-up in momentum six to 12 months before the inflation upsurge.

Indicators that provided little or no warning of inflationary danger include measures of core price momentum, wage growth, labour market tightness and inflation expectations, i.e. indicators previously cited to argue that an inflation rise would be “transitory” and now being used to justify continued policy tightening.

Chart 1 shows G7 CPI inflation together with the three informative indicators listed above, with appropriate lags applied.

Chart 1

Chart 1 showing G7 Consumer Prices (% yoy) & Three Leading Indicators (Broad Money, PMI Delivery Speed & Commodity Prices)

The three indicators have fallen far below pre-pandemic levels, suggesting that CPI inflation rates will return to targets – or undershoot them – in 2024.

Core inflation and wage growth moved up more or less in tandem with headline inflation during the upswing. Hawkish central bankers need to explain why they expect an asymmetry on the way down.

A possible “monetarist” argument for inflation proving sticky is that the stock of money remains excessive relative to the price level. The judgement here is that any overhang is small and – with monetary aggregates stagnant / contracting – will soon be eliminated.

The G7 real broad money stock is 3% above its 2010-19 trend, down from a peak 16% deviation in May 2021 – chart 2.

Chart 2

Chart 2 showing G7 Real Broad Money (January 1964 = 100)

While agreeing on the destination, the indicators are giving different messages about the speed of decline of inflation.

The PMI delivery speed indicator and commodity prices are more relevant for goods prices, with recent readings consistent with the expectation here of goods deflation later in 2023.

Broad money trends, by contrast, suggest a temporary slowdown in the rate of decline of CPI inflation during H2, reflecting a stabilisation of money growth during H2 2001. This resulted from a reacceleration of US broad money following disbursement of a third round of stimulus payments.

A possible reconciliation is that the bulk of a fall in services inflation will be delayed until 2024. Such a scenario would suggest a slower reversal of policy rates and an extension of real money weakness, with negative economic implications.

The Chinese economy has bounced back since reopening but the pick-up has arguably been underwhelming. GDP grew at a 9.1% annualised rate in Q1, according to official data, but this partly represents payback for a weak Q4. Growth averaged an unexceptional (by Chinese standards) 5.7% over the two quarters. 

Inflationary pressures remain weak despite the activity rebound. Nominal GDP expansion was only marginally higher than real in Q4 / Q1 combined: the GDP deflator rose by just 0.4% annualised – see chart 1**. 

Chart 1

Chart 1 showing China Nominal & Real GDP (% 2q annualised)

Muted nominal GDP growth has contributed to lacklustre profits, with the IBES China earnings revisions ratio diverging negatively from recent stronger official PMIs, questioning the sustainability of the latter – chart 2. 

Chart 2

Chart 2 showing China NBS Manufacturing PMI New Orders & IBES China Earnings Revisions Ratio

Monthly activity numbers for March were mixed and don’t suggest a pick-up in momentum at quarter-end. Retail sales were a bright spot but strength in industrial output, fixed asset investment and home sales has faded after an initial reopening bounce – chart 3. 

Chart 3

Chart 3 showing China Activity Indicators January 2019 = 100, Own Seasonal Adjustment

Moderate nominal GDP expansion is consistent with recent narrow money trends: six-month growth of true M1 (which corrects the official M1 measure to include household demand deposits) remains range-bound and slightly below its 2010s average – chart 4**. 

Chart 4

Chart 4 showing China Nominal GDP & Narrow / Broad Money (% 6m)

Broad money growth, as the chart shows, is significantly stronger. However, examination of the “credit counterparts” indicates that a rise since late 2021 has been driven mainly by banks switching to deposit funding and reducing other liabilities – domestic credit expansion has been stable. 

The judgement here is to place greater weight on narrow money trends, which currently suggest a moderate recovery that probably requires additional policy support to offset external headwinds. 

*Official unadjusted nominal GDP seasonally adjusted here; GDP deflator derived from comparison with official seasonally adjusted real GDP.

**March true M1 estimated pending release of demand deposits data.

The “monetarist” forecast is that G7 inflation rates will fall dramatically into 2024, mirroring a collapse in nominal money growth in 2021-22.

G7 annual broad money growth returned to its pre-pandemic (2015-19) average of 4.5% in mid-2022. Based on the rule of thumb of a two-year lead, this suggests that annual inflation rates will be around pre-pandemic levels in mid-2024. More recent broad money stagnation signals a likely undershoot.

Pessimists argue that inflation will prove sticky because of high wage growth. Wages are a coincident element of the inflationary process. Low (but rising) wage growth didn’t prevent the 2021-22 inflation surge and high (but moderating) growth isn’t an obstacle to a substantial fall now.

The 2021-22 inflation surge was initially driven by excess demand for goods, due to a combination of covid-related supply disruption, associated precautionary overbuilding of inventories, a spending switch away from services and – most importantly – excessive monetary / fiscal stimulus.

Excess goods demand was reflected in a plunge in the global manufacturing PMI supplier delivery speed index to a record low. This plunge predated the inflation surge by about a year versus a two-year lead from money – see chart 1.

Chart 1

Chart 1 showing G7 Consumer Prices (% yoy), G7 Broad Money (% yoy, lagged 2y) & Global Manufacturing PMI Supplier Delivery Speed (lagged 1y, inverted)

The reverse process is now well-advanced, with supply normalising, firms running down excess inventories, the services spending share rebounding and monetary policies far into overrestrictive territory. The PMI delivery speed index is at its highest level since the depths of the 2008-09 recession, signalling substantial excess goods supply.

Global goods prices are heading into deflation. Chinese reopening has added to excess supply and Asian exporters are already lowering prices in the US – chart 2. Chinese producer prices are falling and the renminbi is competitive, with JP Morgan’s PPI-based real effective rate at its lowest level since 2011. Other Asian currencies are similarly weak.

Chart 2

Chart 2 showing US Import Prices of Goods by Country / Region (% yoy)

The global manufacturing PMI output price index lags and correlates negatively with the delivery speed index. It has plunged from 64 to 53 and is likely to cross below 50 soon. The current prices received balance in the US Philadelphia Fed manufacturing survey turned negative (equivalent to sub-50 in PMI terms) in April, the weakest reading since the 2020 recession.

Global goods deflation will squeeze profits and wage growth in that sector, with knock-on effects on services demand, pay pressures and pricing.

Central bankers are once again asleep at the wheel, pursuing procyclical polices that amplify economic volatility and impose unnecessary costs.

Current monetary stagnation implies that policy-makers’ worries about a sustained inflation overshoot are as misplaced as their deflation panic in 2020 when money growth was surging.

UK annual broad money growth peaked in February 2021. It should be no surprise that annual inflation was still riding high in February 2023, based on the “monetarist” understanding of a roughly two year lead. 

Annual money growth, however, collapsed after February 2021. Non-financial M4 rose by 2.4% in the year to January and by only 0.9% annualised in the latest three months. 

A consensus concern is that a coming inflation decline will fail to return it to target – one informed commentator expects stickiness at about 4%. No explanation is offered of how such a scenario is compatible with barely growing broad money. Is velocity expected to pick up, against its long-term downtrend? Or is 4% inflation projected to coexist with economic contraction of 3% pa – the implication if money growth runs at 1% pa and velocity is stable? 

The collapse in annual money growth closely resembles a decline over 1990-93, following which annual core RPI inflation fell below 2% in H2 1994, consistent with a core CPI rate (unavailable then) of about 1% – see chart 1. 

Chart 1

Chart 1 showing UK Core Consumer / Retail Prices & Broad Money (% yoy)

The push-back to a similar scenario now is that the unemployment rate is much lower than at the start of the 1990-92 recession. Average earnings growth, however, was significantly higher then – the annual increase in total pay was above 10% (three-month moving average) when the recession started versus below 6% now. Private pay momentum is already slowing despite limited labour market cooling to date – chart 2. 

Chart 2

Chart 2 showing UK Average Weekly Regular Earnings (% 6m annualised)

The 1991-1994 inflation plunge, moreover, occurred despite upward pressure on import prices from a 12% drop in the effective exchange rate between 1990 and 1993 (calendar year averages). There is no such currency headwind to an inflation decline now. 

Annual core CPI inflation rose in February but three-month momentum remains well down from its May 2022 peak – chart 3. Commodity prices signal a coming slowdown in food inflation – chart 4 – while energy prices will soon be falling year-on-year. The February inflation result is irrelevant for assessing 2024-25 prospects and the MPC should ignore it. 

Chart 3

Chart 3 showing UK Core Consumer Prices ex Policy Effects* *Ex Energy, Food, Alcohol, Tobacco & Education Adjusted for VAT Changes

Chart 4

Chart 4 showing UK Producer Input Prices of Imported Foods & FAO Food Price Index (% yoy)
Image of human hand stacking generic coins over a black background with hexagonal golden shapes. Concept of investment management and portfolio diversification.

As discussed recently, inflation will be supported by low unemployment in 2023. This could be described as a classic inflation gap, as we expect a wave of salary adjustments persisting well into 2023.

Many important factors will keep unemployment at low levels. These include:

  • Demographics, especially in the U.S. where more and more Baby Boomers are accelerating their exit from the workforce, following a difficult COVID period.
  • Many developed countries halted immigration during COVID, causing backlogs compared to normal intakes.
  • Long COVID among many workers has been keeping them out of the workforce for lengthy durations.

As economic data comes out, high interest rates are beginning to affect the economy, as reported by the recent consumer price index (CPI) report. Weakening demand mixed with higher costs will weigh on corporate profits in 2023. The good news is Global and EAFE Small Cap valuations are at their lowest since the 2008-2011 period. These low valuations could provide stock price support as corporations reduce their profit guidance. As well, sentiment is at multi-year low and can only improve.

So, where to position in an economic downturn? Warren Buffet once famously asked, “What was the most popular chocolate bar in 1962?” Snickers, he answered. And what was the most popular chocolate bar in 2020? Snickers. Focus on what is resilient is the moral of this story.

The second anchor in a downturn is balance sheet strength as interest expense for many corporations start to rise. Recent Federal Reserve statements forecast a lengthy period of elevated interest rates. And the recent Carvana debt debacle will not be the only one. We certainly feel that many companies and analysts are too conservative in their medium-term (i.e., two year) interest rate outlook.

A third anchor relies on themes and long-term positive industry trends. Stocks with high exposure to critical, well-supported trends (renewables or onshoring, for example) will certainly help weather markets suffering from consumer demand decelerations.

Our portfolio companies hold substantial net cash war chests, and they have important M&A growth options during a slowdown. Let’s have a closer look at some holdings.

Several of our firms have net cash as a percentage of their market cap at a level greater than 10%. These include: Mabuchi Motor Co., Ltd. (37%), LINTEC Corp. (28%), SEGA SAMMY Holdings Inc. (17%), THK Co., Ltd. (12%), and Globus Medical, Inc. (11%). In addition, Ain Holdings Inc., Sakata Seed Corp. and Daiseki Co., Ltd. are all at 10%. This is only a short list of holdings at or above the 10% mark. Many of our companies have simply no debt.

What is even more reassuring is that a variety of tailwinds benefit our holdings. Let’s take SEGA SAMMY (6460 JT) for example. The Japanese gaming provider has transformed into an integrated entertainment powerhouse. Born from gaming, Sega’s Sonic the Hedgehog brand has been featured in movies, including a recently launched Netflix animated series. Additionally, the entertainment company’s newest 3D Sonic game, Sonic Frontiers, has sold more than 2.5 million copies worldwide since its launch in early November.  

Mabuchi Motor (6592 JT), the leading small motor provider out of Japan, is flush with cash and has no requirement of large expansion capex. Small motors are growing faster than many industrial markets due to increased demand for robotics. Moreover, the market in which Mabuchi operates is highly fragmented. The company can certainly use its cash for highly accretive acquisitions in the future.

At 11% net cash, Globus Medical is a quality anomaly in the medical technology world. The U.S.-based provider of orthopedic devices and robots is clearly a technology leader. Its surgical robots increase productivity four-fold in terms of successful back surgeries. As the company will ultimately see a peak penetration for its robots, it will be in a strong position to accelerate new innovations either by development or acquisitions.

Many of our companies demonstrate three key attributes:

  • product resilience,
  • positive tailwinds, and
  • balance sheet strength.

Product resilience can come in many forms and can be found in types of business models: Software as a Service (SaaS), maintenance services, and long-term fixed agreements, just to name a few. Global Alpha initiated in Reliance Worldwide Inc. (RWC AU). The Australian company is a leading provider of emergency plumbing equipment sold through global retailers such as Home Depot and Lowes. Reliance Worldwide’s sales performed well during the 2009 real estate collapse, and we feel its sales will hold up equally well in current market conditions.

Net cash is not the only way to uncover balance sheet strength. One of our holdings, Meliá Hotels International (MEL SM), recently went through an asset valuation analysis with CBRE. The Spanish hotel owner and operator is presently benefiting from strong volumes from its quality portfolio of hotels. The CBRE valuation of real estate assets came in at € 4 billion. This is against a debt level of € 1.3 billion and a market cap of € 1.1 billion.


The major fiscal tightening announced by Chancellor Hunt in the Autumn Statement was motivated by a markedly more pessimistic OBR assessment of medium-term prospects for the economy and public finances. Even if its latest forecasts prove “correct”, revisions on this scale between six-monthly forecasting rounds are questionable and result in undesirable volatility in policy-making.

The economic outlook has deteriorated since the March Budget but the OBR’s fiscal assessment is based on the projected level of potential output four to five years ahead. This relies on assumptions about trends in productivity and labour supply and should be little affected by the prospect of a near-term recession.

The OBR has revised down its projection for potential output growth over the forecast horizon by a whopping 1.7 pp since March, mainly reflecting an assumed hit to productivity from energy prices staying high over the medium term. An associated loss of receipts accounts for almost a third of the £75 billion upward revision to borrowing in 2026-27 based on unchanged policies.

The OBR ignored the productivity implications of high energy prices in March on the grounds that it was unclear whether they would persist. The outlook is no less uncertain now yet the OBR has chosen to incorporate the full hit. A better approach would be to phase in adjustments over several forecasting rounds, varying the pace depending on energy price developments between rounds.

The most significant forecasting change since March was a substantial upward revision to the path of interest rates, with Bank rate and long-term (i.e. 20-year) gilt yields now averaging 4.4% and 4.0% respectively between 2023-24 and 2026-27, versus 1.5% for both previously. An increased debt interest bill accounts for £47 billion of the £75 billion boost to 2026-27 borrowing.

The interest rate assumptions are derived from market rates but they are clearly inconsistent with the OBR’s economic forecasts – particularly its projection that the annual change in consumer prices will turn negative in Q3 2024 and remain below zero for a further seven quarters.

Chart showing UK CPI Inflation & Bank Rate Actual & OBR Forecasts / Assumptions

The MPC’s latest forecasts show CPI inflation falling below target two to three years ahead if Bank rate remains at the current 3.0%*. An assumption of a 3.0% average for Bank rate is a more sensible basis for the medium-term fiscal forecast. If long-term gilt yields were also to average 3.0%, the interest bill in 2026-27 would be £21 billion lower than the OBR has projected, according to its debt interest ready reckoner. This is equivalent to three-quarters of the extra tax raised in 2026-27 from measures announced in the Autumn Statement.

A possible interpretation is that Chancellor Hunt has been bounced into unnecessary fiscal retrenchment by a combination of a questionable downgrade to the OBR’s productivity projection and its punctilious adherence to a forecasting convention – of using yield curve-derived interest rate assumptions – that made little sense in the context of recent stressed markets.

Chancellor Hunt, however, may have had an incentive to collude with the OBR’s doom-mongering, since it has allowed him to “kitchen sink” fiscal bad news in the reasonable hope that another OBR forecasting swing will open up space for him to reverse course and announce tax “cuts” before the next general election.

*CPI inflation falls below 2% in Q2 2024 in the MPC’s modal (i.e. central) forecast and in Q3 2025 in its mean forecast (which incorporates a risk bias to the upside).