It’s no secret that public finances in most of the markets Global Alpha covers are in a dire state, and one of the common culprits is usually pensions and other retirement benefits. Countries such as France and Italy spent roughly 15% of GDP over each of the last two years and are on average the second largest item after health care. Many countries are having to increase retirement age to alleviate the strain, and less than 30% of Gen Z expect to retire with similar retirement benefits than older generations.
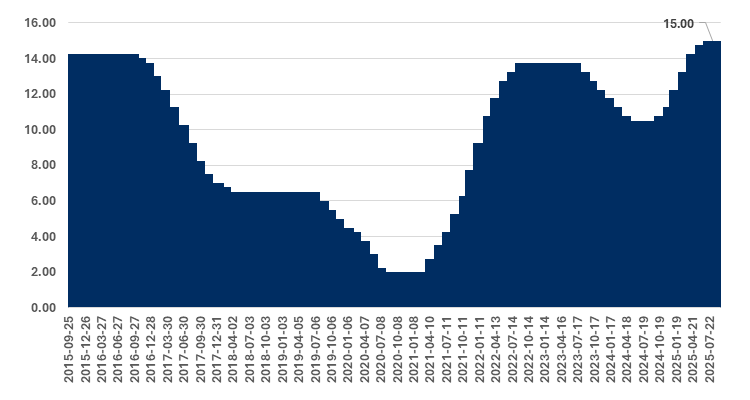
In the 90s, Australia took its own unique approach to ensuring retirement-system sustainability through the development of the superannuation system. It is a mandatory savings scheme where employers are required to fund a minimum percentage of an employee’s salary into a superannuation fund on their behalf. Employees are then able to invest the amount on their own if they choose to and start withdrawing it at 65. This simple approach created one of the largest pension systems in the world with $4.1 trillion in assets, where employers contributed $147 billion in the last year. The Super Guarantee threshold, the percentage of salary employers must deposit, has once again increased this year to 12%.
Given the high expected retirement assets, it’s no surprise that Australian retirees have had a willingness to tolerate higher risk in their asset allocation while asset classes like annuities have seen a lower adoption rate compared to other developed economies. While the population is overall still young compared to the United States, there is a growing concern among experts that too much risk is being taken by individuals that cannot afford it. Regulators and policymakers in recent years have taken several steps to attempt to address the problem:
- Implementation of Retirement Income Covenant in 2022 requiring superannuation trustees to put additional emphasis on diversification and flexibility and increase educational resources.
- Friendlier mean-test treatment for lifetime income streams to improve middle-class retirees’ wealth and therefore reduce the need for risk-taking to reach retirement goals.
- Consultation on potential changes to capital settings and requirements for annuity products, with the aim of reducing capital intensity of insurers and allowing for more competitive pricing and supply, therefore making the product more attractive as part of an asset allocation.
We recently initiated a name that gives us exposure to this dynamic: Challenger Limited (CGF AU). The company operates both an APRA‑regulated life division (annuities and related longevity solutions) and a multi‑manager funds management arm (Fidante and Challenger Investment Management). Challenger manages $130 billion in assets.
As mentioned, annuities as an investment product in Australia has some of the lowest adoption rates of all developed countries at 2% vs. 15% for Japan and 20% for the United States. While some of this difference can be explained by demographics, the reality is that regulatory capital intensity for annuity providers has been much higher than other countries (meaning their pricing ends up worst) and education on the product has been lacklustre. What piqued our interest in the Challenger story is that the Australian Prudential Regulation Authority (APRA) has announced steps to address these problems as it seeks to encourage workers to include an annuity allocation in their retirement savings account. Some of the steps proposed by APRA to reduce capital intensity are now clearer. In 2025, APRA confirmed a consultation to change the treatment of the illiquidity premium, with the stated intent to lower capital requirements for annuity products when risk controls and asset‑liability matching are robust. If implemented as outlined, this would make pricing more competitive and broaden supply without compromising solvency standards.
As the dominant player in the annuity market, with a market share estimated around 90-95%, Challenger has been one of the more influential and proactive companies in providing feedback to the regulators and there are reasons to believe that regulators are using Challenger’s data to evaluate the impact of potential changes.
Even without betting on regulatory changes, Challenger has plenty of things going for it. The core annuity business in Australia is growing nicely as they are consistently landing new mandates with super annuities (which are being urged to provide their members with more guaranteed income products), the annuity book duration is increasing (allowing for higher margin/investment return), their unique Japan exposure is showing strong momentum (and they are expected to land another distributor in the near future) and the firm is launching new products both on the annuity and investment side which appear to be showing initial success.
One of the advantages of taking a global view on investing is that it allows us to find differentiated stories in a space we typically would not be overly excited about. Life insurance companies in Europe or the United States tend to exhibit bond-like features, being highly defensive and providing decent cash-flow. Meanwhile, Australia built one of the most successful retirement savings engines globally and is set to benefit from a large demographic tailwind that should see life insurers like Challenger benefit over the next decade, in addition to having regulatory tailwinds and policymakers’ support.