Small caps are earning another look

This is the second in a two-part series on small caps. Last week, we looked at historical small caps performance, recent small caps performance and the reasons behind the unexpected. This week, we dive into what this means for allocators and skeptics.
Small caps have captured the attention of allocators, what with their outperformance of large caps, their durability through economic surprises and the access they offer outside of the crowded top ten mega caps. How does this information impact portfolio allocations?
Implementation: where the allocator’s choices can make a difference
The case for small caps is strongest when implementation is treated as part of the allocation decision. In a broad and inefficient universe, choosing active over passive, quality over the index, and a global opportunity set can make a meaningful difference. What needs to be considered when it comes to portfolio allocation?
Active over passive
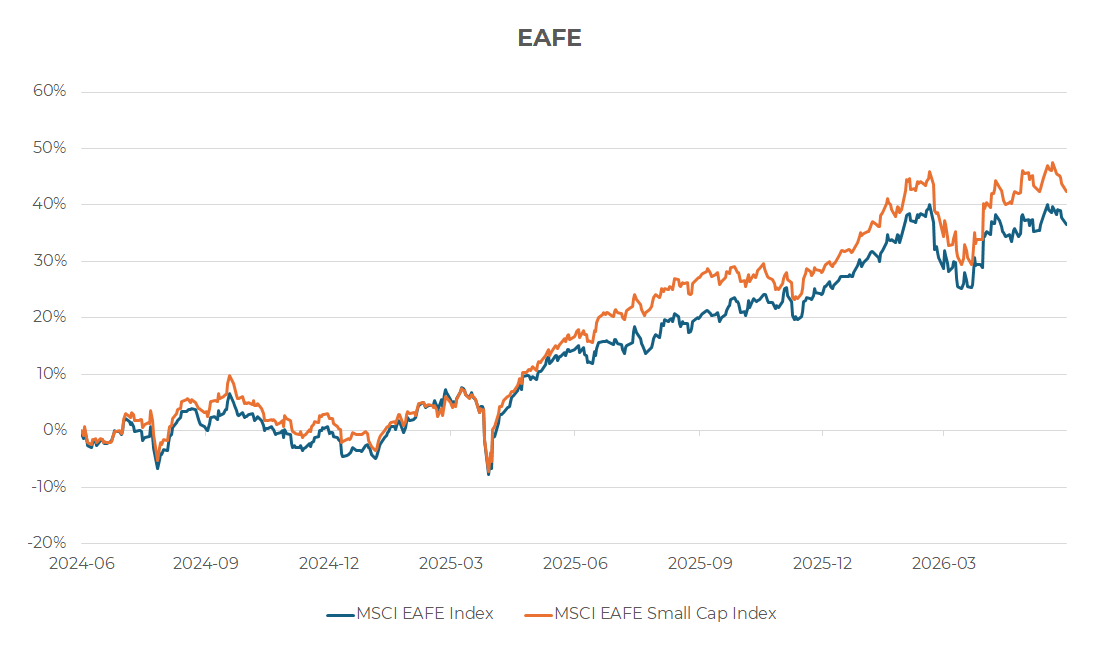
We’ve previously discussed eVestment peer universe data showing the median active manager added value in Global and EAFE small cap. As of May 31, 2026, according to eVestment peer universe data the median EAFE small-cap manager has delivered 1.75% higher returns than the MSCI EAFE Small Cap index, since the inception of our respective strategies.
BofA Global Research notes that small-cap active managers have posted better hit rates than large-cap active managers in seven of the last 11 years through 2025. The opportunity set supports it: BofA shows the long-run annualized Quintile 1 versus Quintile 5 spread for the FCF/EV factor within the Russell 2000 is approximately 20 percentage points, versus 7 within the Russell 1000.
Quality over the index
As we argued in our December 2025 commentary, “Time to take out the trash – Why high ROE matters in the long run,” the global small-cap universe contains over 12,000 names and the dispersion between the best and worst businesses is enormous.
Global breadth, with a regional lens
EAFE small caps are, in our view, the strongest within-asset-class call today. The European valuation gap to long-term averages is wide, the regional economies are at different points in their cycles, and the structural themes – German fiscal deployment, European industrial policy, Japanese reform – sit disproportionately in this universe.
Four objections to small caps, and what the evidence actually shows
If the historical evidence supports investing in small caps, and allocators have the opportunity to actively make a difference within portfolios, why aren’t small caps more heavily weighted? The four objections below come up most often in our conversations with allocators.
« Small caps are too volatile in this environment. »
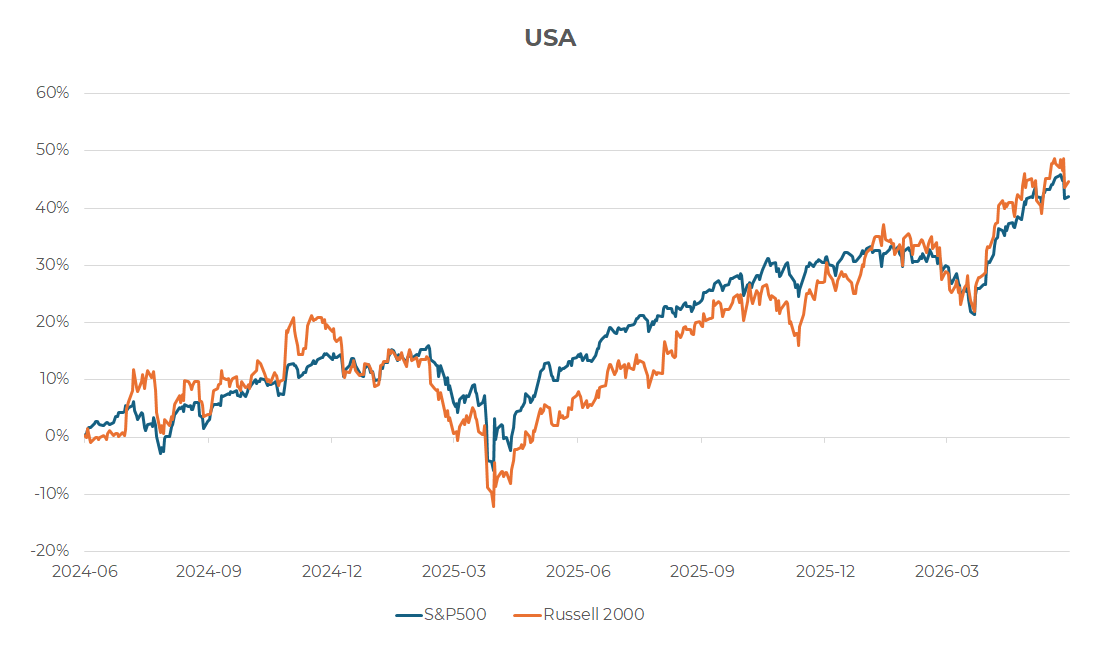
But BofA Global Research’s May 2026 data documents that the realized volatility of the Russell 2000 has been lower than the S&P 500 during this decade’s worst weeks – a reversal of the prior pattern. The same has held year to date through the Iran war, and through several recent stress episodes (Brexit 2016, Taper Tantrum 2013, COVID 2020, tariffs 2025).
Reality is the dispersion in S&P 500 names has compressed as concentration has risen, while small-cap volatility no longer carries the size premium it once did. Volatility is no longer the reason to avoid the asset class.
« The small-cap index has become a junk bucket of non-earners and unprofitable biotechs. »
This was true through 2022. It is becoming less true. The median ROE of the Russell 2000 has been rising off multi-decade lows, the share of non-earners has begun to decline, the Russell 2000 saw more upgrades to the Russell 1000 than downgrades in the 2023 and 2024 rebalances and the share of US IPOs with negative earnings has fallen from roughly 80% during the 2020–22 bubble to approximately 60% year to date.
The S&P 600, which applies a profitability screen, currently has only about 10% non-earners against approximately 32% in the Russell 2000 – a structural choice available to any allocator concerned about index composition. As we argued before, high-ROE small caps have, over multi-year horizons, materially outperformed their lower-quality peers; quality selection is the answer to this objection, not avoidance of the asset class.
« Active managers can’t beat the small-cap index – look at 2025. »
2025 was the worst year on record for active small cap managers, with roughly 15% beating the Russell 2000 (BofA). It was also one of the most extreme low-quality rallies of the past decade. Active small cap managers tend to be structurally tilted toward quality, which is precisely the wrong tilt during a junk-led move. The longer-run picture is different. As above, active small cap managers have posted better hit rates than active large cap managers in seven of the last 11 years. The 2025 episode is best understood as an extreme drawdown in a strategy that has otherwise compounded reliably, not as evidence that the asset class is too efficient for active management.
« We should wait for rate cuts before adding small caps. »
Two pieces of evidence cut against this. First, per Kepler Cheuvreux, the historical correlation between European small-cap relative performance and the German Bund yield has materially weakened since early 2025. The asset class has been outperforming through rising rates, not waiting for them to fall. Second, per BofA, what matters more for small-cap performance than rates per se is the corporate profits cycle: in periods of accelerating EPS growth, US small caps have averaged 18–19% annual returns regardless of whether GDP was accelerating or decelerating, with the highest average and best hit rate in accelerating EPS combined with decelerating GDP.
The current Russell 2000 forward P/E of approximately 16.9x implies roughly 8% annualized 10-year returns based on the historical regression (BofA, R-squared 0.46). The setup does not require a particular rate path to work.
The case against small caps often rests on backward-looking assumptions: higher volatility, weaker quality, poor active outcomes and rate dependence. But recent evidence is showing us that those assumptions need to be revisited.
Sizing: the wrong question, asked the right way
Clients regularly ask how much small cap is the right amount. In our September 2025 article, “Why small caps are built for what’s next,”* we shared that our typical recommendation falls between 5% and 15%, and the precise figure matters less than the choice to size the allocation meaningfully in the first place. A four-asset mean-variance optimization on EAFE and US large and small caps – using eVestment median manager returns from January 1999 to June 2025 – produces an efficient frontier on which an all-large-cap portfolio does not sit. The closest efficient point combines roughly 30% small caps with 70% US large caps at the same volatility level, with higher expected returns. The number will vary with assumptions; the qualitative conclusion does not.
The harder question for most allocators is not 5% versus 15%. It is whether the strategic underweight that has accumulated over a decade of large-cap dominance gets revisited at all. The structural arguments stand on their own.
The recent evidence – small-cap outperformance through a genuinely difficult macro backdrop, broad-based across sectors, decoupled from bond yields, supported by a valuation gap that has if anything widened, and an index whose quality composition is improving from its 2022 lows – reinforces the timing. The objections can keep coming, but we can see through them with evidence-backed rebuttals. Allocators can make a clear difference. We think the case for revisiting the underweight is as clear as it has been in years.
Global Alpha was founded on the conviction that small caps are an inefficient asset class in which an experienced team can generate alpha across a full cycle. We are happy to discuss how a small-cap allocation can be sized within a particular plan’s constraints, and how our Global and International Small Cap strategies have navigated the recent environment.
* Contact us for a copy of this article.