Dear Clients and Colleagues:
Last week, the Lunar New Year was celebrated in Asia and beyond, and we entered the Year of the Tiger. Additionally, the 2022 Winter Olympics commenced in Beijing. As Asia appears more in headline news these days, you may wonder how it has been doing during the pandemic. The short answer is: resilient. Asia remains the fastest growing region in the world.
In 2020, global GDP contracted by 3.3% year-over-year, while Asia contracted by 1.5%. For 2021, the International Monetary Fund (IMF) forecasted that global GDP would grow 5.9%, while Asia would grow faster at 6.5%, including Hong Kong at 6.4% and Singapore at 6%. China grew 8.1% in 2021, and is expected to continue leading the Asian growth.
However, in the short term, Asia undoubtedly still faces many challenges.
- China: Although China rebounded strongly last year, thanks to robust exports, there are signs of fading momentum due to weakening consumption and a property downturn. The zero-COVID policy may continue to cause lockdowns that hurt local economies.
- Slow COVID recovery: Although the vaccination rate is increasing in many Asian countries, the rise in new COVID cases, along with other supply chain issues, are causing production disruptions. Many countries are seeing an increase in cases following Lunar New Year celebrations. In Japan, where cases have reached record highs, the Prime Minister announced today the extension of its COVID-19 quasi-state of emergency in Tokyo and 12 prefectures; the restrictions are extended for three weeks, until March 6.
- High debt burden: The Federal Reserve System’s (Fed) interest rate increase trajectory will add financing pressure. The debt in Asia has increased significantly in the past 15 years. Back in 2007, Asia accounted for about 27% of global debt. In 2021, it accounted for almost 40% of global debt.
Geopolitical tensions: The rise of China has complicated the old post-World War II international order by challenging the United States’ (U.S.) dominance in Asia. Tensions between the U.S. and China have been escalating for years, with Taiwan being the key issue. There is no sign of easing from both countries.
However, looking forward, the future of Asia’s growth remains bright.
- High consumption growth: According to McKinsey, by 2030, Asian consumers are expected to account for 50% of global consumption growth, representing a $10 trillion opportunity, driven by rising incomes and changing consumption habits.
- Closer intra-Asia ties: The Association of Southeast Asian Nations (ASEAN) is a priority in China’s foreign policy. Since 2009, China has been ASEAN’s largest trading partner. In 2020, ASEAN became China’s largest trade partner for the first time, overtaking the European Union (EU). Regarding Foreign Direct Investment, China is ASEAN’s fourth largest source, after the U.S., Japan, and the EU.
- Accelerating digitization: Asia continues to vividly embrace the new digital world with Internet users far exceeding numbers in other regions. The trend is easily reflected by a high penetration of e-commerce, widespread e-payment systems, and active innovation carried out by companies.
- Vigorous R&D investment: Asia is the largest R&D investing region in the world, with more than 44% of the global R&D share, mainly due to the escalating investment by China’s government, industries, and universities.
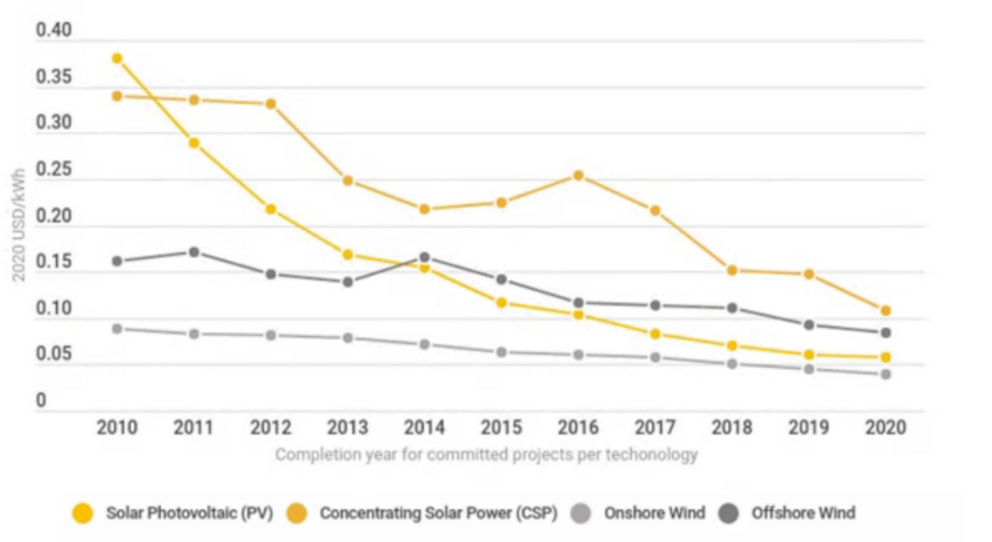
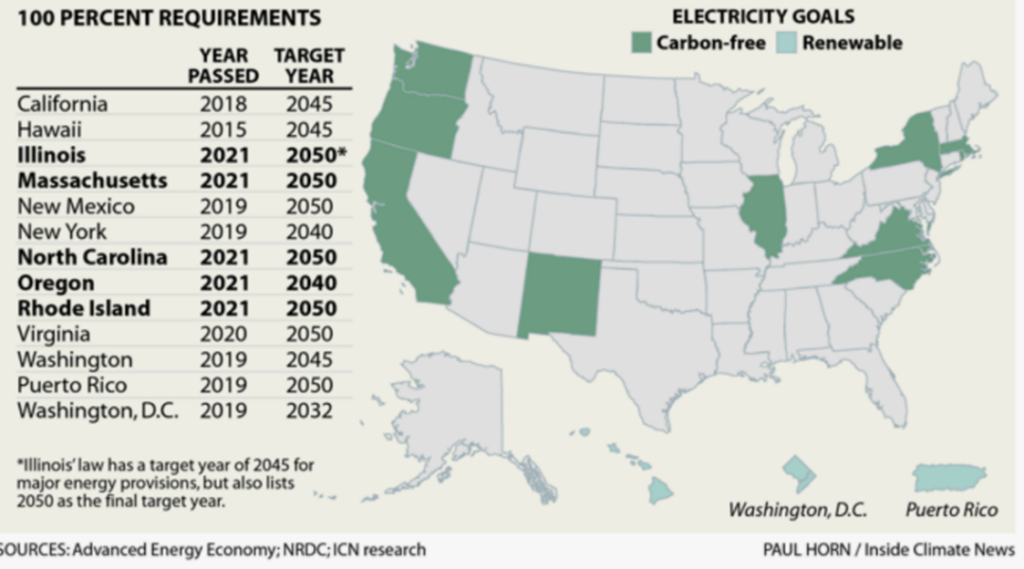
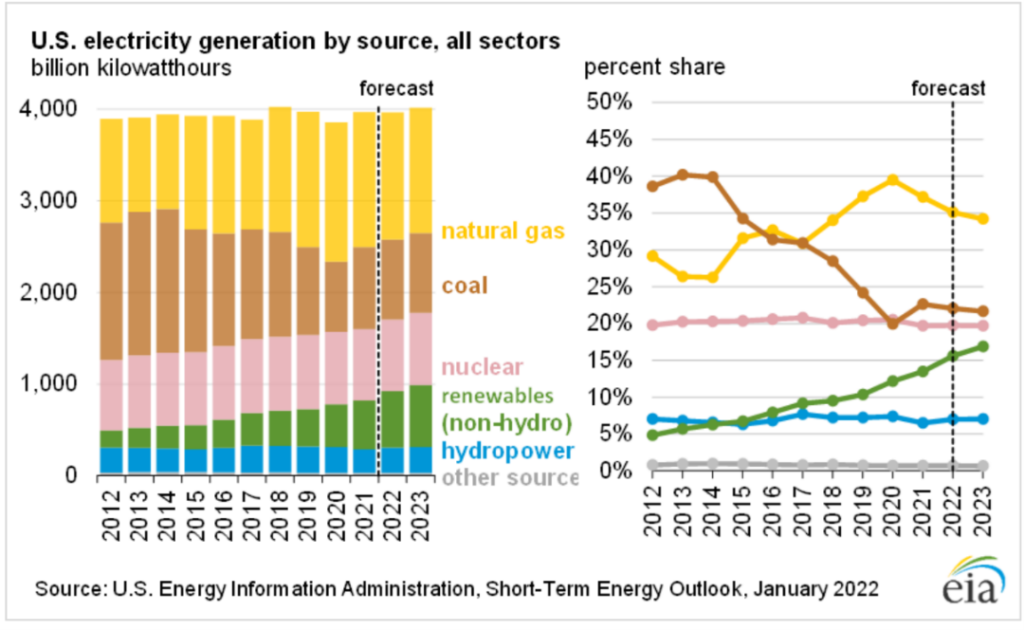
- Renewable energy boom: Among the world’s installed renewable capacity, Asia has the largest share at 45%, vs. 25% in Europe, and 16% in North America, according to the International Energy Agency. Asia is also expected to account for 64% of new renewable capacity additions globally between 2019 and 2040.
At Global Alpha, Asia has been a very important market for our investments. It carries about 20% of the weight in the global small cap strategy, 45% in the international small cap strategy, and 75% in the emerging market small cap strategy.
The valuation of Asian Small Caps is cheaper than peers in the U.S. and Europe. Based on the MSCI index data, as of January 31, 2022. Forward P/E of MSCI AC Asia Small Caps is at 12.8, vs. Europe Small Caps, at 15.8 and U.S. Small Caps, at 18.6.
Our top three holdings in Asia are a good representation of diversification by region and sector, benefiting from the secular growth trends of consumption and healthcare.
L’Occitane (973 HK)
L’Occitane is a global retailer of skincare and beauty products made with natural and organic ingredients. Originally from France, it is a truly global player present in over 90 countries and 3,000 retail locations. Its key brands are L’Occitane en Provence, Elemis, and Limelight. Recently, it acquired Sol de Janeiro, an innovative leader in the global premium body care market, inspired by the Brazilian philosophy of self-love and joy. L’Occitane’s sales have surpassed the pre-pandemic level and last month, it raised full year revenue and profit guidance. We expect consistent growth, margin expansion, and synergies through sharing distribution channels and product development know-hows.
Sega Sammy (6460 JP)
Sega Sammy is a Japanese entertainment company established through the merger of the game maker Sega and pachinko machine maker Sammy. It provides comprehensive products, including commercial video game machines, home video game software, and pachislot and pachinko machines. The company has many video game IPs. For example, Sonic the Hedgehog’s all time unit sales exceeded 1,380 million globally. Other popular titles include the Total War (37.8 million unit sales) and the Puyo Puyo series (35 million unit sales). There are a few exciting catalysts in 2022: the movie Sonic the Hedgehog 2 will be released on April 8, 2022; Sonic the Hedgehog animated series will be on Netflix; and a new title, Sonic Frontier, will be released in the winter of 2022.
Raffles Medical (RFMD SP)
Raffles Medical is a leading private healthcare group in Asia, with primary care, inpatient care, and specialist care. It was the first healthcare group in Asia to join the Mayo Clinic network back in 2015. The company has one hospital, and more than 60 clinics in Singapore, and three hospitals in China. Although the pandemic reduced regular patient visits, thanks to its excellent reputation, the company was chosen by the Singaporean government as the only healthcare provider to conduct COVID-19 screenings at the Changi Airport. It also provides COVID-19 PCR and serology testing and runs several vaccination centres in Singapore. We expect its China business to become the main growth driver going forward.
Have a nice week.
The Global Alpha team
1 World GDP 196 0-2022 | MacroTrends
2 IMF downgrades its growth forecast for Asia, says Covid still ‘ravaging’ the region (msn.com)
3 Coronavirus cases spike across Asia after Lunar New Year celebrations | LA Times
4 Japan to extend COVID-19 curbs for 13 regions by three weeks | Reuters
5 IMF says the Fed’s rate hikes will ‘definitely slow down Asia’s recovery’ (msn.com)
6 Meet your future Asian consumer | McKinsey
7 China and ASEAN: Flourishing at 30 | ORF (orfonline.org)
8 Global R&D investments unabated in spending growth – Research & Development World (rdworldonline.com)