While the focus of inflation is typically centered on rising raw material costs and wage increases, we are seeing transportation costs become an additional and significant part of the inflation problem, and one that is not as easily passed on to consumers.
Transportation affects every aspect of a company’s supply chain and the rising costs are unavoidable. Further, it has been a recent topic of conversation for our own holdings, as well as some of the largest companies in the world. At a recent conference, Molson Coors, the fifth largest brewer in the world, said transportation costs are the main contributing factor to inflation, while Proctor and Gamble warned that an announced price increase will not be enough to offset higher commodity and transportation costs due to not only the size, but the speed of the increases. Multinational conglomerate 3M is a good barometer, as it is seeing “a lot of pressure on logistics costs.” Dollar Tree is one of the largest retail importers in the United States (US) and at their recent quarterly earnings presentation, they spent a considerable amount of time discussing the global supply chain and higher freight costs, saying they were “not counting on material improvements in 2022, especially in the first portion of the year.”
The recovery from the pandemic has seen a huge increase in demand, but with continued quarantine controls, distancing measures at ports and labour shortages are causing severe backlogs. The Suez Canal blockage and summer typhoons off the Chinese coast did little to ease the problem. Another consideration is the consolidation of ocean shipping lines’ key shipping routes being dominated by a handful of companies, causing fewer vessels in general to be travelling between ports.
The ocean carriers have responded to the high demand by increasing container capacity by 22%, but this does not solve the problem of logjams and the waiting lines reaching record levels at some of the ports.[1] The order book for container ships has doubled in 2021, but the majority won’t be delivered until 2023.
So what does all this mean? Container rates seem to be stabilizing, yet remain extremely elevated. Freightos, a digital booking platform for international shipping, published containerized freight rates. The cost of a container from Asia to the US East Coast is over $20,000, an increase of 415% compared to last year. Shipping from Asia to the US West Coast is slightly less, but the cost is up 452% in comparison to a year ago. Shipping from Asia to North Europe has seen the largest year-over-year increase, up 714% to $13,855. Freight rates from Northern Europe to the US East Coast have been the least affected, up “only” 238% from the period last year to $5,929. In view of these rates, shipping companies are focusing on the most profitable trade routes, meaning reduced volumes crossing the Atlantic. The Baltic Dry Index is a benchmark for the price of shipping major raw materials by sea and is at its highest level since before the Great Financial Crisis.
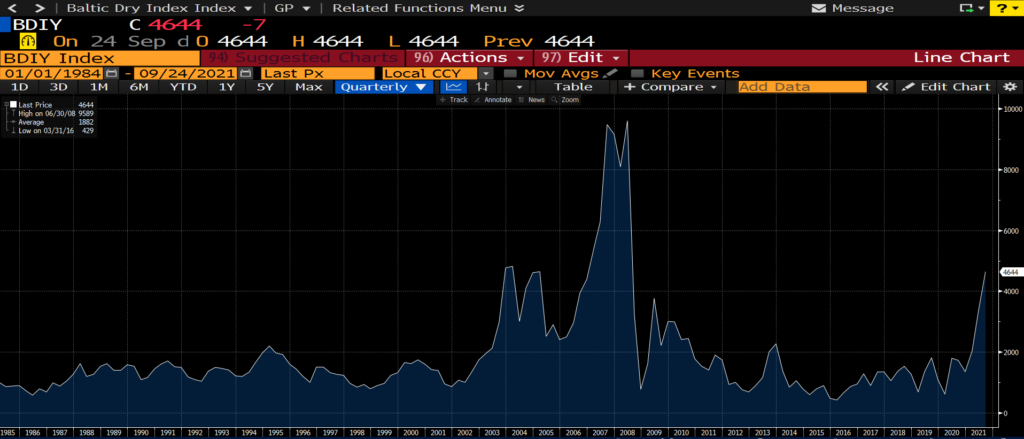
Source: Bloomberg
The majority of companies are struggling to solve this logistical headache, but our portfolios contain two names that have been natural beneficiaries.
Clipper Logistics (CLG.LN) is a leading provider of value-added logistics solutions, e-fulfilment, and returns management services to the retail sector, primarily in the United Kingdom (UK), but with an expanding presence in Europe. Sales are comprised of the following: 60% of sales come from e-fulfilment and returns management, supporting the online activities of customers; 28% of sales come from non e-fulfilment businesses, supporting traditional brick and mortar customers; and the remaining 12% of sales comes from commercial vehicles sales. Of the logistics related revenues, 85% comes from the UK. Over 90% of Clipper’s contracts are on an open book basis (i.e. cost plus), or hybrid contract, protecting them from increasing costs. However, they are not immune to labour shortages, as they recently flagged the impact that a shortage of HGV drivers is having.
Kerry Logistics (636.HK) is a third-party logistics service provider based in Hong Kong with global exposure. The company provides many supply chain solutions, including integrated logistics, international freight forwarding (air, ocean, road, rail, and multimodal), industrial project logistics, cross-border e-commerce, last-mile fulfilment, and infrastructure investment. Revenue mainly comes from Asia-Pacific, which accounts for 74% of sales (Mainland China 32%, Hong Kong 13%, Taiwan 7%, and other Asia 21%). The Americas accounts for 16% and Europe about 10%. Their customers are mainly big multinational companies, across many industries, including fashion, electronics, food and beverages, FMCG, industrial, automotive, and pharmaceutical.
Perhaps the best advice we could give readers is that with supply chain and transportation issues showing little signs of abating, you would be wise to start your holiday shopping sooner, rather than later.
[1] https://splash247.com/more-than-40-ships-waiting-outside-la-and-long-beach-setting-new-record/