After the “meme stock” frenzy of 2021 and a bruising surge of volatility in 2022, many investors assumed retail traders had finally stepped back. The story was neat: higher rates, tighter liquidity and fading stimulus would restore rationality to equity markets. We were not convinced and argued in February 2023 that speculative behaviour was more likely to adapt than disappear.
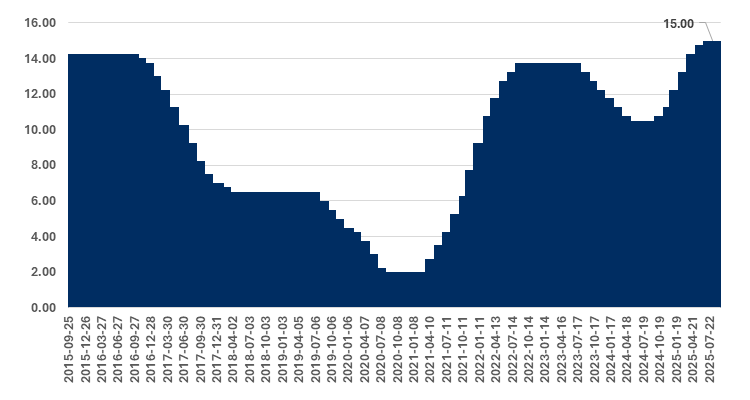
Fast forward to today, and the data suggest retail participation has not only persisted, it has become a defining force in short‑term market moves. Across the small‑ and mid‑cap universes, trading volumes in lower‑priced, lower‑quality names have surged, with roughly a quarter of daily volume now concentrated in stocks trading under $5, a share last seen at the peak of 2021’s speculation. This renewed activity has driven a striking rotation beneath the surface: low ROE and even unprofitable companies have periodically outpaced their higher‑quality, high‑ROE peers over short horizons.
In this weekly, we want to address two questions:
- Why does high ROE – the best proxy for quality – matter when investing? And,
- What does history tell us about the performance of companies with high ROE versus those with low or negative ROE?
What ROE really measures
Return on equity (ROE) is net income divided by shareholders’ equity; it tracks how efficiently a business converts owners’ capital into earnings. In practical terms, it tells you how many dollars of profit a company generates for every dollar of equity on its balance sheet. Conceptually, ROE links back to basic valuation logic: for a given starting multiple, a firm that can earn and reinvest at higher rates should grow intrinsic value and future dividends faster over time. A company that compounds book value at 15–20% per year for a decade ends up in a very different place than one compounding at 5%, even if both start at the same size and valuation.
High – and sustainably high – ROE typically reflects one or more durable advantages: strong pricing power, an advantaged cost position, valuable brands or networks, or business models that require relatively little capital to grow. This is why investors often group high-ROE companies under the broader “quality” or “profitability” factor. In other words, ROE is not just a ratio; it is often a shorthand for underlying business quality.
Why high ROE wins over time
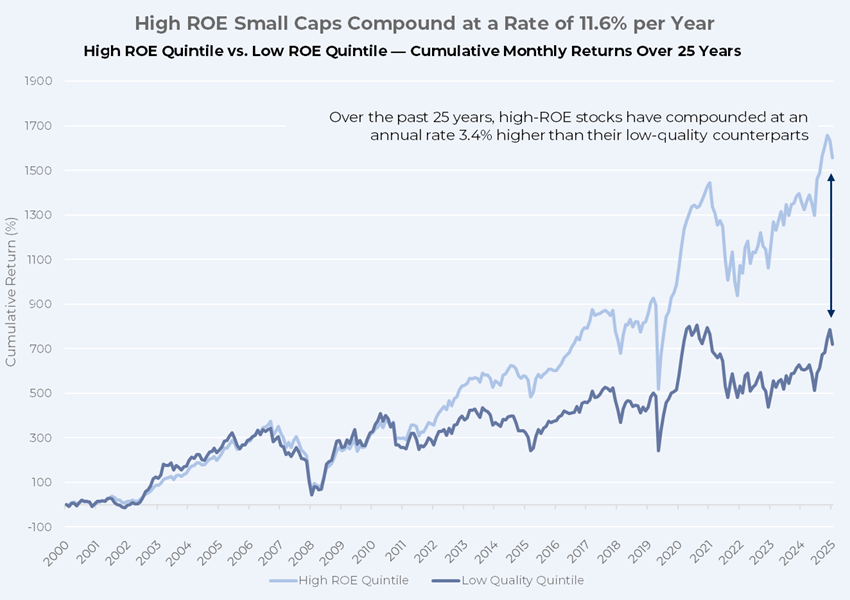
History is clear: profitability and quality matter far more over multi-year horizons than they do over six month “junk” episodes. Portfolios tilted toward companies with high and persistent profitability have historically delivered higher average returns than portfolios concentrated in low profitability or unprofitable names, even after controlling for size and valuation.
There are three main reasons for this:
- Compounding of retained earnings: High-ROE companies can reinvest a larger portion of each dollar of earnings at attractive rates. Over time, this drives faster growth in earnings per share and intrinsic value without requiring fresh capital from shareholders.
- Resilience through cycles: Businesses that earn high returns on capital usually have competitive advantages that help them sustain margins and cash flows during downturns, which tend to show up as shallower drawdowns and faster recoveries.
- Better capital allocation options: Management teams leading high-ROE franchises often have more flexibility: reinvest in the core, expand into adjacencies, pay dividends or buy back shares. Lower-quality companies, in contrast, often need to issue equity or debt simply to survive, diluting existing shareholders.
Short periods of outperformance by low-quality stocks can be sharp and uncomfortable, but they have historically been transient, while compounding fundamentals tend to dominate over longer horizons.
When you think about it, the lesson for long-term investors couldn’t be clearer: real wealth comes from investing in companies that steadily compound capital at high rates, not from jumping on every fleeting speculative surge. The junk rallies fade and quality compounding lasts.
Time to take out the trash – What really is a “junk rally”?
In a universe of over 12,000 companies within global small caps, not every balance sheet is one to admire. Our job as active managers is to find real quality – the companies that actually make money and know how to grow it – and to avoid the companies that are overleveraged, poorly managed or structurally unprofitable. Many of those “junk” businesses feel more like ticking time bombs than investments. So, what happens when these so‑called junk companies rally and drive index performance? Do we simply throw in the towel and chase them?
A junk rally is a period when the lowest‑quality stocks – often those with excessive leverage, negative earnings, high beta or heavy short interest – significantly outperform the broader market, particularly higher‑quality names. These episodes tend to be most intense and momentum‑driven in small caps, where smaller market caps and thinner liquidity allow collective enthusiasm and buying pressure to move prices disproportionately.
Junk rallies often arrive with a burst of excitement – usually from retail investors – as they rush into stocks chasing a story and paying little attention to fundamentals. To spread these stories, investors turn to platforms like Reddit, X or Instagram, using viral posts and online communities to build momentum. As more buyers join in, the rally feeds on itself, with price action attracting even more attention.
Common terms around these episodes include:
- Diamond hands: Investors who refuse to sell, convinced that holding long enough will eventually make them rich.
- Short squeeze: When heavily shorted stocks rise sharply, forcing short sellers to buy back shares to cover positions, which drives prices even higher.
- FOMO (“fear of missing out”): The anxiety investors feel when they believe they might miss a big gain if they do not act immediately.
- Pump and dump: When prices are hyped up – often by coordinated online promotion and early movers sell into the frenzy, leaving late buyers exposed when prices fall back.
These phrases rarely appear in institutional memos, but the behaviours behind them very much exist in our universe and often bring sharp, sudden volatility to stocks whose fundamentals have not changed.
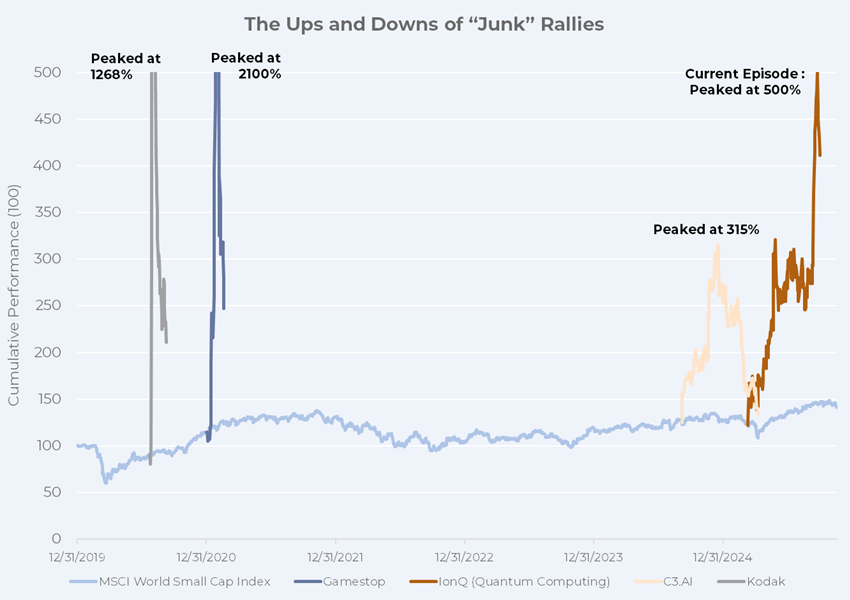
How junk rallies behave in practice
Over the past five years, we have seen several junk rallies – wild bursts where low‑quality stocks suddenly take off. Each time, two features have stood out. First, these rallies are typically parabolic and short‑lived; trying to jump on the bandwagon after the move is underway is almost always a poor risk‑reward trade‑off. Second, they almost always mean‑revert back toward the market, making them more about timing and positioning than about sustainable value creation.
Normally, we would pay limited attention to these episodes. However, because these lower-quality stocks sit in our benchmark, big, synchronized rallies in some low-quality pockets can cause us to lag temporarily. That is exactly what happened in 2020, 2023, and again in 2025, when risk on sentiment sent the lowest quality corners of the market flying while our quality growth names took a back seat. As the excitement faded and fundamentals reasserted themselves, excess junk gains unwound and quality leadership reemerged.
Proof that low quality doesn’t last
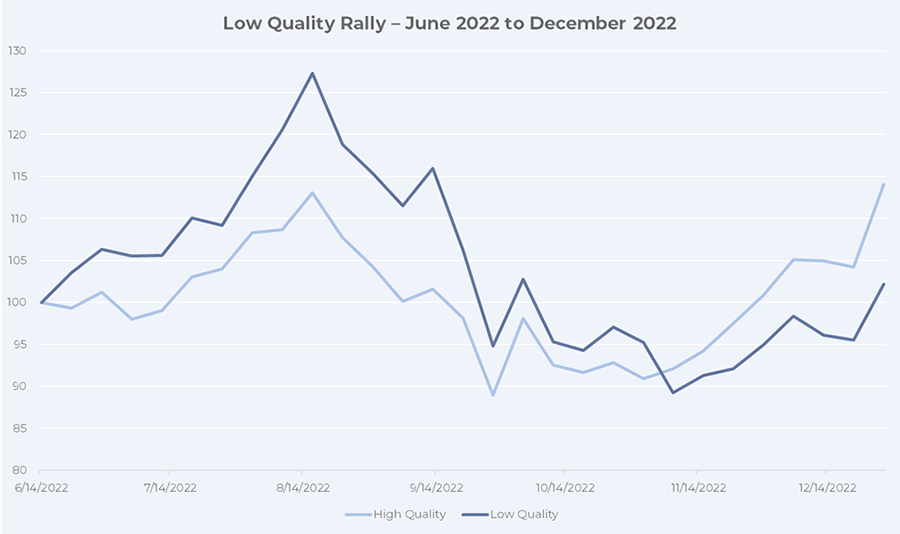
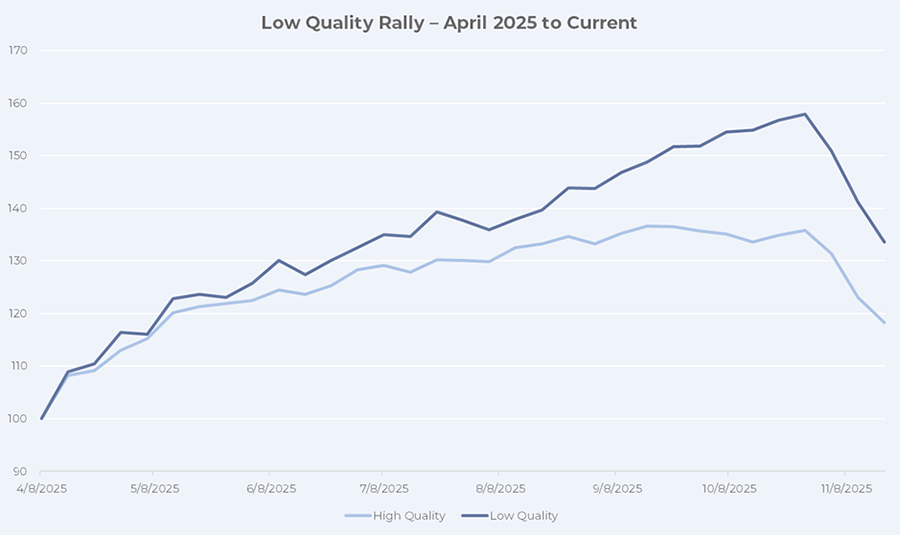
Even without decades of data, recent episodes make the point: high ROE remains a long‑run winner. In the 2022 low‑quality rally, high‑quality stocks temporarily lagged as low‑quality names spiked and then sold off, but by the end of that six‑month stretch, the high‑quality cohort had again moved ahead. You saw a similar pattern in the quality rally of summer 2024, which lost steam by early 2025, and more recently in the post‑Liberation Day rebound, where relief from macro fears and crowded positioning turbocharged the most speculative, lower‑ROE parts of the market.
Once low quality lost steam, high quality rebounded faster
Low quality was ahead, but high quality protected during Liberation Day market correction
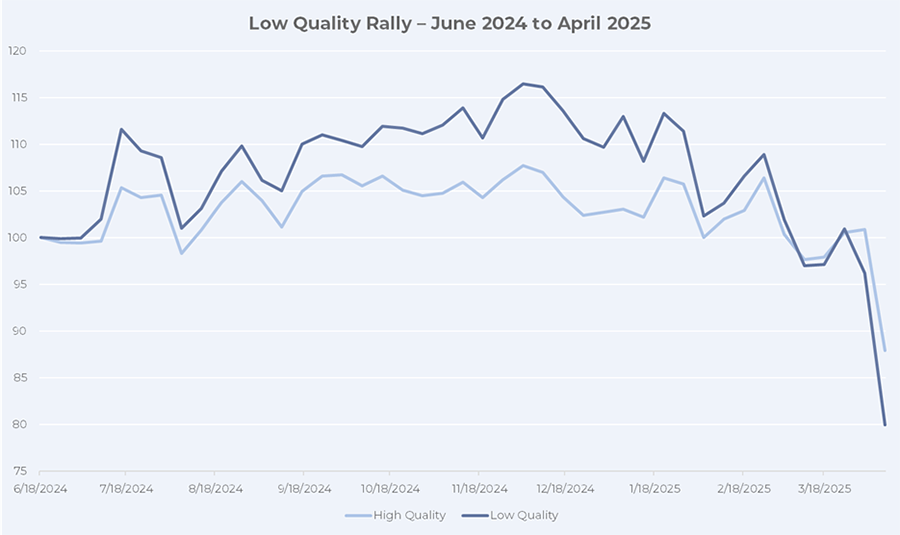
In the immediate aftermath of Liberation Day, low‑quality stocks rallied because the market shifted violently from fear to relief: investors moved quickly from pricing in severe recession and trade dislocation to betting on a softer outcome, and that swing in sentiment tends to benefit the most beaten‑up, highly levered and high‑beta parts of the market first. Positioning and mechanics amplified the move, as many lower‑quality names were heavily shorted and under‑owned going into the shock, so even a modest improvement in the macro narrative forced short covering and factor rebalancing, turbocharging returns in exactly the sort of speculative companies that typically lead junk rallies.
The current junk rally is showing signs of losing momentum, with lower-quality names starting to lag
Don’t hate the player, hate the game
Now that we’ve defined what junk rallies look like, let’s examine how they affect active management. As noted above, the post-Liberation Day period – when the MSCI World Small Cap Index surged 34.3% (CAD) between April 8 and October 31, 2025 – marked one of the strongest low-quality rallies of the past decade. During this time, market leadership – particularly in the United States – was dominated by lower-quality companies across a range of sectors. The AI and data centre trade became the theme of the year, driving performance regardless of valuations or ROE.
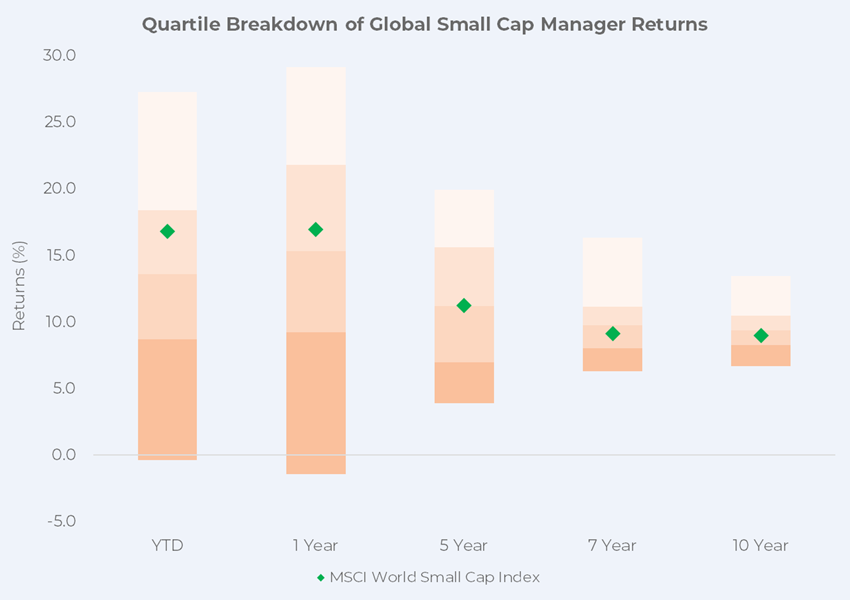
What you’ll almost never hear an investor say is that they’re overweight “junk.” It’s rare for anyone to deliberately focus on low-quality companies. As a result, low-quality rallies usually lead to short-term periods where active managers struggle to generate alpha. Looking at year-to-date and one-year returns, we’re seeing exactly that type of environment. With the MSCI World Small Cap Index ranking in the middle-to-high second quartile, about 60% of active global small-cap managers haven’t added alpha over the past year. Additionally, these periods usually come with a wide dispersion in manager returns, as portfolios with even modest exposure to the most speculative names tend to outperform sharply, while quality-focused strategies are left behind.
As we can see below, over the 7- and 10-year periods, global small caps remains an inefficient asset class – with more than 50% of active managers outperforming the MSCI World Small Cap Index.
What we’re trying to argue is that when these short periods of low quality take over, don’t hate the player, hate the game. The small cap market can be dysfunctional for short stretches, but over the long run, high-ROE companies almost always outperform their low-ROE peers.