As the first official day of the summer approaches, it finally feels like the world is getting back to normal. Many countries are now dropping Covid requirements and restrictions, such as testing, masking and quarantining. Tourists are definitely itching to get their holiday plans back on track. In fact, travel is forecasted to reach pre-pandemic levels this year in many regions of the world. In the last two years, countries around the world have lost billions of dollars due to the lack of tourists and many are launching campaigns to attract foreigners back to their favourite holiday destinations.
Earlier this week, the United States (U.S.) announced a five-year strategy to revive national travel and tourism, which is aimed at promoting the U.S. as a premier vacation destination. According to the Bloomberg article, US launches plan to bring back foreign tourists, before the pandemic, travel contributed about $240 billion to the U.S. economy, benefiting companies operating restaurants, hotels, attractions, shopping and more. Despite a lull in international travel, demand in the U.S. has picked up quite rapidly. Over the last five months, travellers have contributed to a trade surplus in the country, signalling an improving appetite for travel. Demand is likely to continue increasing over the summer as international tourists have yet to reach their pre-Covid numbers.
Pent-up demand has been seen across Europe as well. If April travel data is any indication of what’s to come, Europe is in for a busy summer. In April, popular tourist destinations have seen tourist numbers increase anywhere from two to tenfold. Travellers are also spending a lot during their holidays. In France, for instance, foreign travel spending was up 201%, compared to 2021, and up 477%, compared to 2020, as noted in the Bloomberg article, France Foreign Travel Spending Up 201% in April Y/Y. Another Bloomberg article, Number of tourists visiting Spain in April up nearly tenfold YoY, notes that in Spain, the 6.1 million tourists who visited the country in April spent close to what 7.14 million tourists spent back in 2019. It seems that higher prices for hotel rooms and plane tickets are not dissuading tourists from packing their bags, enjoying their holidays and doing some shopping and eating out too.
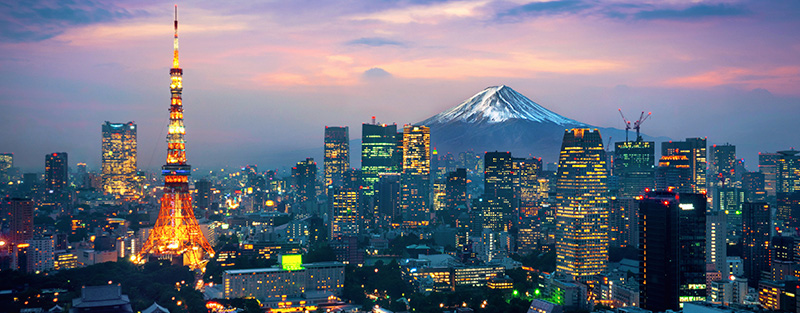
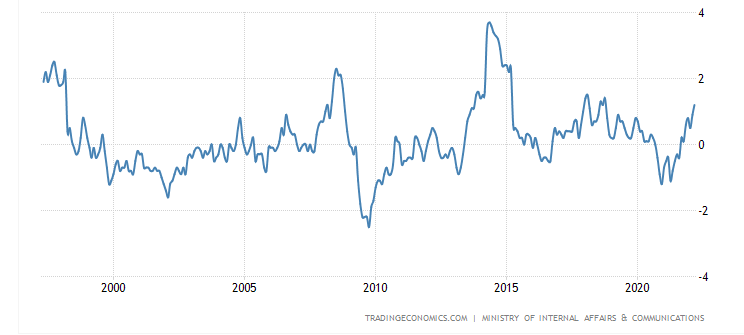
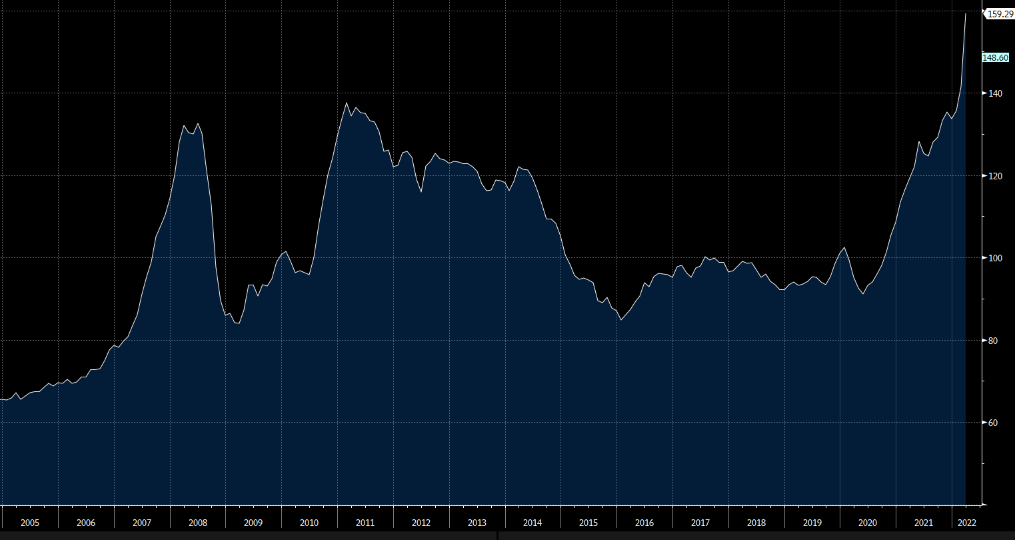
Japan has taken a more cautionary approach to its reopening plans. As of Friday, June 10th, the country will be accepting visa applications and allowing tourists to come into the country, but only if they are part of a guided tour and continue masking. They have been allowing up to 20,000 arrivals a day since June 1, and this daily cap includes business travellers, foreign students, and Japanese nationals. It will also include the newly allowed tourist arrivals. It will be interesting to see how many tourists will book holidays to Japan on these organized tours. One factor that could boost the attractiveness is the weak Japanese Yen. It is currently trading at a 20-year low, which could incentivize travellers to take advantage of lower than usual prices within the country.
China remains in an uncertain state. The country has been looking to ease border restrictions, especially after the two-month lockdown in Shanghai. While they loosened restrictions, parts of Beijing and Shanghai are already back in lockdown for a mass testing exercise, given the country’s zero Covid policy. We will be keeping a close eye as the situation emerges, although it remains unclear as to how things will progress over the summer.
Despite the Organisation for Economic Co-operation and Development (OECD) lowering its global growth outlook to 3% in 2022, down from the previous 4.5% forecast, summer travel does not seem to be a casualty of the slowdown. We believe that travel-exposed names could really benefit from the summer vacation tailwinds and keep performance on track despite the general economic slowdown.
Samsonite (SMSEY)
Samsonite has been one name that has benefitted from the global travel recovery and could further benefit from the reopening of the Asian regions. Sales for 2022 are on track to reach 80% of pre-Covid levels. The company is a well-established travel and lifestyle bag and luggage company with several brands under its umbrella. Some of these brands include Samsonite, Tumi, American Tourister, Gregory, and Lipault. The company’s exposure to different segments within the travel industry, as well as different geographies, makes it particularly attractive. In terms of business and leisure travel, which has been on the rise, they own Tumi and Samsonite, which cater to the more frequent, long-haul travellers. Gregory and High Sierra on the other hand, cater to the short-distance, outdoor-casual travellers who are looking to buy new gear for their road trips and backpacking adventures. As a result of these trends, sales in North America have been growing at a strong pace this year.
Asia is their second most important region in terms of revenues, accounting for about 34% of sales, just behind the Americas at 40%. However, the company’s sales in the Asian regions have been lagging, given the harsh lockdown measures that were in place over the last few months. Although more recently, news coming from Japan about the loosening of border restrictions for tourists and the slow reopening of several regions in China have given their Asian regional sales a boost. As China opened its inter-province travelling, sales have been improving, and with the broader reopening of the region, we remain confident that the company will be able to deliver strong sales in 2022 despite the slow start to the year.
L’Occitane (LCCTF)
Another one of our holdings that could benefit from tourists opening their wallets abroad is L’Occitane. The company owns many different brands in the cosmetics and beauty industry that appeal to diverse demographics. Their three top markets are China, the U.S., and Japan. Although there are still some uncertainties about the reopening situation in China, we expect the U.S., Japan and the rest of their geographies to make up for the slower growth in China. The company not only operates independently-owned boutiques, but it also has its products in major airports around the world at duty-free shops while also having a strong B2B distribution channel through which the company sells to airlines and hotels. With the global travel rebound, the company is looking to benefit not only from individual consumers’ spending during their trips but also from its B2B segment in which airlines and hotel chains will need to replenish their inventories to welcome travellers.
On the cost side, like most companies, L’Occitane has also been facing some expenditure inflation. However, the company has been able to swiftly manage its increased input costs. The pricing pressure that L’Occitane has been facing mainly stems from logistics and raw material costs. The group raised prices in all geographies during the month of April by 4-5%. This has been its largest price increase to date and the company expects it to be sufficient to maintain margins this year.