Sydney skyline at twilight, with the Sydney Opera House and Harbour Bridge.

Last week, Fedex released their latest reported earnings, depicting grim views of the economy. As a result of the weak quarterly numbers, its CEO to predicts the coming of a recession. Following what could can be defined as the great Covid-related delivery boom, Fedex’s harsh predicted slowdown is understandable.  

Recession thesis accepted, not all sectors and geographies are created equal and understanding the intensity of the recession is an important factor. Let’s look at country level numbers; the following results for the one-year probability of a recession were recently as disclosed in Bloomberg: China 20%, Australia 25%, Japan 30%, Hong Kong 30% US 50%, UK 60%, France 50% and Canada 40%. As data continues to appear, these numbers may prove conservative on the odds of a recession happening, they could however be insightful to find less affected geographies.  

With low inflation and low yen, it’s understandable why Japan can be seen as a favorable defensive jurisdiction.  We should add low valuations for its equities as well. But why is a country like Australia even lower on the recession risk? In fact, if put together Japan and Australia represent 42% of our EAFE developed markets universe and offer a defensive position as we cycle into recession.  Let’s look a bit more why Australia is faring better than other regions. 

The Reserve Bank of Australia is in the midst of its sharpest tightening cycle in a generation, having raised rates by 2.25 percentage points since May. But it’s now approaching a neutral rate, potentially allowing it to return to smaller, quarter percentage-point moves. That compares with the US Federal Reserve, which may deliver a third straight three-quarter-point increase later this month. 

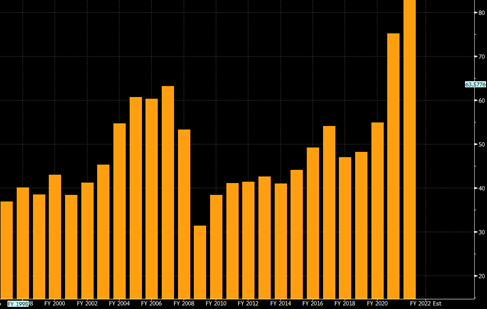
Australia has also been a rare beneficiary of fallout from Russia’s invasion of Ukraine as disruptions to commodity and energy supplies have sent coal and other prices soaring. The nation posted a record-high monthly trade surplus this year fueled by sales of coal, iron ore and liquefied natural gas. 

Australia has had a tailwind from trade that other countries just don’t have. The export of LNG and coal have been highly beneficial. Unusually, the surge in export prices isn’t being reflected in Australia’s commodity-linked currency, which has averaged 69 US cents over the past three months. A lower currency swells profits from commodity exports priced in dollars and makes the country more appealing to overseas visitors and students.  

Australia’s employment-to-population ratio is near a record high as is its participation rate — both much stronger than many other countries — highlighting the underlying momentum in the labor market. Job vacancies also remain elevated, suggesting that strength will persist. 

Australians still have plenty of savings to tap into to support consumption, having built up a large amount of cash from fiscal stimulus delivered during Covid lockdowns when there were few options to spend.  

If we look at our holdings in Australia, we are able find companies with world class expertise. As an example, with its vast amount of resources, Australia has very large resource extraction complexes that have trained the most capable pool of experts in material transformation at large scale. 

Alumina (AWC:AU) 

Global Alpha holds Alumina, part owner of the world’s largest alumina business which is the main ingredient to produce aluminum. Most of the alumina produced by company is exported to China. Its Middle East competition better serves the European continent. Although the aluminum/alumina markets weaken during a recession, German aluminum facilities could suffer the most under a gas rationed winter of the Russian war. Alumina is also the lowest cost producer globally and produces the greenest alumina (gas vs coal powered). The company offers a 10% dividend yield and aluminum remains a key component of the climate change infrastructure, automotive as well as the rebounding airline industry. 

Furthering our aluminum discussion, we turn to a pop culture question: aluminum cans versus plastic and glass bottles. We all know for taste it goes glass, can, then plastic. Glass is great, but is expensive to transport and recycle. Aluminum cans are therefore the winner in terms of logistics, recyclability, and carbon footprint. 

Orora (ORA:AU) 

We own Orora, the largest producer of aluminum cans for soft drinks in Australia and New Zealand. The company’s facilities are strategically positioned beside its clients and has pass through agreements with clients on material cost fluctuation. Historically, soft drink consumptions only slightly declines during a recession. Further, Orora clients have indicated 5% yearly growth on capacity requirements for the next several years. There is also leverage in the model as capex is added to existing facilities providing great return in investment. Its dividend yield is above 5% in addition to its growth profile. Although both Alumina and Orora are in the materials sector, Orora has very low commodity exposure providing it with more of a staples profile.

Global six-month real narrow money momentum, the key economic leading indicator in the forecasting approach employed here, is estimated to have moved sideways in deep negative territory in August* – see chart 1. Allowing for an average nine-month lead, the suggestion is that an incipient global recession will extend through Q2 2023, at least. 

Chart 1

Chart 1 showing G7 + E7 Industrial Output & Real Narrow Money (% 6m)

More specifically, global six-month industrial output momentum, which crossed below zero in July and is estimated to have weakened further in August, may continue to fall into April / May next year, with no monetary signal yet of a subsequent slowdown in the pace of contraction. 

The lack of recovery in real narrow momentum is disappointing since, as previously discussed, global six-month consumer price momentum pulled back in July / August. This slowdown, however, was offset by a further fall in nominal money expansion – chart 2. 

Chart 2

Chart 2 showing G7 + E7 Narrow Money & Consumer Prices (% 6m)

Nominal money weakness, encompassing broad as well as narrow aggregates, is evidence that monetary policies were already over-restrictive before the latest round of hair-shirt rate hikes. 

What does this monetary backdrop imply for markets? The two measures of global “excess” money calculated here, i.e. the differential between six-month real narrow money and industrial output momentum and the deviation of 12-month real money momentum from a long-term moving average, remained negative in August – chart 3. 

Chart 3

Chart 3 showing MSCI World Cumulative Return vs USD Cash & Global “Excess” Money Measures

Historically (i.e. over 1970-2021), global equities outperformed cash on average only when both measures were positive, with underperformance greatest when both were negative. 

Previous posts suggested that the first measure would turn positive during H2. This remains possible despite the disappointing August monetary data: the measure has recovered since June as industrial momentum has fallen and output may soon be contracting at a faster pace than real money. 

The second measure, however, is likely to remain negative until well into 2023: 12-month real money momentum weakened further in August and the long-term nature of the moving average implies that it will make little contribution to closing the current wide gap.

The projected development of the measures, i.e. the first crossing back above zero but the second remaining negative, would suggest a slowdown but not reversal in the bear market in late 2023. 

The message for government bond markets is more hopeful. Changes in bond yields have been inversely correlated with changes in the first excess money measure historically, i.e. bonds have, on average, rallied when the measure has risen, even while it has remained negative – chart 4**. 

Chart 4 

Chart 4 showing US Real 10y Treasury Yield (6m change) & Global* Real Narrow Money % 6m minus Industrial Output % 6m (6m change, inverted) *G7 + E7 from 2005, G7 before

The six-month change in the excess money measure turned positive in August, having been negative – implying an unfavourable monetary backdrop for bonds – between November 2021 and July. US 10-year Treasuries have outperformed cash by 4.2% pa on average historically following positive readings. 

*The estimate incorporates monetary data covering two-third of the aggregate and complete CPI results.

**The change in the measure is plotted inverted in the chart.

Dentist medical tools - gloved hand pointing to computer displaying X-ray of teeth and jaw

Since the outbreak of Covid-19 in 2020, we have discussed the impact the pandemic has had on our lives, businesses and markets worldwide in several commentaries. The dental industry, like the whole healthcare sector, was no exception, with massive disruptions taking place, especially in the early months when patients were kept from attending routine check-ups.

Fortunately, the importance of the dental practice was well understood, and dentists have been allowed to resume operations with a set of strict protocols. However, delays caused by the pandemic left many people behind in their dental care. The stress and anxiety experienced during endless lockdowns had people grinding their teeth, further aggravating oral health issues. A friendly reminder that a good rule of thumb is to see a dentist twice a year.

During economic downturns, when consumer sentiment weakens, patients might decide to delay elective procedures. However, demand for essential health treatment remains relatively stable. We find that some healthcare companies present attractive investment opportunities, regardless of the macro environment. As the saying goes, teeth are always in style. A good example of such an opportunity is Dentium, a Korean dental implant manufacturer, and one of the top holdings of our Emerging Markets strategy.

In early-summer of 2000, Jung Sung-Min, a practicing dentist running a clinic in South Korea, established Dentium, a small manufacturer of dental implants and related instruments. Little did he expect that over the next two decades, the company would scale up successfully and capture a significant market share to end up ranking as the second largest in South Korea, and the sixth largest worldwide. Although no longer involved in day-to-day operations after stepping down as CEO and Chairman, the founder remains the largest shareholder of the company.

Dentium’s growth strategy to become a global total dental solutions provider is based on ongoing product innovations and expansion overseas. Clinical data accumulated over the years validates the high quality and solid performance of its products. The company has developed a comprehensive product lineup, expanding to digital dental equipment, including CBCT (cone-beam computed tomography), 3D printers, and CAD/CAM (computer-aided-design and computer-aided-manufacturing) systems. Dentium aims to foster package sales of its solutions, spanning from diagnosis to prosthesis procedures.

Although Dentium faces fierce competition from domestic peers, the company has steadily expanded its market share in South Korea, focusing on penetrating primarily newly opened clinics. Once its equipment is installed, recurring orders of dental implants ensure revenue stickiness, growth visibility and margin expansion. With manufacturing facilities located in South Korea, China, Vietnam, and the United States (U.S.), Dentium has established a global footprint. However, China is not only the largest market for the company, accounting for more than half of revenue, but it is also expected to remain the main growth driver in the medium-to-long term. At the same time, we believe that Dentium’s business in India, the Middle East and Southeast Asia will continue growing faster than the industry average.

The dental implant market globally is expected to exceed US $8 billion by 2028, from US $4.8 billion in 2021, implying a compounded annual growth rate of 7.6%. China, with the number of implants placed per 10,000 people equivalent to only one-tenth of the global average, will likely grow at least twice as fast. South Korea has one of the highest penetration rates of dental implants, is expected to grow at a low-to-mid-single digit annually. The global dental implant market is drifting towards an oligopolistic structure, with the seven largest companies (spearheaded by Straumann and Danaher) accounting for over 80% of sales.

In most regions, Dentium caters primarily to the value segment of the market, while providing products of equivalent quality to global industry leaders, but at more attractive price points. Combined with its rich expertise, strong reputation, consistent execution, and adequate capacity, Dentium’s success in developing countries makes total sense. However, the management team shows no signs of complacency and has set in motion an ambitious plan to become a top 3 operator globally in the next 8 to 10 years, ensuring a growth rate of around 15-20% per annum over this period. Operating leverage and growing efficiencies provide a decent uplift to margins. Thus, the operating margin of 30-35% is not only sustainable, but has some upside and compares very favourably to the 17-20% range recorded in the past.

Like many other businesses with a substantial footprint in China, Dentium faces risks primarily of a regulatory nature. The recent announcement made by the National Healthcare Security Administration of China removes lots of uncertainty and solidifies our investment thesis. Aiming to cut elevated prices at public hospitals (which apparently are higher than the average level of private sector) and educate patients, the Chinese government agency defined a set of rules and procedures to ensure central procurement and price controls at public dental clinics. Although this regulation will inevitably impact the general price level of dental implants in the private sector, Dentium caters primarily to private clinics and is expected to benefit at the expense of its U.S. and European peers, as its pricing is more attractive and highly competitive.

Despite having a highly attractive investment case, the company has huge room for improvement in terms of handling their investor relations. At the same time, it is not widely known among foreign investors, partially because it is not covered by any of the big brokerage firms. However, Dentium’s stock performance has been an outlier this year, outperforming its peers year to date.

Chart showing Dentium’s stock performance
Source: Bloomberg

Despite its outperformance, Dentium still trades at an attractive valuation relative to its historical levels…

Chart showing that Dentium still trades at an attractive valuation relative to its historical levels
Source: Bloomberg

…as well as relative to its peers.

Chart showing that Dentium still trades at an attractive valuation relative to its peers
Source: Bloomberg

Following on our last commentary featuring Samsonite (1910 HK), more travel statistics were released confirming the increase in travel. July data shows that Europe, South America and the United States (U.S.) travel spending now exceeds the previous peak of July 2019.

Hotels in Europe saw their revenues per available room (RevPAR) in July grow 78% year-on-year, exceeding July 2019 by 19%. Occupancy rates are still below 2019 by above 5%, but average prices are 25% higher.

Meliá Hotels (MEL SM)

One holding that is very exposed to the European and Caribbean travel market is Meliá Hotels. Meliá is one a leading European hotel groups; it owns and/or manages more than 316 hotels and resorts in 33 countries, mainly in America and Europe, for a total of over 83,772 rooms, 11,854 of which are owned. Of the rooms, 63% are in Europe, 30% in the Caribbean, and 7% in Asia, which is the main reason for future room growth. Resorts account for 60% of hotels (i.e., 100% leisure), with the other 40% are urban, of which half are bleisure (business and leisure) in cities like London, Paris, Rome and Madrid.

Covid has been a huge challenge for companies, particularly in the travel and hospitality business. An important item we look at before investing in any company is the strength of the balance sheet. We want a strong balance sheet with little debt, even if it may appear as not the optimal capital structure. In times of stress, however, that strong balance sheet creates opportunities.  

Let’s contrast two world-class companies in the travel sector — Meliá and Carnival Cruise Line (CCL US):

 Meliá12/201912/2021
Number of hotels326316
Company owned4337
Total rooms83,77883,772
Number of shares outstanding (million)229.7220.5
Total net debt (excl. leases) €M5551,244
Stock price€7.86€6.06 (31/08/2022)
 Carnival Cruise Line11/201911/2021
Number of ships in service105105
Capacity per day248,790248,790
Number of shares outstanding (million)6901123
Total net debt (excl. leases) $M US10,98424,087
Stock price$45.08$9.54 (31/08/2022)
Source: Global Alpha

We can see that Meliá has the same number of rooms and less shares outstanding than at the end of 2019.  The debt, although higher, is still manageable, especially considering that the over 11,000 rooms Meliá owns could be sold and the company could eliminate most or all of the debt outstanding.  As a result, Meliá’s earnings per share, which were €0.64 in 2018, should be higher in 2024.

Meliá’s stock price, although down 23% since the end of 2019, has rebounded 121% since March 18, 2020, and should continue to rebound as results improve.

Carnival Cruise, on the other hand, had to more than double the number of shares outstanding and take on very expensive debt.  As a result, earnings per share, which were $4.49 in 2019, may never reach that level again.  Its stock price has gone down 81% since the end of 2019 and has only rebounded 2.5% since March 18, 2020, most likely a permanent loss of capital.

As investors, we are looking at per share growth. We think like business owners. If we owned the whole business, we would look to grow profits. When we buy shares, we become co-owner of the business and look for the sales and profits attached to each share we own.

Let’s look at this concept of growth per share. Every business is cyclical to a certain extent. What we want is higher highs and higher lows, and we want to avoid a permanent loss of capital.

Brunswick Corp (BC US)

A company we have followed for the last 20+ years and own in our U.S. small cap fund is Brunswick Corp.  Founded in 1845, the company has been manufacturing many recreational products over the years, from pool tables to bowling alleys, before focusing on boats, such as Boston Whaler, Lund or SeaRay and Mercury marine engines.

Source: Bloomberg

Looking at sales figures above, we can see that total sales have only increased slightly since FY2006.

However, shares outstanding have decreased as a result of strong free cash flow used to reduce the number of shares.

Source: Bloomberg

As a result, revenue per share has also increased.

Source: Bloomberg

And so have earnings per share.

Source: Bloomberg

And despite the global financial crisis of 2008 and the Covid pandemic of 2020, owning the shares has been rewarding investors.

Source: Bloomberg
Businesswoman wearing a mask checking the boarding time at a digital timetable at the airport terminal.

Have you been on vacation this summer? It seems everyone is travelling again. Indeed, travel activities have dramatically increased in most regions, except China, as shown by the data conducted by Global Revenue-Passenger Kilometers (RPKs: multiplying the number of paying passengers by the distance travelled).


In previous commentaries, we’ve shared updates on travel-related stocks, such as Melia Hotel (MEL SM) and Autogrill (AGL IM). Both are long-term holdings and niche market leaders. This week, we would like to profile Samsonite, a relatively new holding initiated in November 2020. Although listed in Hong Kong, it is a truly international company present in over 100 countries.

Samsonite International S.A. (1910 HK)

Business Overview

  • Founded in 1910 in Denver, Colorado by the Shwayder Brothers, Samsonite is the world’s largest travel luggage company.
  • It owns many brands, including Samsonite, Tumi, American Tourister, Gregory, High Sierra, Kamiliant, ebags, Lipault, and Hartmann.
  • Before 2012, its business was mainly focused on the Samsonite brand, travel luggage and the wholesale channel. Today, it has a more balanced business with multiple brands through multiple distribution channels.

Target market

Competition

  • A very fragmented market. Other top players are VF Corp, ACE, Delsey, Rimowa, and VIP Industries.
  • Samsonite dominates in most markets, except in India and Japan.

Competitive advantages

  • Samsonite has 17% market share in the global luggage market.
  • Strong brand recognition.
  • A wide range of brands, from mid- to high-end.

Management

  • Kyle Francis Gendreau is the CEO of Samsonite, previously CFO. He joined the company in 2007.
  • Timothy Charles Parker, a turnaround veteran, has been the Chairman since 2011. He owns 3.9% of the company.

ESG

  • Samsonite provides very comprehensive annual ESG reporting.
  • Carbon emission reduction targets: to cut carbon intensity by 15% from 2017 to 2025; to power all operations with 100% renewable energy by 2025.
  • Six out of eight board directors are independent, and one woman sits on the board.

Growth strategy

  • Product: new product innovation.
  • Distribution: focus on Tumi’s international expansion and e-commerce growth.

Recent developments

  • Last week, Samsonite reported very strong 1H earnings, with net sales up 59% year-over-year, driven by North America, Latin America, and Europe.
  • Ample liquidity of US$1.4 billion.
  • It expects a stronger recovery over the rest of 2022, especially from Asia, with price increases and cost savings to help profitability even further.
Office Buildings in Financial District La Defense, Paris, France

Equities have rallied since the low point in June but several headwinds remain, including a slower economic outlook, tightened financial conditions, and the end of the reopening dynamics coupled with an uncertain gas supply in Europe.

Here are some thoughts regarding the European economic landscape and fundamentals behind companies having reported their half year financial results:

  • The majority of European companies have reported their first half results. The levels of earnings beats remains very high. Indeed, the magnitudes of these beats have hit a new records. So far, 69% of companies in STOXX 600 index have reported revenues beating consensus while 17% missed. The revenue beat/miss ratio for this European index reached 4.0x at the end of July versus the 5-year average of 1.7x, according to BNP Paribas Exane Research’s Strategy on August 5, 2022.
  • Amongst other things, European companies have benefited from the reopening of the economy and a weak Euro. Companies that generate a significant portion of their sales in U.S. dollar have experienced a positive translation effect on their top line. Looking at the performance by geographies, sales generated in North America outperformed while sales in China, Northern and Eastern Europe underperformed.
  • Consumer sentiment deteriorates; with real disposable income falling, non-essential purchases like apparel may be impacted. This creates the risk of oversupply and possibly the need for general retailers to offer significant discounts to clear up inventory. Companies like Gap and Walmart have seen an increase in promotional activities. On the other hand, companies exposed to the service side of the economy continues to experience strong consumer demand. Travel and lodging remains a priority.

Resurgence of political risk; the resignation of Italy’s Prime Minister Draghi adds uncertainty to the future fiscal path of Italy and may contribute to higher spreads. The election planned for September 25 will hopefully provide more clarity on the sustainability of the Italian public finances.

Farmer hand holding young plant.

In this week’s commentary, we take a different approach. Written by Sain Godil, Portfolio Manager, he shares how the alchemy of art and science that goes into gardening is similar to Global Alpha’s investment philosophy.

Recession, war, supply disruption, inflation, and Bitcoin crash – it seems that this is much of what you hear in the news these days. Our recent weeklies have focused on how our portfolio is extremely well positioned to benefit in periods of turmoil. We have also talked about how and why small caps tend to outperform in a global recession. So, we don’t need to cover these themes again.

Today’s weekly topic is a bit different. It came to mind while I was tending my garden. Like most people, once the first signs of spring arrive, I begin thinking about what vegetables and flowers to grow.

Gardening has become a hobby of mine because it gets me outside and pulls me away from my digital devices. It allows me to show my kids where food comes from and what goes into growing your own plants. Plus, what’s better than watching seeds transform into a tasty salad you share with your friends and family over a glass of wine?

While I was pruning my tomato plants, it occurred to me there are many similarities between gardening and the Global Alpha investment philosophy. Just like investing, gardening is an alchemy of art and science. You need a proven process, vigilance, and patience to yield fruit. Here’s how I see the parallels.

Step 1 – Preparing the ground

Gardening – It all begins with a vision of where you want to position your garden bed. The type of soil and fertilizer you choose will have a direct impact on the yield you get when the plants bloom later in the summer. Make the wrong choice, and all the time and money you spent goes to waste.

Investing – Similar to gardening, smart investing begins with careful positioning. This can be done via different asset classes, market cap ranges, fundamental or quant-based approaches, etc.

At Global Alpha, we are fundamental managers focused on global small cap. That’s our “fertile ground”. As stock pickers, this strategy gives us an opportunity to identify the best companies out of an available of 11,000 names. By carving out this particular garden patch of the investible universe, we lay the groundwork for fruitful returns for our clients.

Step 2 – Choosing the right plants

Gardening – After preparing the garden bed, you need to decide which plants to grow and where to place them. Each plant needs a specific amount of sun and water to optimize the yield. I learned this firsthand last summer, when I mistakenly placed my pepper plants in the shade and ended the season with only two tiny green peppers (one of which was eaten by a squirrel).

Investing – Just like a garden needs adequate sunlight and water, your portfolio needs companies that can grow revenues and profits much faster than the industry. We achieve this objective by understanding the addressable markets in which our companies operate – and identifying names that are well-positioned to flourish in that environment.

As our companies grow their revenues and earnings, investors can expect healthy out-performance over the long term. On the flip side, if the end market is shrinking, even the most promising company cannot grow. It simply won’t get the nourishment and support needed to thrive.

Step 3 – Care and attention

Gardening – An outdoor garden needs your constant attention. Besides regular watering, you must be on guard against the continuous onslaught of insects and animals that want to gobble up your harvest. Weeding and pruning are also key to optimizing the health and output of your plants. It’s all about staying vigilant.

Investing – At Global Alpha, we are constantly re-evaluating every holding in the portfolio. Our on-the-ground research helps us identify threats our companies may face. By meeting competitors, we get an understanding of the market dynamics and challenges our companies may face in the future. Based on the intel we gather, we prune the portfolio by managing the weights of individual companies. This is how we create a diversified portfolio that adds value in up markets and has superior down market protection. In other words, we know how to weather the storm.

Step 4 – Reaping your rewards

Gardening – All the hard work has paid off, and it’s time to reap your rewards. Nothing compares to the taste of vegetables you grew yourself. And, it’s also the perfect time to reflect on how you’ll optimize your growing process for next year to get an even better harvest.

Investing – Our team spends a lot of time reflecting on what we got right and what could have been improved in the portfolio management process. We are constantly evaluating which other companies and industries we could invest in. It’s all about continuous improvement to deliver the best possible results.

Conclusion

As I write this, the garden I planted in the spring has begun to flourish with kale, spinach, peppers, tomatoes, cucumbers, and herbs. Each year it gets better as I refine my growing process and figure out which pitfalls to avoid (like those sneaky squirrels).

It brings to mind the Global Alpha journey, which began with three founders and has expanded to 14 team members over the past 14 years. Since inception, our continuous refinement of our portfolio management process has helped us consistently outperform the benchmark.

Despite the inevitable changes in the weather, our team continues to learn, adapt, and identify flourishing businesses around the world. Here’s to another 14 years of growth!

Industrial plant at night

The Emergency Plan for Gas for the Federal Republic of Germany was published in September 2019. The third paragraph of the background section states “Germany’s natural gas supply is very secure and reliable”. It goes on to say, “a serious deterioration in supply cannot be ruled out completely… though the likelihood of such a severe crisis in supply actually occurring is very small.” On June 23, Germany announced they were moving to stage two of the three-stage national gas emergency plan due to reduced Russian gas supplies coming from the Nord Stream 1 pipeline. Currently at 58% gas storage levels, the German government is aiming to reach 90% by December.

Stage two does not involve gas rationing. The focus instead is on increased coordination with network providers and mechanisms such as an auction system to incentivize industrial users to slash consumption and sell back unused gas. These measures could come too late for some players as Uniper (UN01.GY) submitted a bailout application for government support due to financial distress (Uniper is not one of our holdings).

Stage two also allows the government to trigger an article of the new energy security law that would allow utility companies “in case of a substantial reduction in gas import volumes” to increase gas prices for companies and households to an “appropriate level” with a notice period of one week. An upward adjustment of retail gas prices could potentially have a double-digit percentage impact on inflation and negatively affect GDP growth due to weaker consumption. This would be an unacceptable situation for the German government. Should energy prices remain elevated, some kind of fiscal response would be needed, either to dampen the impact on retail gas prices or in the form of cut taxes.

By moving to stage two, the risk of advancing to the emergency level (stage three) is also clearly on the table. At stage three, gas rationing would be allowed for unprotected customers, including industrial users. Should gas supplies be interrupted, it is highly likely that Germany would fall into recession. This would be a huge blow to the manufacturing industry, which serves as the engine that drives the German economy. In June, the German Central Bank lowered its forecast for GDP growth in 2022 to 1.9% from 4.2%.

Natural gas provides about 25% of the energy needed for German industry, with over half of coming from Russian imports. Tough decisions would need to be made on which industries would be allocated gas supplies in order to keep producing, and which would be considered dispensable. For example, it would be impractical to turn off large gas-powered furnaces or smelters. Once they cool down, bringing them back up to the required operational temperature would consume even more energy. Switching to another source of power or relocating is also impossible, due to size as well as the environmental and economic cost. If the worst case scenario plays out and some industries do have to shut down in the winter, there would be significant job loss; one study estimates that Germany’s GDP could fall by 12.7%.

There are calls for home owners to have their gas boilers and radiators checked and adjusted to maximize their efficiency, and if possible, to save energy in order to reach the needed storage levels for winter. Vonovia (VNA.GY), one of Europe’s leading private residential housing providers with an estimated 1 million tenants in Germany, has instructed technicians to place a limit on its tenants’ overnight heating systems to 17° Celsius (63° Fahrenheit). (Note, Vonovia is not a Global Alpha holding.)

We will soon know how the gas supply situation will play out for the rest of the year. Regularly scheduled maintenance on the Nord Stream 1 pipeline that runs under the Baltic Sea from Russia to Germany started on July 11. In the past, the shutdown has lasted for approximately 10 days. If the gas flow from Russia does not start up when the maintenance is complete, the discussion around rations will ramp up and limits on hot water for private households should not be ruled out.

Aurubis (NDA.GY)

Our most exposed German holding to gas supply disruption is Aurubis. Aurubis is a leading global producer of non-ferrous metals and one of the largest copper recyclers worldwide. Annually, the company produces more than 1 million tons of copper cathodes as well as a number of other metals and additional products such as sulfuric acid. As an energy intensive business, increased energy prices have had an impact on costs, despite a large part of the company’s energy needs being hedged.

Aurubis can successfully pass on some of the higher energy costs to customers in the form of product surcharges. The biggest risk would be a lack of supply to two of its smelters that are reliant on Russian natural gas. Despite this, the share price weakness so far this year is more related to base metals and copper price in particular declining due to growing concerns over a global economic slowdown on the back of rapid interest rate hikes across the world. We continue to like Aurubis as a play on the secular recycling trend. The company has the multi-metal expertise and network to capitalize on the opportunity that is expected to present itself by way of a significant increase in the supply of complex recycling material.

Our other German holdings are less affected. Evotec (EVT.GY) is a biotech company that is a leading provider of outsourced services for early-phase drug research and development to the pharmaceutical industry. Patrizia (PAT.GY) is one of Europe’s largest real estate asset managers, with about €55billion of assets under management. Finally flatexDEGIRO (FTK.GY) is one of the leading and fastest growing online brokerage businesses in Europe.

While most of the focus has been on Germany, other European countries are affected deeply by the reduced gas supplies. The Global Alpha team is closely following the situation for any signs of escalation.

A fall in global six-month real narrow money momentum below zero in March signalled a shift in the economic outlook from slowdown to recession. A subsequent further decline in momentum to its weakest since 1980 suggests a deep recession extending into Q1 2023, at least. Economic contraction will release liquidity for markets, with “safe” bonds and quality stocks possible beneficiaries. Chinese real money momentum is diverging positively, supporting relative economic / equity market prospects.

Global (i.e. G7 plus E7) six-month real narrow money momentum in May was below its GFC low and the weakest on record in data extending back to 1995. In longer-run G7-only data, the current rate of contraction was matched in 1973 and 1979 before severe recessions – see chart 1.

Chart 1

Chart 1 showing G7 Industrial Output & Real Money (% 6m)

A further recessionary consideration is the recent pace of stockbuilding: the G7 stockbuilding share of GDP matched a 1974 high in Q1 – chart 2. The cycle upswing was supercharged by firms overordering inputs because of supply shortages. With final demand falling away, a liquidation of inventories will be amplified back through supply chains – the “bullwhip” effect.

Chart 2

Chart 2 showing G7 Stockbuilding as % of GDP

The assessment of market prospects here is informed by two measures of global “excess” money: the gap between six-month real narrow money and industrial output momentum; and the deviation of 12-month real money momentum from a slow moving average. Both measures were negative by end-January, a condition historically associated with weak equity markets – table 1.

Table 1

Table 1 showing Average Excess Return on MSCI World vs USD Cash 1970-2021, % pa

The expected recession and a likely sharp fall in six-month consumer price momentum suggest that the first measure – the real money / output momentum gap – will return to positive territory in H2, possibly in Q3. The second measure may remain negative: 12-month real money momentum is currently far below its moving average and will be slower to recover. The implication is a possible shift from the bottom right quadrant in the table to top right – still an unfavourable backdrop for equities but less grim than during H1.

The excess money indicators are informative about sector and style performance. Recent outperformance of defensive sectors and underperformance of tech accords with the historical pattern under “double negative” readings – table 2. A switch to the upper right quadrant would suggest a tech recovery but further outperformance of defensive vs. non-tech cyclical sectors. Within the defensive basket, however, energy has historically performed poorly under this regime.

Table 2

Table 2 showing Average Price Performance vs MSCI World 1975-2021, % pa

Style-wise, recent outperformance of high dividend yield stocks accords with the historical pattern in the bottom right quadrant but quality has not on this occasion proved defensive, probably reflecting its inverse correlation with Treasury yields and the magnitude of the H1 rise in the latter – table 3. This suggests that quality will stage a come-back if yields reverse, with a potential shift to the upper right quadrant an additional positive – this was the best regime for quality and growth historically.

Table 3

Table 3 showing Average Price Performance vs MSCI World 1975-2021, % pa

Six-month real narrow money momentum is similarly weak in the US and Europe but China and, to a lesser extent, Japan are diverging positively – chart 3. A further pick-up in China would support a forecast of economic recovery despite an export drag from recessions elsewhere. The latest PBoC bankers’ survey is consistent with monetary acceleration, indicating substantial policy easing and an increase in loan supply – chart 4.

Chart 3

Chart 3 showing Real Narrow Money (% 6m)

Chart 4

Chart 4 showing China True M1 (% 6m) & PBoC Bankers’ Survey

Global inflation prospects have improved dramatically. Having warned of the current overshoot, monetary trends are now consistent with inflation rates returning to target. G7 annual broad money growth was down to 4.9% in May from a peak 17.3% and is on course to move below its 2015-19 average of 4.5%: the money stock expanded at an annualised pace of only 1.3% in the latest three months.

The monetarist rule of thumb is that money growth leads inflation with a long and variable lag averaging two years. G7 annual broad money growth peaked in February 2021 so this average would suggest no inflation relief before early 2023. Some monetarist economists argue that the 2020-21 money growth surge has left a large monetary overhang, raising the possibility of a longer-than-average lag.

The view here is that the historical variability of the money growth / inflation lag partly reflects the position of the stockbuilding cycle, which is a key driver of commodity prices. The assessment that the cycle has peaked and will be in a strong downswing in H2 2022 suggests that recent commodity price weakness will be sustained, in which case their current large positive impact on annual CPI inflation rates will moderate through H2 and turn negative by early 2023.

Core inflation is widely expected to remain high into 2023, reflecting labour market tightness. Recession and monetary weakness, however, suggest that firms will lack pricing power to pass on increases in labour costs, which may, instead, squeeze historically generous margins and trigger early job cuts. Labour markets could weaken surprisingly sharply, with signs of an imminent unemployment reversal appearing recently in a range of sensitive indicators.

Close-up trading monitor with stock market candle chart

Several major global indices fell into bear market territories in the past weeks. Investor behavior has shifted from ‘buy the dip’ during the pandemic to ‘sell the rally’, fearing of a potential recession. A wave of layoffs has swept across businesses, especially in the tech sector in the United States (U.S.) in the first half of 2022. The University of Michigan Consumer Sentiment Index fell sharply to a record low of 50.2 in June of 2022, well below market forecasts of 58, mostly attributable to the soaring inflation, which is at a 40-year high.

To combat the inflation, the Federal Reserve (Fed) has accelerated the pace of its interest rate hike, lifting interest rates by 75 basis points in June. This represents the third hike in 2022, and the largest since 1994. Historically, recessions start a median of 25 months after the Fed begins a tightening cycle, although there have been three cases (in 1963, 1994, and 2015) when a recession did not follow.

The best scenario for the markets would be a so-called soft landing, where the Fed could bring inflation under control without causing a recession. An ideal outcome would be similar to 1994, when the Fed hiked interest rates seven times in 13 months, almost doubling the rate from 3.05% to 6.05%, while avoiding a recession. However, the annual inflation was only 2.7% in 1994, while the latest inflation rate accelerated to 8.6% in May of this year. The unemployment rate was also higher in 1994, at 5.5%, versus 3.6% in May 2022, indicating a tighter labour market and higher labour cost today. These factors suggest it will be more challenging for the central bank to tame the inflation this time around. It is more likely than not that we are going to have a recession as early as next year, as predicted by leading economists.

How long does a recession last?

Based on data provided by the National Bureau of Economic Research, since 1945, the U.S. has experienced 13 recessions, including the short one in 2020. The average length of a growing economy is 5.3 years, and the average recession lasts for 10 months. A full economic cycle is around 6.3 years.

What about the stock market? In the same time period, the S&P 500 experienced 11 bear markets, six of which were accompanied by a recession, according to data compiled by Invesco. Bear markets on average have taken about one year to go from peak to trough, and 2.3 years to return to break-even. The S&P 500 index plunged an average of 33% during bear markets in that period, with the biggest decline occurring between 2007 and 2009, when the S&P 500 dropped 56%.

What does small cap do historically in bear markets or recessions?

History indicates that small caps tend to outperform larger caps after a bear market, and small caps have outperformed large coming out of nine of the last 10 recessions since World War II, according to the Jefferies Equity Research report published on April 8, 2020, JEF’s SMID-Cap Strategy – Thoughts & Observations.

Small cap vs. inflation

Small caps have historically outperformed and have shown better pricing power during most of the previous high inflation regimes, including the early 1960s, and the 1970s. Margins of small cap companies have declined less than large caps when inflation goes up, and in some cases, small cap margins go up with inflation, according to the BofA report by Jim Carey Hall, Small cap primer: the big guide to small stocks, published on May 31, 2022. Companies we invest in at Global Alpha are leaders in their niche markets, which gives them the pricing power to pass on higher costs to clients, hence maintain a healthy margin in an inflationary environment. 

Small cap vs. high interest rates

Two types of companies are most likely to suffer from higher interest rates. From the valuation perspective, expensive stocks are more likely to get hurt; from the operation point of view, heavily leveraged companies are likely to suffer. The valuation of small caps looks particularly attractive today, as small caps were expensive vs. large leading into almost every other Fed tightening cycle since the 1980s. Today, small caps trade at discount to large caps, as noted in the BofA’s report, Small cap primer: the big guide to small stocks. Companies we invest in at Global Alpha are high-quality companies trading at reasonable prices. Approximately one third of the companies in our portfolios have a net cash position.

Expansion and recession are a natural part of the economic cycle. It is important to be diversified, and stick to quality names that benefit from secular trends. It is during the down markets that more investment opportunities will emerge. The Global Alpha team has identified many great companies that are trading at attractive valuations, and we will introduce these names in future commentaries.