Global economic sentiment has improved on the back of China’s reopening and a collapse in the European gas price but monetary indicators continue to signal a negative outlook. The “excess” money backdrop remains unfavourable for equity markets, with prospective developments suggesting overweighting non-energy defensive sectors and expecting a further relative recovery in quality / growth. 

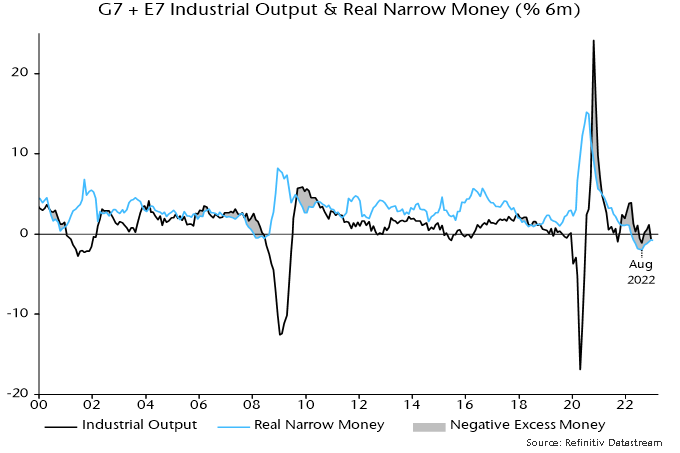
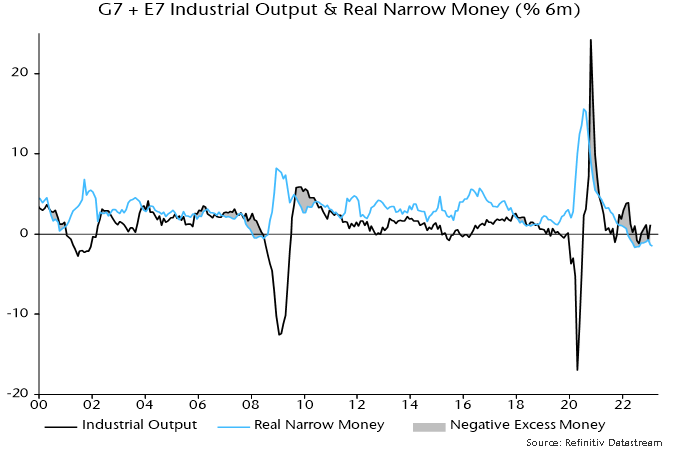
Revisions to US seasonal adjustments have slightly altered the recent profile of global (i.e. G7 plus E7) six-month real narrow money momentum – the key leading indicator in the money / cycles forecasting approach used here. On the new numbers, momentum bottomed in June 2022, recovering modestly into December before falling back in January / February – see chart 1. 

Chart 1

Chart 1 showing Global Manufacturing PMI New Orders & G7 + E7 Real Narrow Money (% 6m)

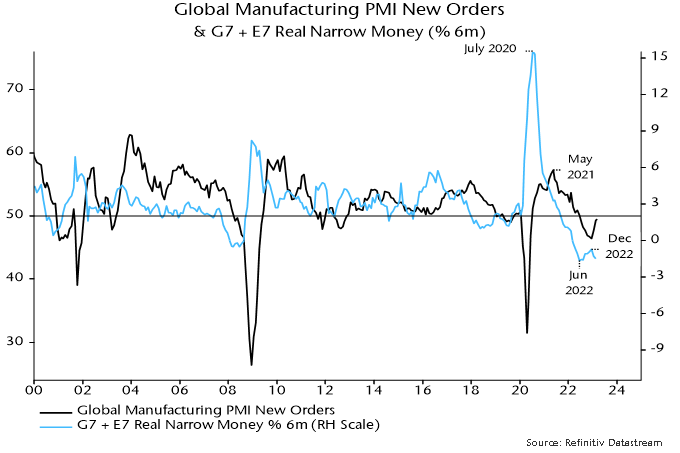
The June turning point has been followed – with a lag within the normal range – by a recovery in global manufacturing PMI new orders from a low in December, with the revival driven by a sharp rise in the Chinese component. 

The PMI recovery is expected to fizzle out and reverse into H2, for both monetary and cycle reasons. Six-month real narrow money momentum, as noted, fell back in January / February and remains in negative territory – a sustained economic / PMI recovery has never occurred historically against such a monetary backdrop. 

From a cycles perspective, major PMI lows occur around troughs in the stockbuilding cycle but the current downswing phase was only starting when PMI new orders bottomed in December. With the last cycle trough in Q2 2020, the average historical cycle length of 3 1/3 years suggests another low in H2 2023. 

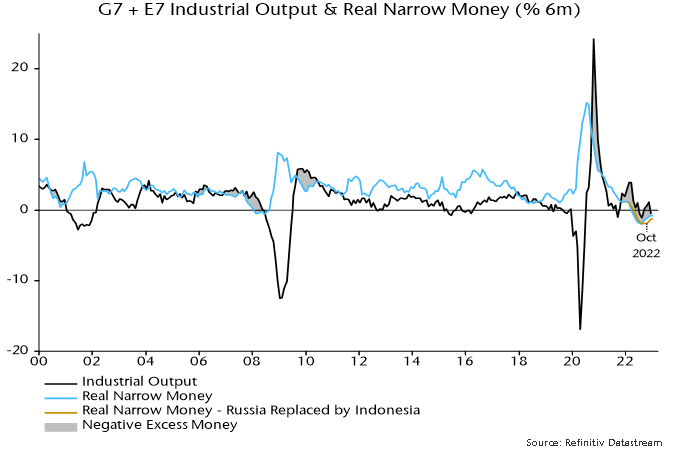
The marginal recovery in global six-month real narrow money momentum since June 2022 has been driven entirely by China and several other E7 economies. US / European momentum has slid deeper into negative territory as already restrictive monetary policy settings have been tightened further – chart 2. 

Chart 2

Chart 2 showing Real Narrow Money (% 6m)

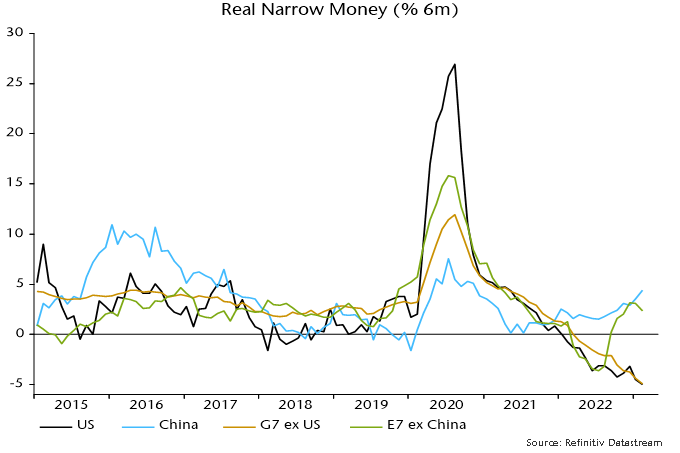
The Chinese pick-up suggests economic acceleration through 2023 but a recovery will be held back by – and won’t offset – global weakness. Current Chinese real money strength, moreover, could fade: higher short-term rates / yield curve flattening since late 2022 suggest a slowdown in nominal money growth while unusually low inflation may revive as the economy normalises. 

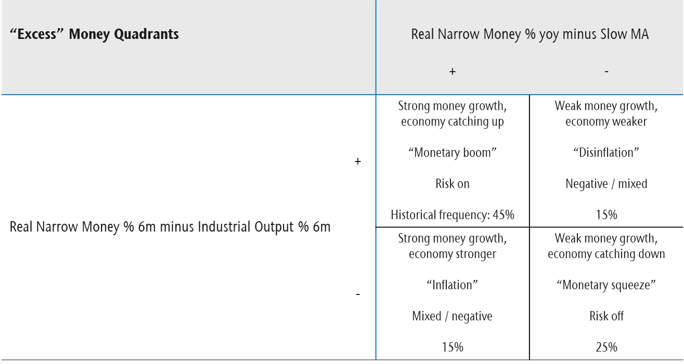
The assessment of market prospects relies on two indicators of global “excess” money – the gap between six-month real narrow money and industrial output momentum, and the deviation of year-on-year real money momentum from a long-term moving average. The signs of the two indicators define four investment quadrants describing different market environments – see table 1. (This presentation echoes Hedgeye’s investment “quads”, in their case defined by the directions of economic growth and inflation – the approach here offers an alternative “monetarist” perspective.) 

Table 1

Table 1 showing “Excess” Money Quadrants Real Narrow Money % yoy minus Slow MA

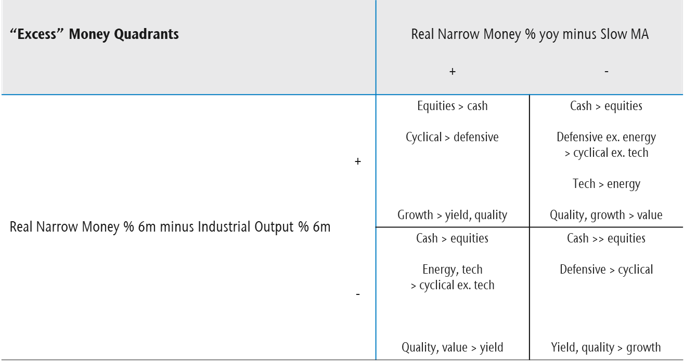
The two indicators were negative from January 2022 (allowing for reporting lags) through year-end but the last quarterly commentary suggested that the first measure would turn positive in early 2023 as weakening industrial output momentum crossed below stable or rising real money momentum. Based on historical patterns, the implied shift from the bottom right to top right quadrant might be associated with less negative equity markets and a reversal of some of last year’s sector / style moves, including relative recoveries in quality / growth and tech – table 2. 

Table 2

Table 2 showing “Excess” Money Quadrants Real Narrow Money % yoy minus Slow MA

The suggested sign switch of the first indicator had not occurred by January – chart 3 – but markets appeared to front run the quadrant shift in Q1, with tech / growth outperforming strongly and energy / financials weak. A cross-over of six-month industrial output momentum below real money momentum is still expected here, although timing is uncertain – Chinese reopening has delayed industrial weakness. Some Q1 moves were extreme so it may be advisable to await confirmation before adding to favoured themes. 

Chart 3

Chart 3 showing G7 + E7 Industrial Output & Real Narrow Money (% 6m)

A common characteristic of the right hand quadrants of the table is a trend of non-energy defensive sectors outperforming non-tech cyclical sectors. The reverse occurred during Q1, although much of the cyclical relative gain unwound later in the quarter as financials were pummelled by banking crises. With no early move to the left hand of the table in prospect, an overweighting of non-energy defensive sectors – along with quality, which also usually outperforms in both right hand quadrants – is suggested. 

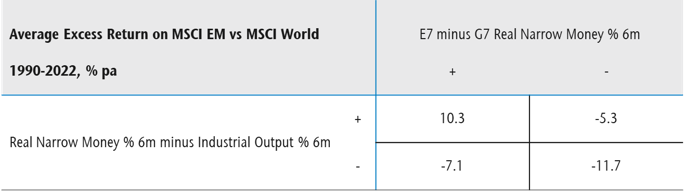
The stark contrast between positive and rising E7 six-month real narrow money momentum and faster contraction in the G7 raises the question of whether investors should overweight EM equities. Over 1990-2022, EM equities outperformed developed markets by 3.2% pa on average when the E7 / G7 real money momentum gap was positive, underperforming by 6.1% when it was negative. 

Further investigation, however, indicates that a positive gap is a necessary but not sufficient condition for EM outperformance – the global “excess” money backdrop, in addition, needs to be taken into account. Table 3 shows that, since 1990, EM equities have outperformed on average only when both the E7 / G7 gap and the first global excess money indicator were positive. Confirmation of a sign change in the latter indicator would strengthen the case for overweighting EM. 

Table 3

Table 3 showing Average Excess Return on MSCI EM vs MSCI World 1990-2022, % pa E7 minus G7 Real Narrow Money % 6m

Historically, periods of sustained EM outperformance coincided with trend declines in the US dollar. The dollar reached major peaks in 1969, 1985 and 2002. These peaks occurred 6-7 years before housing cycle lows (in 1975, 1991 and 2009). Assuming a normal (i.e. c.18 year) cycle length, another cycle low is scheduled for the late 2020s. A dollar peak in October 2022, therefore, may turn out to be a major top, preceding a trend decline into or beyond the housing cycle trough.

Federal Reserve Bank of Chicago.

It has been an extremely busy period as we navigated the banking environment. The risk of contagion is top of mind as well as the impact on our investments. The difficulty is that for a bank, added outsized risk can come in many shapes and forms. In 1907, the crisis came from overzealous bank owners attempting to corner the copper market. Today, for SVB, it came from duration misalignment of investments and even cryptocurrencies for Signature Bank. Elevated risk taken by banks often occurs when executives allow deposits and loans to grow faster than what their specific team of lenders and investment managers can handle in relation to risk.

Elevated risk can also come from other sources, such as too much government intervention in the case of the Baoshang bank in China in 2019 or severe mismanagement at all levels in the case of Credit Suisse. That’s the bad news. With 25,000 banks globally and 4,844 in the U.S. alone, let’s expect further difficulties to the system. Outflows are at 1.9%.

The good news is this is taken with extreme attention by government and banking associations. In the last two weeks, our team has travelled extensively, especially in Japan and the U.S. We were actually in California when we noticed the SVB debacle on the Friday. During a Monday morning presentation, a non-portfolio company commented that it had a US$80 million deposit with the California bank. All access to deposits was resolved by 11 a.m., certainly a sign of quick response.

Global Alpha holds larger exposure to financial services firms than bank stocks themselves. Its largest exposure is with Rothschild & Co (Roth FP), which provides global financial advisory (mergers and acquisitions and financing advisory). The company also has a wealth division and merchant bank that account for 24% and 16% of sales, respectively. Tracing back to 1760, the company now operates with 4,200 financial specialists across 40 countries. From its strong Europe-based foothold, the company is successfully growing its operations in North America. Rothschild & Co is presently subject to a takeover bid by the founding family’s financial holding.

Another important position for us in financial services is PRA Group (PRAA US). The U.S.-based company is a leading debt collection agency servicing mostly the financial industry, acquiring debt packages from banks and credit card companies. PRA is vertically integrated, from debt acquisition all the way down to call center-based collections, giving it a strong competitive edge. Increasing regulations implemented in the debt collection industry are certainly favouring PRA in the long term. The company has global footprint, with leading operations in North America and Europe.

Our positioning in regulated banks follows our general philosophy of investing in quality assets where we assess balance sheet strength, operational excellence, competitive standing and target markets. We generally tend to be underweight in banks, as most banks have low exposure to higher-growth investment themes and/or are constrained by increasing regulations. Our holdings include: 

Seven Bank Ltd. (8410 JP): The company provides banking services mainly through automated teller machines (ATM) across Japan. Culturally, the Japanese continue to rely on cash as their preferred payment method, mostly for security and identity theft reasons. Although licensed under a bank charter, Seven Bank majorly operates as a technology company through its 26,253 ATM outlets. Services are growing rapidly supplementing cash distribution, and novel and growing additions include credit and investment services. Its balance of deposits stands at ¥578 billion while its loan book conservatively stands at ¥32.7 billion.

With over 250 banks in our index, Global Alpha has low exposure to direct commercial real estate lending, an area that is being scrutinized with the increasing vacancies in commercial downtown centers. Our direct exposures are the following:

Wintrust Financial Corp. (WTFC US): Wintrust is a financial holding company with community bank locations in and around Chicago and northern Illinois, southern Wisconsin and northwest Indiana. Branded as Chicago’s bank, its lending book is highly diversified with a low exposure (6%) to residential real estate, all else mostly being small commercial (sub US$1.5 million) suburban business loans, with downtown office commercial real estate being a small part. An additional Wintrust differentiator is that it owns 15 bank charters, providing FDIC coverage 15 times over for every customer, or up to US$3.75 million in total guaranteed deposit coverage. We believe Wintrust will gain market share as it further commercializes this service.

UMB Financial Corp. (UMBF US): UMB is a U.S.-licensed bank operating nationwide, with main branches throughout Missouri, Illinois, Colorado, Kansas, Oklahoma, Nebraska, Arizona and Texas. Its US$31 billion in deposits is only 20% exposed to the consumer market. Deposits are otherwise commercial (46%) and financial services (17%). The majority (54%) of its US$17 billion loan book is in commercial and industrial lending. UMB maintains a low loan-to-value ratio (currently at 59%). With a 54% loan-to-deposit ratio, UMB also remains at the low end of the 74% peer median.

As you can see, our investment process has led us to financial services companies and banks with differentiated offerings, competitive advantages and defendable barriers to entry. These specialty-focused organizations tend to operate outside of the core banking space where increased risk (from volatile and unpredictable deposits and loans) is taken to achieve return targets. We will continue to monitor the bank environment as well as the health of our bank investments through direct engagement.

Image of office skyscrapers with reflections in the sunlight

Connor, Clark & Lunn Funds Inc. (CC&L Funds) is excited to announce two absolute-return oriented portfolios in liquid alternative fund form, CC&L Global Market Neutral II Fund and CC&L Global Long Short Fund (the Funds).

CC&L Global Market Neutral II Fund seeks to earn a positive and attractive risk-adjusted return over the long term while demonstrating low correlation with, and lower volatility than, traditional equity markets. Risk rating: Low to Medium.

CC&L Global Long Short Fund seeks to provide long-term capital appreciation and attractive risk-adjusted returns by actively investing in a portfolio of long and short securities. Risk rating: Medium.

To manage the Funds, CC&L Funds has retained Vancouver-based Connor, Clark & Lunn Investment Management Ltd. (CC&L Investment Management), one of Canada’s largest privately-owned asset management firms, with close to 20 years of experience in managing alternative investment strategies for institutional investors.

“We have been told by our client base that they want access to institutional-caliber alternative investments, managed by a team with a demonstrated track record of success, in the convenience of a liquid alternative fund. By introducing these two new portfolios, we are meeting those objectives and providing investment advisors and their clients with two attractive risk & return profiles to choose from,” said Tim Elliott, President and CEO of CC&L Funds.

“We are excited that these alternative investment solutions are being made available to a broader group of individual Canadian investors. As we have transitioned into an environment with structurally higher interest rates and inflation, we expect market cycles to be shorter, volatility to be higher, and returns from conventional risk assets to be lower. In such an environment, we believe it will become more important for investors to incorporate sources of return that are independent of stock and bond markets to enhance portfolio outcomes,” said Martin Gerber, President and Chief Investment Officer at CC&L Investment Management.

Both CC&L Funds and CC&L Investment Management are affiliates of Connor, Clark and Lunn Financial Group (CC&L), whose multi-affiliate structure brings together the talents of diverse investment teams that offer a broad range of traditional and alternative investment solutions. CC&L is one of Canada’s largest independently owned asset managers, responsible for over $104 billion in assets on behalf of institutional and individual investors.

About the funds

Available in A and F Series, the Funds conform with the regulatory framework related to alternative mutual funds offered by Simplified Prospectus. The Funds are offered through licensed investment dealers, priced daily, with daily liquidity, and available through FundServ.

About Connor, Clark & Lunn Funds Inc.

Connor, Clark & Lunn Funds Inc. (CC&L Funds) partners with leading Canadian financial institutions and their investment advisors to deliver unique institutional investment strategies to individual investors through a select offering of funds, alternative investments and separately managed accounts.

By limiting the offering to a focused group of investment solutions, CC&L Funds is able to deliver unique and differentiated strategies designed to enhance traditional investor portfolios. For more information, please visit cclfundsinc.com.

About Connor, Clark & Lunn Investment Management Ltd.

Connor, Clark & Lunn Investment Management Ltd. (CC&L Investment Management) is one of the largest independent partner-owned investment management firms in Canada with $54.2 billion in assets under management. Founded in 1982, CC&L Investment Management offers a diverse array of investment services including equity, fixed income, balanced and alternative solutions including portable alpha, market neutral and absolute return strategies.

CC&L Investment Management is a part of Connor, Clark & Lunn Financial Group Ltd. (CC&L Financial Group), a multi-boutique asset management company whose affiliates collectively manage approximately $104 billion in financial assets. For more information, please visit cclinvest.cclgroup.com.

About Connor, Clark & Lunn Financial Group Ltd.

Connor, Clark & Lunn Financial Group Ltd. (CC&L Financial Group) is an independently owned, multi-affiliate asset management firm that provides a broad range of traditional and alternative investment management solutions to institutional and individual investors. CC&L Financial Group brings significant scale and expertise to the delivery of non-investment management functions through the centralization of all operational and distribution functions, allowing talented investment managers to focus on what they do best. CC&L Financial Group’s affiliates manage over $104 billion in assets. For more information, please visit cclgroup.com.

Contact

Lisa Wilson
Manager, Product & Client Service
Connor, Clark & Lunn Funds Inc.
416-864-3120
[email protected]

Selamat Datang Monument in central Jakarta, Indonesia.

We believe emerging markets (EMs) offer a multitude of benefits to equity investors, including: 

  • High growth potential. EMs typically follow rapid economic growth trajectories, which can be reflected in the performance of companies operating within these markets. 
  • Undervalued quality assets. EMs are home to many high-quality companies not yet recognized by the broader investment community. As these companies grow, they gain awareness and appreciate. 
  • Diversification. Investing in EMs can help diversify portfolios concentrated in more developed markets, enhancing their risk-return profile. 
  • Favourable demographics. Most EMs have young and growing populations that can drive economic growth and provide opportunities for companies catering to these markets. 

Small-cap (SC) companies can often have significantly more room for growth than their larger peers, as they launch new products and expand into new markets, providing substantial upside potential. Also, because they are typically less known outside of their domestic market and inadequately covered by sell-side analysts, they can present “hidden gem” opportunities that the market maybe be overlooking. The EM SC investable universe comprises over 11,000 companies offering a wide variety of investment ideas across 24 countries and 11 sectors. 

For a company to be included on our shortlist, it must be run by an outstanding management team and have a sustainable competitive advantage and defined growth strategy within what we believe is an attractive market. Although we are bottom-up investors, we are also macro aware and acknowledge secular investment themes in the EM middle-class consumer space. Notably, EM countries have nearly four times the middle-income households as their developed market counterparts.  

Indonesia, which we last wrote about in August 2021, is the largest economy in Southeast Asia, the world’s fourth most populous country and home to more than 50 million consumers in the middle-income bracket. Amid gloomy economic projections for many countries globally, Indonesia is expected to experience only a mild slowdown and actually grow 4.8% in 2023. Its economy is supported by strong exports, investment (with foreign direct investment having consistently posted new records every quarter last year) and household spending (being the most significant GDP contributor). Even with the possibility of a global recession and a tight global financial environment threatening Indonesia’s momentum, our view is that companies with sustainable business models, pricing power and appealing product offerings can nevertheless extract meaningful benefits. We believe that one of our Emerging Markets Small Cap portfolio’s core holdings offers the best exposure to Indonesia’s middle-income consumers.

Business overview

Mitra Adiperkasa (MAPI IJ) is Indonesia’s leading multi-format lifestyle retailer catering primarily to middle- and high-income earners. Since its establishment in 1995, the company has managed to build a diversified portfolio of franchise agreements with more than 150 world-class brands (e.g., Zara, Marks & Spencer, Footlocker, Converse, Starbucks, Subway, Krispy Kreme, Tissot, Pandora, Sephora, Samsonite). Mitra Adiperkasa has cultivated long-term relationships with its principals and secures exclusive rights from virtually all brands it partners with. Supported by a veritable army of 23,000 employees, the company runs an omnichannel network of nearly 3,000 physical and 20 online stores. In 2016, Mitra Adiperkasa started its overseas expansion venturing into Vietnam, followed by the Philippines in 2020, and Malaysia and Singapore in 2022.

Competitive advantages

  • Diversified portfolio of exclusive brands and long-term relationships with principals.  
  • Unmatched scale and store network. 
  • Strong reputation and track record of execution. 
  • Focus on target customers with resilient purchasing power. 
  • Solid balance sheet with net cash position. 

Growth strategy

  • Same-store sales growth and store network expansion, with a focus on higher-profit specialty stores. 
  • Addition of new brands and optimization of existing ones. 
  • Expansion in Vietnam, the Philippines and Malaysia. 

A combination of target demographics with more resilient purchasing power, a diverse portfolio of exclusive brands and a robust omnichannel strategy in our view make Mitra Adiperkasa one of the best-positioned consumer companies in the EM SC universe.

Aerial view of hotels on the waterfront in Hollywood, Florida, USA.

With COVID-19 restrictions behind us, our team has been hitting the road, meeting over 300 companies in the past two months at conferences and onsite, from India to Chile, from Florida to Whistler. One of the conferences we attended was the 32nd BMO Global Mining & Critical Minerals Conference that took place in Florida from February 26 to March 1.

The largest conference of its kind, it brings together over 350 companies including all the majors: Rio Tinto, BHP, Vale and Freeport-McMoRan. We met over 30 companies and attended various panels.

New this year was inviting critical minerals companies that explore and produce lithium, cobalt, graphite, and other metals. These will be key on the journey to decarbonization, either via battery-electric vehicles or renewable power.

It is always interesting to attend a mining conference. The optimistic nature of management teams, the promotional aspect of companies trying to raise billions to find metal in a pile of rock in a remote area and then building the mines, roads and infrastructure to bring it to production. There are many interesting characters to say the least.

What were some observations and how does it relate to our commentary this week about the battle against inflation? One main takeaway is that the two megatrends of urbanization and the need to reduce carbon emissions to limit the temperature rise are very much intact. China at 64% is probably two-thirds of the way in terms of people moving to cities. As a comparison, the U.S. is at 83% whereas countries like India are only at 36%.

Share of urban population worldwide in 2022, by Continent

Northern America: 83%.
Latin America and the Caribbean: 81%.
Europe: 75%.
Oceania: 67%.
Worldwide: 57%.
Asia: 52%.
Africa: 44%.
Source: United Nations

Urbanization comes with the need to build new infrastructure as well as replace aging infrastructure, some dating as far back as the 19th Century.

An interesting fact is that since the beginning of the Copper Age around 4500 BC, almost 7,000 years ago, 700 million tons of copper has been mined until today. In the next 25 years alone, the world will need another 700 million tons.

Where will we find it? How much will it cost to bring it into production? We can assume it will be a lot more, in other word, inflationary.

Copper price 1989 to today

Graph showing the dramatic increase of the price of copper from 1989 to 2023.
Source: LME and CRU

This is a long introduction to this week’s commentary. Are the central banks winning the war on inflation?

Earlier this year, market participants thought we had made good progress as we started to see inflation numbers come down from their peaks. We started assuming interest rates had peaked and would even start to decline in the second half of 2023.

Since then, economic data out of the US, Canada, Europe and China has shown:

  • a resilient economy,
  • a confident consumer,
  • strong job creation. And surprise!
  • an increase in inflation from December to January.

US Personal Consumption Expenditure Core Price Index YoY

Graph showing the increase of US Personal consumption expenditure core price index year over year from 2018 to 2023.
Source: Bureau of Economic Analysis

Obviously, bond and stock markets have retraced much of their positive returns.

Where is inflation headed now?

Let’s focus on the US.

Components and weight in CPI calculation (source Bureau of Labor Statistics)

Food and beverages 14.40%
Housing 44.4% of which owner equivalent rent of residence is 25.4%
Apparel 2.50%
Transportation 16.7% of which 8.1% is new and used vehicle
Medical Care 8.10%
Recreation 5.40%
Education and Communication 5.80%
Other good and service 2.80%

In aggregate, commodities including food and beverage is approximately 41% and services is 59% (includes rent).

Graph of US CPI Owner Equivalent Rent YOY

Graph of US CPI owner equivalent rent year over year from 1985 to 2023.
Source: Bureau of Labor Statistics

So, as can be seen from the weight of the various components and the chart above, rent will go a long way in terms of determining the direction of inflation. Although we have recently heard of rent peaking, we are still looking at high single-digit increases on a year-over-year basis. Since this data normally lags about six months, we do not expect a large decrease in this measure to bring down inflation. Furthermore, looking at the graph above, it has mostly been above 3%, except the period following the global financial crisis of 2008.

Last December, we were of the view that inflation would still be above 5% at the end of 2023, a view that was not widely shared. Now in March, the data seems to validate our view.

The Fed needs to continue raising rates. How high will they go?

The market now expects a terminal rate at around 5.5% and many funds are buying options where rates may reach 6%.

We still believe the only way to break inflation expectations — which is what the Fed is focused on — is to see slack in the labour market.

That probably means an unemployment rate above 6% and we are far from that level.

With Delta Airlines announcing this week there will be an increase of 34% for its pilots for the period 2023-2026, we are far from seeing wage increases at 2%.

We also need to see home prices decline by 20% or more. Prices are still going up year-on-year and should register their first modest decline by April of this year.

As we wrote last week, the recent rally has been of poor quality. Like in the summer of 2020, unprofitable companies with weak balance sheets have been the best performers.

Our portfolio is well positioned for a more difficult environment in 2023, i.e., much lower economic activity and even a recession combined with higher interest rates.

Toward the end of the first quarter of 2023, we expect a rotation to higher quality companies with little or no debt and the ability to gain market share. We are already seeing green shoots with small cap and international markets outperforming this year.

Aerial view of oil refinery at sunset, Austria.

Europe’s economic outlook has seen a clear improvement in less than three months. The risk of a gas shortage in Germany has disappeared at least for 2023. Thanks to a decrease in energy usage and some industrial delocalization outside Germany, Europe’s energy consumption has decreased by 19% since last summer. According to the ZEW – Leibniz Centre for European Economic Research, economic sentiment indicators rose to 28.1 for a fifth consecutive month, 11.2 points above the level of the previous month. Service PMIs reading also beat all expectations and posted decent growth in both continental Europe and the UK.

As demand stays firm and China reopens, there will be growing pressure on central banks to hike rates further to contain demand. Inflation has just started to cool off in Europe, but levels are still elevated. Consequently, interest rates could stay higher than expected for some time.

Here are some observations following some earnings results that came out for Q4 (2022):

  • Q4 earnings and top-line growth declined sequentially but held up well, given the still solid demand and pricing.
  • Companies expressed more optimism for the global economy but were incrementally more cautious on margins levels, foreign exchange tailwinds and demand for 2023.
  • A lower proportion of companies mentioned having enough pricing power to pass on inflation in the short term.
  • Labour cost component is becoming the primary source of concern on the cost side, as supply chain and energy costs have come down considerably.

We believe that the old continent prospects look better than they appear. Some of the highlights and attractiveness of European companies include:

Forward price-to-earnings ratio

Forward price-to-earnings ratios for European companies have been attractive relative to the S&P 500. The discount has been even stronger for the UK FTSE 350 Index as shown below.

STOXX 600 and FTSE 350 12-month P/E forward relative to S&P 500

Forward price-to-earnings ratios chart for STOXX 600 and FTSE 350 relative to the S&P 500 over the month of July.
Source: Berenberg

Cash positions

Cash piles have been quite considerable since the global financial crisis, and especially in the UK post-Brexit. Geopolitics and macroeconomics have pushed UK companies to increase their cash positions to more than £576 billion at the end of 2022. We believe that once confidence returns, capital spending should resume.

Deposit of UK non-financial institutions (£bn)

Cash deposits of UK non-financial institutions in billions of euros from 2018 to 2022.
Source: BoE, Berenberg

Debt levels

Balance sheets have improved across all segments in both the UK and continental Europe. Thanks to stronger GDP levels driven by inflation, debt levels as a percentage of GDP decreased to levels last seen in 2009. Corporate debt levels even returned to 2007 levels.

Outstanding debt in % of GDP

Outstanding debt in percentage of GDP from 1987 to 2022.
Source: ONS, Berenberg
Empty theatre seats with 2 bags of popcorn in the two front seats.

January was a strong start to the year for equity markets. In fact, the Nasdaq is off to its best start since 1991. Given that lenders (banks) are building reserves to prepare for a recession, and the money printers (central banks) are trying to cool the economy, the strength of equity markets seems to defy logic. It’s as if financial markets are completely ignoring the recession nipping at our heels. What’s driving this?

You guessed it: much of the January returns were powered by a trash rally. We’re talking about low-quality, high volatility stocks driven up by retail investors and internet frenzy.

Source: Sain Godil’s phone

What defines a trash rally?

Remember the GameStop phenomenon of January 2021? This is a textbook example of a trash rally. A near-bankrupt company saw its stock skyrocket thanks to a bizarre retail trading frenzy and a rash of internet jokes and memes. This resulted in a significant and illogical increase in stock price (trash rally) and the origins of the term “meme stock.”

Meme stocks are defined by several key characteristics:

  • low ROE
  • negative earnings
  • high leverage
  • low market cap
  • high short interest
  • weak leadership

The current trash rally is being fueled by a resurgent risk appetite among some investors. We’re seeing explosive growth in a variety of meme stocks this month after a crushing year for equities, although many analysts are skeptical the most recent moves will last.

A closer look at the data

According to JP Morgan, retail market orders reached 23% on Jan 23, 2023. To put things in perspective, when the original GameStop saga began, retail trading peaked at 22%. The result of this euphoria can be seen below with the year-to-date performance of these high beta stocks including some indexes that replicate low-quality stocks.

How has the performance been since January 2022

Source: Global Alpha Capital Management and Bloomberg

How are those meme stocks doing since January 2022?

Two years ago, we were all stuck at home, feeling bored, and getting a false sense of financial security from stimulus checks. With sports events and gambling closed, retail investors made the stock market their casino. While some retail investors made a fortune, unfortunately, many lost a lot. The above charts (blue bars) show how most of the names have been cut in half, if not more.

Management teams of many meme stocks took advantage of the inflated stock prices to issue more equity and improve their finances. According to the Financial Times, meme stocks have raised over $4.7 billion from the hype.

AMC, a poster child for meme stocks, raised $2.8 billion from sales of equity and new debt. Fundamentally their business has not improved with current sales below 2018 revenue, and EBITDA is expected to be half of what they did in 2018. This is despite the fact that Avatar: The Way of Water is close to collecting $2 billion in global box office ($623.5 million in the U.S.).

Here we go again

All signs point to another meme stock rally. Take troubled retailer Bed Bath & Beyond, for example. They missed interest payments on bonds on Jan 29, which may lead to bankruptcy, and yet the stock price appreciated by 129% in just over a week. Carvana, the debt-strapped online used-car retailer is up 143% year-to-date. A meme stock favourite, Carvana was trading at $11.55 at the point of writing, way below its peak of $370 set in August 2021. Despite being down almost 98% from its peak, more than 266,000 call contracts changed hands on January 30, 2023 according to Bloomberg.

Is this just a U.S. Phenomenon?

The Bonusetu (a Finnish Casino) research team combed through Google trends for each European country to find the most Googled stock for each country. Tesla took the top spot in a whopping 28 countries and AMC is most popular in five countries. Below is a screenshot or performance of some other names in the group.

While we understand Google trend data does not necessarily mean Europeans participated in the trades, it’s difficult to imagine an alternative explanation. Was everybody in the UK, Germany, Ireland, and Croatia just purchasing tickets to watch Avatar at an AMC theatre? Or booking their next vacation on Icelandic Air or Virgin Galactic? It seems far more likely they were getting seduced by meme stocks.

Will history repeat itself?

Once again euphoria has set in and everyone is having a good time, gleefully ignoring the well-documented consequences of excessive indulgence. We’ve seen this story play out several times over the last few decades. Think back to 2001. That year, Nasdaq was up 12% in January but fell over 30% in the following 11 months when the dot-com bubble burst. In our February 11, 2021, weekly called The Canary in the Coal Mine we compared the meme stock situation to the tech bubble as well as the 2008 financial crisis.

Portfolio Impact

Popular media is once again helping stir up the meme stock frenzy. As we see a repeat of the same movie (no pun intended, AMC) this may have an unfortunate impact on higher-quality names that could get mispriced lower. The good news? For long-term investors in quality companies, this provides an amazing opportunity to buy quality companies at attractive valuations.

Our ability to be highly selective and nimble in our portfolio holdings leaves us well-positioned to enter a period of great opportunity for fundamental stock pickers. Our focus on high-quality companies with defensible business models and strong balance sheets should help outperform our small-cap benchmark. As we reflect on the state of markets and the fundamentals of our target companies, we are excited about the current environment and future growth opportunities.

The two measures of global “excess” money tracked here remain negative, arguing for a cautious view of equity market prospects. 

Excess (or deficient) money refers to the difference between the actual money stock and the demand for money to support economic transactions. According to “monetarist” theory, a surplus is associated with increased demand for financial / real assets and upward pressure on their prices, assuming no change in supply. 

Excess money is unobservable so two proxies are followed here: the difference between six-month rates of change of global (i.e. G7 plus E7) real narrow money and industrial output; and the deviation of 12-month real narrow money growth from a slow moving average. 

Historically (i.e. over 1970-2021), global equities outperformed US dollar cash on average only when both measures were positive. Unsurprisingly, average performance was worst when both were negative (underperformance of 8.9% pa). These results allow for reporting lags in monetary / economic data. 

The second measure turned negative in October 2021, which was known by end-November. The first measure followed in November, which was known by end-January 2022 (a longer lag because industrial output numbers are released after monetary / CPI data). 

Previous posts noted a recovery in global six-month real narrow money momentum during H2 2022*. With industrial output expected to weaken, it was suggested that the first measure would turn positive, possibly by December. 

The second measure – based on 12- rather than six-month real money momentum – was deeply negative in late 2022, with a switch to positive deemed unlikely before mid-2023. 

The suggested switch positive in the first measure has yet to occur. The six-month rate of change of industrial output crossed below zero in December but remained just above real narrow money momentum – see chart 1. 

Chart 1

Chart 1 showing G7 + E7 Industrial Output & Real Narrow Money (% 6m) highlighting August 2022

Will a cross-over have occurred in January? Partial data suggest that the recovery in real money momentum stalled last month. A reliable January estimate of industrial output won’t be available until mid-March. A reopening bounce in China could offset weakness elsewhere. 

A further point is that the recovery in global real narrow money momentum since mid-2022 partly reflected a strong pick-up in Russia, which may be of limited global relevance given the country’s enforced economic and financial isolation. 

Chart 2 shows the result of replacing Russia with Indonesia in the G7 plus E7 real money calculation from January 2022, before the February invasion of Ukraine**. The trough in real money momentum is placed in October rather than August, with the subsequent recovery even more anaemic. 

Chart 2

Chart 2 showing G7 + E7 Industrial Output & Real Narrow Money (% 6m) highlighting October 2022

*The trough in real money momentum originally occurred in June but is now placed in August, partly reflecting revisions to US CPI seasonal adjustments.

**The other E7 countries (as defined here) are Brazil, China, India, Korea, Mexico and Taiwan.

Salmon fish farm. Bergen, Norway.

This week we will be discussing a new addition to the portfolio, SalMar (Ticker: SALM NO), and the latest developments in the salmon farming industry.

The global salmon market was estimated to be a US $50 billion industry in 2020 and expected to grow at 3.7% a year to reach $76 billion by 2028. The growing disposable income in emerging countries and subsequent changes in dietary habits are some of the main drivers behind this growth. Consumers of salmon are more often from the middle- and upper middle-classes who are generally less sensitive to economic slowdowns and less likely to dramatically change their spending patterns, particularly in food purchases. In addition, the health benefits of eating salmon rich in Omega-3 over red meat are well-documented. As a protein, its feed conversion ratio (i.e., the kilograms of feed needed to increase the animal’s body weight by one kilogram) is one of the best among the protein sectors.

Global Alpha received the SalMar shares as part of the cash and share deal that SalMar made to acquire our previous holding in the portfolio, Norway Royal Salmon. The combined entity creates the second-largest salmon farmer in the world.

Both parties have operations in Northern and Central Norway. With this new acquisition, synergies will come from improved utilization of available biomass i.e. the total weight of the fish. SalMar will implement their best-in-class practices at the existing Norway Royal Salmon operations in Norway to improve biological challenges. Gaining increased access to smolt (juvenile salmon) will give SalMar additional benefits stemming from vertical integration such as increasing the quantity of harvested fish, which will optimize the utilization of the processing facility.

However, before the deal closed, the industry received some unexpected news. On September 28, 2022, the Norwegian government announced the most significant change to date to the salmon industry’s regulatory framework by imposing a 40% resource tax on salmon and trout farming in Norway. This would take the marginal tax rate of producers from 22% to 62% if implemented in the initially proposed form. A resource tax is already levied on oil and gas, hydropower operations, and profits generated using Norway’s natural resources.

The major salmon producers were quick to respond to the government’s proposal:

  • SalMar: “Earlier this year, SalMar bought its relative share available for a fixed price for the capacity adjustment in the traffic light system. 1,223 MAB tonnes for a total consideration of NOK244.6 million. SalMar has chosen to use the opportunity to terminate the purchase. This is due to the resource rent tax the Government has now announced.” 
  • Leroy Seafood (LSG NO): “In 2022 Leroy purchased 614 tonnes maximum allowable biomass under the so-called traffic light system at a total value of NOK123m. Leroy has decided to cancel this purchase. Increasing the tax rate from 22% to 62% creates unreasonable framework conditions for the industry in Norway, changing the scope and incentives for investments in areas other than maintenance capex. All major new investments in the Group’s value chain in Norway must regrettably be put on hold pending the decision of the Storting, the Norwegian parliament.” 
  • Mowi (MOWI NO): “In light of the Norwegian government’s proposal for a 40% resource tax on Norwegian aquaculture, and a resulting total tax of 62%, Mowi is cancelling its acquisition of 914 tonnes MAB for a total value of NOK183m. The government’s tax proposal means that Mowi can no longer justify the purchase price. Mowi respectfully advises the government to reconsider its resource tax proposal.” 

In addition to suspending purchases, the biggest salmon producers were notably absent from the first auction of biomass capacity since the government proposed the resource tax, even though these same producers bought capacity at the previous auction in 2020.

More recently, shares of the Norwegian salmon producers have been reacting to headlines from politicians. They first rose after Geir Pollestad, deputy leader of the Norwegian Center Party, told a local newspaper that the party was open to modifying the tax. However, finance minister Trygve Vedum said shortly afterward that the original proposal of a 40% tax should remain. With the governing parties losing popularity, and amid growing concerns about the over-reliance of regions on the salmon industry for employment, we foresee a compromise will be reached and a modified version of the original proposal will be implemented.

Supply growth should remain muted given increased biological challenges and stricter regulations. We see support for salmon prices and demand for salmon is likely to remain strong despite the challenges. These social and environmental aspects are further reasons why exposure to the salmon industry is attractive and we will continue to follow as developments unfold.

US and UK CPI data this week elicited opposite market reactions but core momentum has recently slowed notably in both cases, consistent with a moderation in money growth rates two years earlier. 

Chart 1 shows three-month annualised rates of change of preferred core measures – CPI ex. food, energy and shelter for the US and CPI ex. energy, food, alcohol, tobacco, education and VAT change effects for the UK. US three-month momentum was just 1.5% in January, while UK momentum fell sharply to 2.8%.

Chart 1

Chart 1 showing US / UK Core CPI Measures (% 3m annualised)

The ”monetarist” rule of thumb is that money leads prices by about two years. Chart 2 superimposes three-month rates of change of broad money. Growth peaked in May 2020. The recent significant declines in core CPI momentum began in June 2022 in the UK and July in the US.

Chart 2 

Chart 2 showing US / UK Core CPI Measures & Broad Money (% 3m annualised)

Average broad money growth of 4.5% pa in both the US and UK over 2010-19 was associated with sub-2% average core CPI inflation. Three-month rates of change of broad money moved below 4.5% annualised on a sustained basis in March 2022 in the US and June in the UK. A reasonable expectation, therefore, is that core CPIs will be rising at a sub-2% by mid-2024 in both cases.

The path lower in money growth from the May 2020 peak was bumpy and core CPI momentum is likely to display similar volatility around a declining trend.