With the economic recovery slowing, one of the few central banks reducing rates due to deflation fears, increasing trade tensions and geopolitical escalation, risk-averse foreign investors are reducing their weighting of China’s financial markets. This decline in investment is driving down both stock prices and the value of the yuan.
The real estate sector, which combined with related industries accounts for 20% to 30% of China’s GDP, has not rebounded as expected. China’s new home sales by area fell 11.8% on the year in April, following a drop of 3.5% in March.
I recently spent close to a month in China, visiting relatives and friends for the May Day holiday that runs from April 29 to May 3. I also had the opportunity to meet many entrepreneurs, government officials, professionals and students as well as many of our holdings and companies we are interested in.
I spent a few weeks in Jiangsu province, a province about the size of Portugal or Kentucky that borders Shanghai. It is a province of 85 million people that has the second-highest GDP per capita (US$21,647 nominal), again higher than Portugal or Greece. If it were a country, it would be the 10th-largest economy in the world, just behind Canada and ahead of Brazil. As a US state, it would be the fifth-largest by nominal GDP, just behind Florida.
I also spent a week in Sichuan and its capital Chengdu, a modern metropolis of 26 million people, the fourth-largest city in China. The country’s so-called Western capital, Chengdu’s history dates back over 5,000 years. Nowadays, it is recognized by UNESCO as a city of gastronomy and is most often associated with the giant panda that makes the region its home. Although 1,700 km away from Shanghai, it is considered a beta+ (global second-tier) city, together with places like Washington DC, Miami, Houston, Berlin and Barcelona. More than 300 Fortune 500 companies have operations in Chengdu.
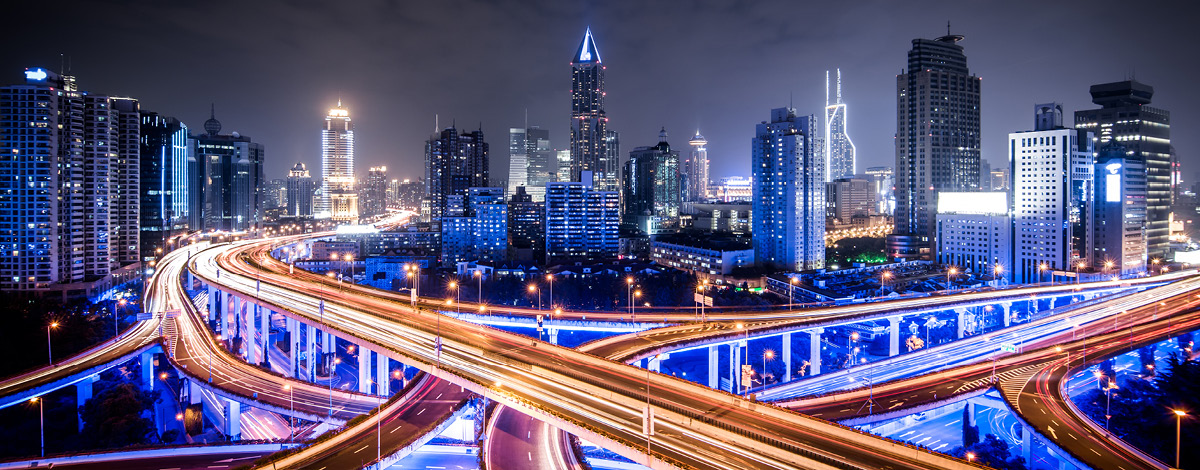
I spent my last week in Shanghai which needs no introduction, a global metropolis of 34 million people.
I will share my observations in no order of importance.
Geopolitics
During my stay, I did not witness or hear much about trade issues and other tensions that North American news outlets tend to cover. There is almost no coverage of the war in Ukraine. Most ordinary citizens have neither a pro-Russia nor pro-Ukraine view. Instead, news coverage focuses on the positives. Examples include projects or investments, cooperation deals and cultural exchanges between China and the rest of the world, from Morocco to Malaysia.
I did not feel any animosity towards me, a Caucasian man from North America. I found going through customs and travelling across China easier even than before COVID.
I also noticed much fewer foreigners. I was told that the Germans and Japanese still have an important presence, but Americans are seemingly gone. Also noticeable is the number of African businesspeople and students.
COVID and its aftermath
COVID has had a profound effect on the Chinese population. From mid-2020 to mid-2022, the country was isolated. There were almost no cases and life continued almost normally while much of the rest of the world was under some restrictions. Then the world reopened and China implemented the harshness measures of confinement and quarantine. In Shanghai, people were restricted from leaving their apartments for over two months. Hospital doctors and nurses stayed at work knowing that if they left, they could not return. People have been traumatized. More on this later.
After reopening last Fall, life today is largely back to normal. Except for an antigen test required for arrivers to China, there are almost no COVID measures. Maybe 10% of people wear masks, but they are not compulsory anywhere, even in hospitals. For foreigners, the country accepts valid visas that were issued before COVID and has resumed issuing new 10-year travel visas.
Most Chinese people have caught COVID, often more than once.
The strength of the economy
China’s economy is the world’s largest by GDP based on purchasing power and second by nominal GDP. In August 2021, President Xi Jinping first introduced the concept of common prosperity. The goal is to reduce inequalities and make regional development more balanced and people centered.
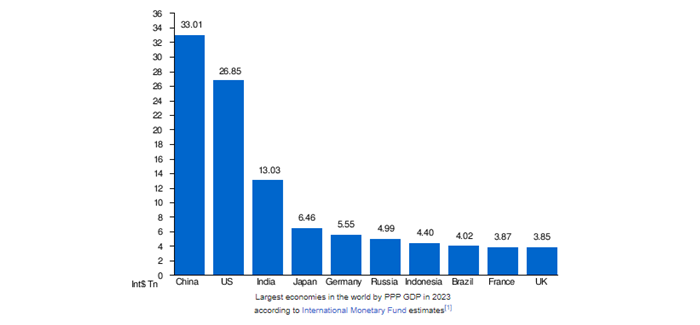
Barring a more significant decoupling from the US and some European economies, the Chinese economy is on a path to expand modestly over the next few years – the government’s goal is 4% to 5%. Is it achievable? Even if growth did not reach these levels, we believe the country still presents many opportunities. Let’s review important sectors of its economy.
The real estate sector
Foreign investors have called the Chinese real estate market a bubble for at least 20 years. It probably was to a certain extent, but it had solid underpinnings including China’s rapid urbanization. For example, Chengdu more than doubled its population between 2000 and 2020.
A foreigner visiting China for the first time might think that construction is booming. For myself, a regular traveller to China since 2000, construction has never seemed so slow. The number of new projects is the lowest I have ever seen. The number of stalled projects in every city is noticeable.
What does that mean? A recession in China and a collapse that resembles the Great Financial Crisis of 2008?
Given the importance of the real estate sector in China, a slowdown will have a large impact on its economy. But also on many commodity-producing countries.
A full-blown financial crisis? I do not think so! Why?
In China, more than 90% of households own their home, probably the largest percentage in the world. Housing is 59% of household total assets. However, just 18% of households have a mortgage. That compares with more than 50% in the US and Canada. Most mortgages are variable rate and rates have declined recently. A decline in property prices would not bankrupt people but a negative wealth effect would be felt.
The same can’t be said for property developers. We have already seen the world’s largest, China Evergrande Group, default on some of its debt obligations and struggle to restructure its more than US$300 billion debt load.
Who will lose? Bond holders, including US-based. Now, the default rate of US-dollar real estate bonds in China has risen to over 50% for a loss of over US$40 billion so far.
The big Chinese banks, all government controlled, will absorb much of the losses. It may explain why the world’s largest bank, Industrial and Commercial Bank of China (ICBC), a bank twice the size of JP Morgan Chase and four times the size of Royal Bank of Canada by assets is trading at 4.8x earnings (P/E) and pays a dividend of 6.24%. So, we see the risk of a full-blown financial crisis as small to moderate.
Why do we think real estate will probably never recover to its prior levels? Demographics is a main reason. China’s working population stopped growing about 10 years ago. Its actual population declined for the first time in 2022. However, its urbanization rate is still a positive driver. Now at 65%, it is expected to reach 80% by 2035, which means an additional 200 million people moving to urban areas in the next 10 to 15 years.
I have found the psychology around owning a house very different from my previous trips to China. Following the quote by Xi Jinping that houses are for living and not speculating, Chinese people are not so certain anymore that house prices can only rise. With the establishment of the property register and the expected real estate tax system being implemented soon, it will no longer cost anything to carry an empty house. Ownership of multiple empty apartments, which by some estimates exceeds 100 million, indicates there are more sellers than buyers. There are more ways for Chinese people to accumulate wealth, including an expanded stock market and other options for international investing. Finally, I have observed that the younger generation seems less interested in home buying, probably expecting to inherit one of many from their families as most are only children with two parents and four grandparents who are likely homeowners.
Reasons for China’s youth unemployment problem?
Not unlike many countries, there is a mismatch between the needs of the job market and the expectations of graduates. Joblessness among young people aged 16 to 24 rose to a record 20.4% in April, far above the pre-pandemic rate high of 13% through much of 2019.
The rise was more surprising given that China’s urban unemployment overall fell to 5.2% as of April, compared with 6.1% a year earlier. The government is trying to encourage state-owned enterprises to hire new graduates. It is also running a campaign to promote job opportunities in more manual and technical professions.

Will the “lying flat” generation rise? It certainly represents a huge pool of talent and given the relatively young retirement age (55 for women, 60 for men) and the lower birth rate, we believe this issue should get resolved relatively soon.
Where will growth come from?
So, what sectors may take the baton and contribute to future growth?
Like most mature economies, China is experiencing an enormous need for services sectors, from hospitality and tourism to healthcare.
One sector that continues to grow and benefits from investments is infrastructure.
The infrastructure sector
In its latest five-year plan, China aims to expand its expressways to 130,000 kms by 2027, up 11% from the end of 2021. This will add to what is already the biggest such network in the world. By comparison, the US had about 98,000 kms of expressways as of 2020 based on data from the Federal Highway Administration.
China’s high-speed rail network, run by state-owned China State Railway Group, spanned 42,000 kms at the end of 2022 – the longest in the world, and 13 times the size of Japan’s shinkansen bullet train network. The five-year plan will expand it by another 26% to 53,000 km in 2027. And North America still has zero kilometres.
More airports will be built, bringing the total to around 280 from 254 as of 2022.
Nationwide fixed-asset investment in transportation reached a record ¥3.8 trillion (US$537 billion) in 2022 and is set to remain about the same each year for the next five-year plan.
Again, as a comparison, the bipartisan infrastructure bill passed by President Biden at the end of 2021 authorizes up to $108 billion to support transportation projects between 2022 and 2026.
Tourism – another growing sector
One sector that China counts on to stimulate its economy and create millions of jobs particularly in remote regions is tourism. China’s domestic tourism sector is the largest in the world and China was the third most visited country by foreigners in 2019. The World Travel & Tourism Council (WTCC) expects the tourism sector to create over 30 million jobs in the next decade for a total of over 107 million people employed in tourism. Travel and tourism is expected to grow at an average of 9.7% over the next 10 years, twice the expected growth of the country overall, representing 14% of the economy.
To give you a sense of numbers, during the May Day holiday period, the first holiday after three years of strict COVID controls, more than 270 million domestic trips were made by car, rail, airplane and waterways, up 163% from last year, according to the Ministry of Transport. Railway and airplane trips exceeded 2019 pre-pandemic levels by 22.1% and 4.2% respectively, according to the ministry.
We believe that the tourism sector, which was growing faster than GDP before COVID, will continue its growth trajectory in China and elsewhere. “YOLO” seems to be one of the lasting effects of COVID.
Innovation as a growth engine
Of the 8.3 million students who graduated in China in 2021, more than half earned science, technology, engineering or mathematics (STEM) degrees. That compares to about 450,000 degrees in similar disciplines in the US.
According to the World Intellectual Property Organization (WIPO), China accounted for 46.6% of all patents issued in 2021, or 1.6 million patents, up 6% from the year before. The US was second at 17.4% or 591,000, down 1% from 2020. It was followed by Japan at 8.5% and the Republic of Korea at 7%. India was far behind with 61,000 patents.
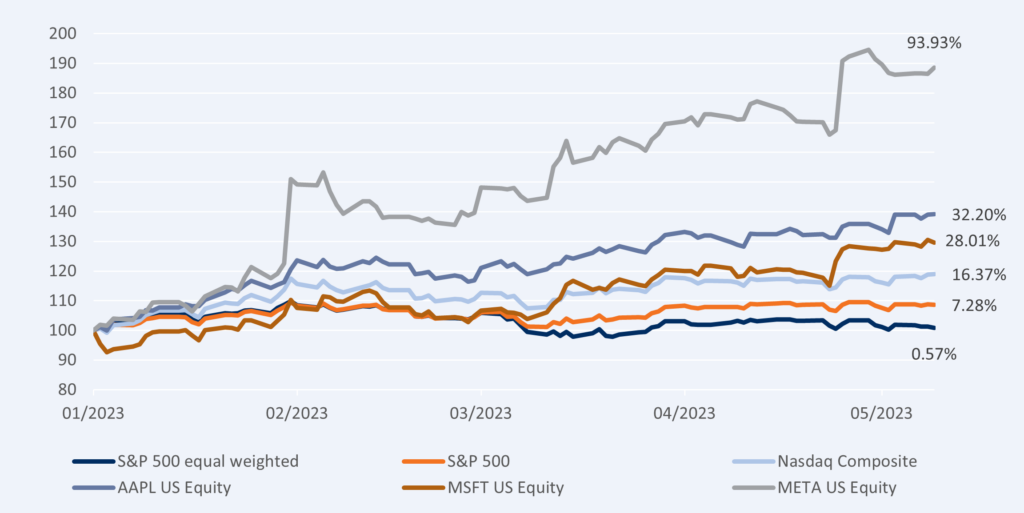
This innovation can be seen everywhere in China. In consumer electronics for example, Apple has been stuck at around 20% market share for the last few years. In Shanghai, I saw a lot more people in the Huawei store than in the Apple store across the street.
Why are Chinese brands across industries such as consumer electronics, appliances and apparel gaining market share in China? Unlike global brands, they are often specifically made for Chinese customers, understanding their preferences.
A sector where innovation and the rise of Chinese brands is particularly visible is electric vehicles (EVs).
One of the first things I noticed when I landed at most airports or ordered Didi (the equivalent of Uber) is that most cars in China are electric. Electric cars have a green license plate whereas gasoline-powered cars have blue plates.
In 2009, China became the world’s largest car market. In 2023, it will become the second-largest car exporter, behind Japan and ahead of the US and South Korea. In 2022, 27 million vehicles were sold in China compared to 14 million in the US. In China, 7 million of the cars sold were EVs. That’s 25% of the market. In the US, 750,000 were sold, or 5.6% of the market.
Much like the US in the 1920s, there are over 100 EV car manufacturers in China. In the US, by the 60s, the big 3 dominated. We can expect the Chinese market to have four or five dominant brands in 10 years.
China top 5 EV maker sales share in 2022
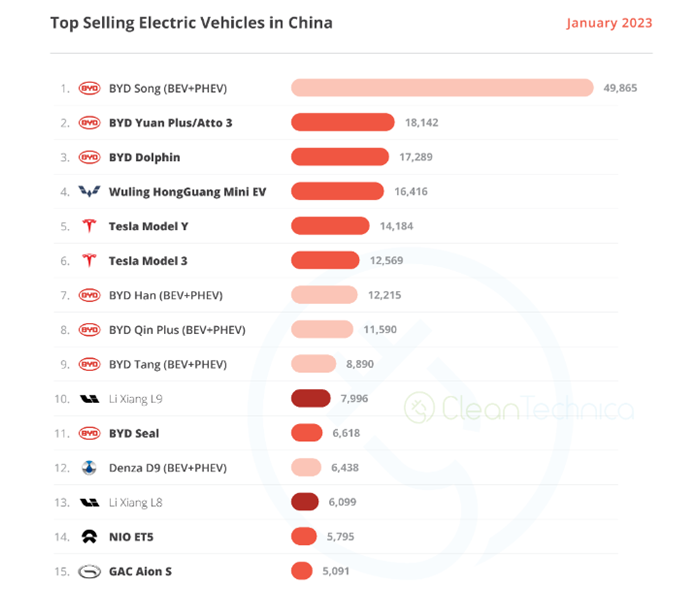
BYD (Build Your Dream), the company Warren Buffett invested in, had 29.7% market share in 2022, up from 18% in 2021. Six of the top-10 EV models sold in China in 2022 were BYD. And the company is at the top of the list when I asked people what EV car they would buy.
GM, which includes the joint venture with SAIC, had 8.9% market share. I saw many Buick electric models in China that are not available elsewhere.
Tesla is third at 8.8% market share, down from around 14% in 2021. Interestingly, when discussing cars, most people still associate luxury and aspirational brands as German, with names like Audi, Mercedes and Porsche. Tesla is not viewed as a luxury brand in China, but just another EV car brand. And with questionable quality and inferior software, a very different impression from the typical North American view. Its market share continues to drop in 2023, despite drastic price cuts.
In fourth place and growing fast is Geely, which also owns Volvo and Polestar, with 5.2% market share.
And in fifth place, Changan with 4.5%, market share and also growing.
Looking at January 2023, here are the top-15 models sold that month.
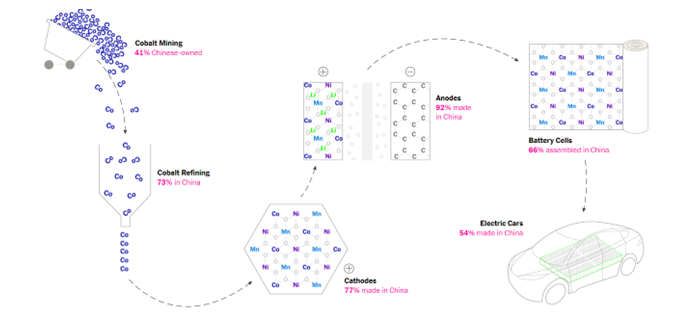
When looking at the lead Chinese EV makers, could the rest of the world catch up? The answer is probably not. Looking below at the battery supply chain explains that even with battery gigafactories built by most western automakers, the dominance of Chinese companies is structural.
This note may seem optimistic and I am. I also visited China’s largest publicly listed funeral services company, Fu Shou Yuan (1448 HK). We own it in our emerging markets fund. Last year, the company assisted over 74,000 families to honour their deceased family members.
I also visited Raffles Medical Shanghai Hospital (RFMD SP), a brand new, 400-bed tertiary hospital in the heart of the fastest growing new area of Shanghai. We have owned Raffles Medical, a Singapore-based healthcare company building a network of clinics across Asia and China, in our global and EAFE fund for the last seven years and profiled it before in these weekly comments.
There are a lot of opportunities in China, despite the rhetoric that it is un-investible.
In the last few weeks, the CEOs of JP Morgan, Starbucks, Volkswagen, Tesla and many others have gone to China and reiterated the importance of globalization and cooperation, not decoupling from China.
If, however, the situation deteriorates further, our role will be to navigate these risks and identify opportunities for our clients.
If you would like to discuss more, do not hesitate to contact us at Global Alpha.