The profound and enduring love people feel for their pets is a testament to the unique and cherished bond between humans and animals. Across cultures, generations and geographies, this affection runs deep and is driving unprecedented demand for high-quality pet care, products and services. There is no doubt that pets occupy a special place in our hearts. But should they also occupy a special place in your investment portfolio?
When it comes to investment strategy, recognizing the remarkable growth within the pet industry is paramount. At Global Alpha, our preference is to invest in large and growing markets, and the pet industry perfectly aligns with this approach. As part of our meticulous investment process, it is essential to delve into the underlying factors propelling this industry’s expansion, as these drivers often vary by theme – such as demographics, innovation and environment.
How big is the pet market in North America?
As of 2023, data from the American Pet Products Association reveals that pet ownership in the United States has reached a remarkable milestone, with 66% of households, equivalent to 86.9 million homes, proudly welcoming pets into their lives. This figure marks a substantial increase from the 56% recorded in 1988, underscoring the enduring trend of pet ownership. So, how important are these pets to their owners? An astounding 85% of dog owners and 76% of cat owners affirm that their pets hold a special place as bona fide members of their families.
In 2022, Americans alone spent $136.8 billion on their pets. Back in 1996, that number was just $21 billion. Even more fascinating is that millennials comprise the highest percentage (33%) of pet owners in the US, followed by Gen X at 25% and baby boomers at 24%.
In Canada, pet industry spending reached $12.9 billion in 2022, up a whopping 486% from $2.2 billion in 1994 according to Statistics Canada.
How is the pet market different internationally?
While the US is the clear leader when it comes to spending on pets, other countries are also seeing the market grow. In the UK, the vet market is worth more than £2 billion ($2.5 billion USD) with almost two thirds of households owning a pet.
China has become the second-largest market, even though only 23% of Chinese households have pets. China’s pet industry is expected to reach $66.1 billion by the end of this year, which is 10 times the size it was a decade ago.
At the same time, there are more than 31 million pets in India and this number is growing at an annual rate of over 12%. According to a Bonafide Research report, India’s pet care industry is expected to reach close to a billion dollars by 2025, with a CAGR of more than 19%.
How have our pet industry holdings performed?
Since inception in 2008, we have continuously maintained exposure to the animal health industry. Below are a few highlights.
VCA Antech: Profiled in our February 28, 2012 weekly
- Founded in 1986, VCA Antech is a leading animal healthcare services company
- The company provides lab testing for over 17,000 animal hospitals with over 30,000 veterinarians
- Provided exposure to animal hospitals and pet diagnostics
- Exited in Q2, 2016 as the market cap crossed the upper limit of the benchmark – the company was acquired by Mars in September 2017
Heska:
- HSKA is a veterinary diagnostic company
- It has 162 US patents and 139 foreign-issued patents
- Provided exposure to veterinary diagnostics
- Exited in Q1, 2017 as it had reached our fair value
Greencross: Highlighted in our June 3, 2016 weekly
- Australian pet health company, founded in 1994
- Number one pet care specialist in Australia, providing both retail and veterinary services
- Provided exposure to animal clinics and pet retail stores
- Exited in Q1, 2019 as it was acquired by private equity group, TPG Capital
Our current exposure to the pet industry
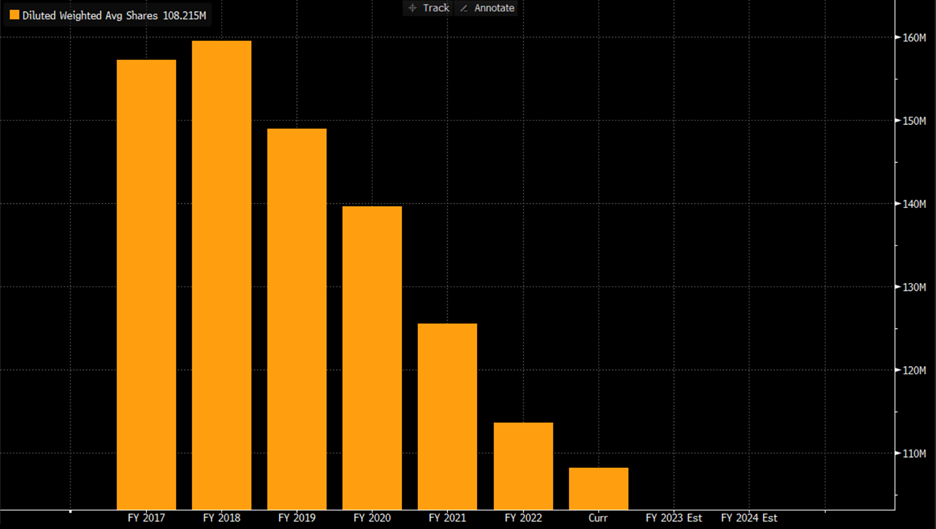
We are currently invested in UK pet health company, CVS Group. Founded in 1999, the company went public in October 2007.
Business overview
Headquartered in Norfolk, CVS is one of the leading veterinary services providers in the UK with about 10% market share. As of 2022, CVS has about 500 practices across its three markets, including eight specialist referral hospitals and 37 dedicated out-of-hours sites. The company also runs three laboratories, seven crematoria and an online retail business called Animed.
CVS recently entered the Australian market with a small number of acquisitions, bringing the total number of practices outside the UK to 35.
Target market
The total addressable market in the UK for veterinary products and services is over £2 billion. The market consists of six large chains and a number of independent/small chains representing 45% of the market.
On the other hand, according to IbisWorld, Australia has a $5.3 billion addressable market which is growing at 6% per annum. The level of consolidation in the Australian market is just 20% when compared to the UK, adding for future potential growth via M&A.
Competitive advantages
- Largest and most comprehensive provider of vet services in the UK, meeting all customer needs
- Scale – has developed shared facilities and opportunities to cross sell its products, like lab testing, generic medicines, loyalty schemes, specialist surgeries and pet cremation
Growth strategy
- Consolidate large-animal vet practices (delivering equine & livestock care), which is more fragmented
- Their laboratory diagnostic business could enter the farm animal diagnostics market
- International expansion continues like their latest entry in Australia
Where we’re looking next?
We have our eyes on a few interesting companies operating in the animal health space, ranging from pet insurance and fresh pet food to a diagnostics company. Our ability to be highly selective and nimble in our portfolio holdings leaves us well-positioned to add some exposure to the animal health industry at attractive valuations.
So just one question remains: How much are you spending on your pet?

The Godil family cat