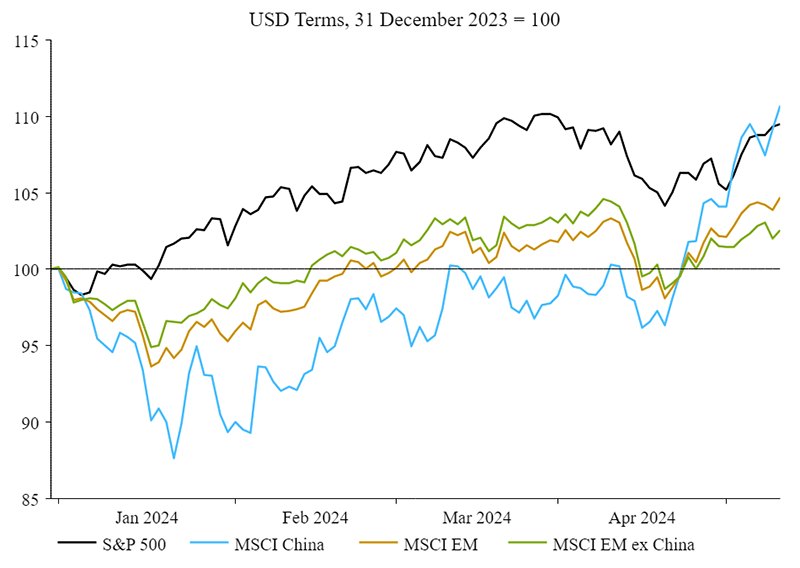
Chinese equities rallied 24% in USD terms through September, much of this in the final week of the month following the announcement of significant monetary and fiscal easing by the PBoC and Politburo respectively. Leading the move were the prime victims of China’s deflationary slump, including online securities broking company East Money (up 90%), property developer Vanke (82%), consumer laggards such as JD.com (57%) and Meituan (46%), along with names in banking, insurance and construction.
Our more cash generative and growing holdings surged, just not as much as the wider market. This included pan-Asian life insurer AIA Group (27%), energy drink beverage maker Eastroc (20%), Spring Airlines (24%), and tech giant Tencent (17%).
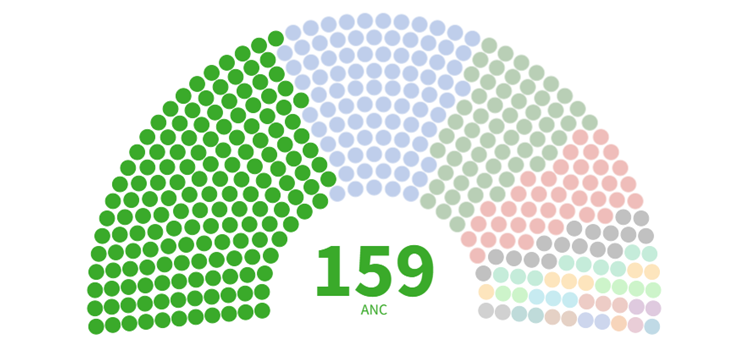
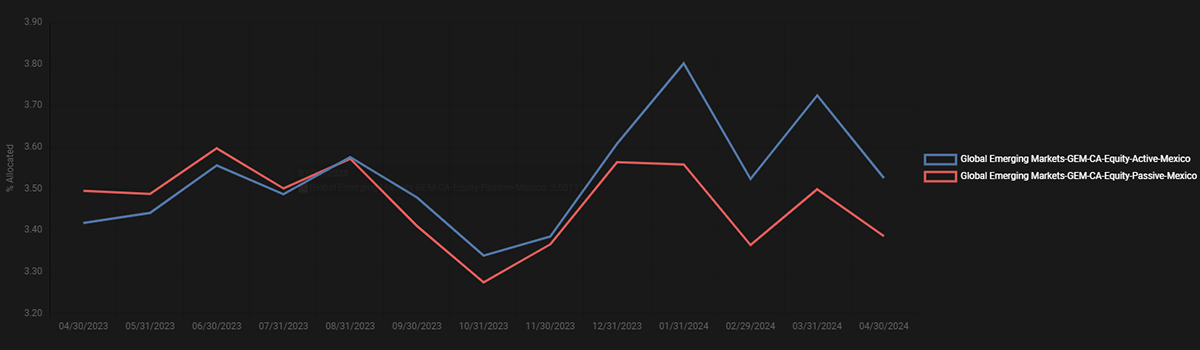
The majority of GEM investors, who have been significantly underweight Chinese equities for years, were caught out by the vertiginous rally fuelled by hopes the policy measures signalled a shift from the CCP towards domestic reflation.
GEM investors have maintained underweight positioning in China
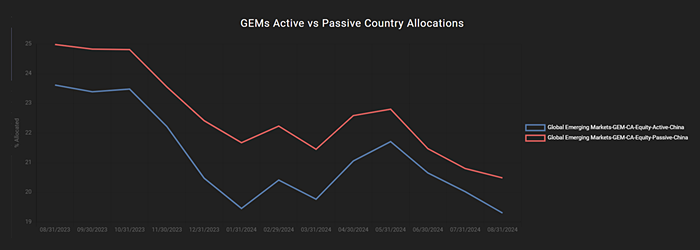
Source: EPFR October 2024
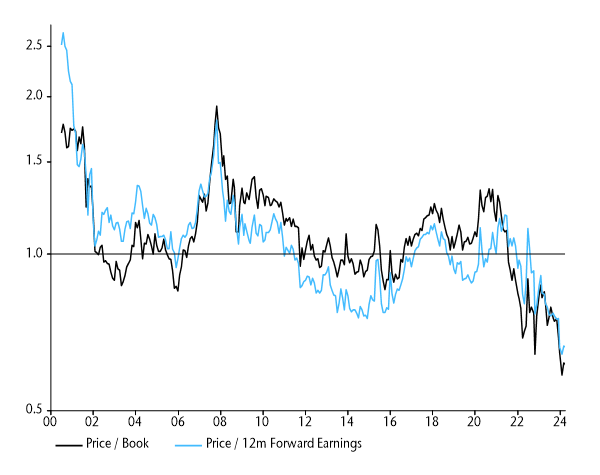
We flagged in our Q2 commentary that despite the risks of institutional quality deteriorating under Xi Jinping, the market was incredibly cheap and positive earnings revisions were beginning to come through:
Instead of allowing a market clearing to resolve supply and demand imbalances in Chinese property, Beijing is attempting a “managed” deleveraging. The issue is that a long and drawn out unwind threatens to entrench deflationary forces that undermine efforts to rebalance the financial system. Further complicating this is that efforts to prevent capital outflows through currency management limit Beijing’s monetary policy flexibility. We wrote in Q1 that a CAPE of 10x for Chinese equities likely signals the build-up of risks that prompts a shift in policy priorities to prevent a bust. While the shift to reflationary policy may indeed be a positive catalyst for unloved Chinese equities, the timing is uncertain.
Hence, we decided to stick with a defensive equal weight exposure in China, on a view that a policy pivot could come at any time and spark a sharp rally.
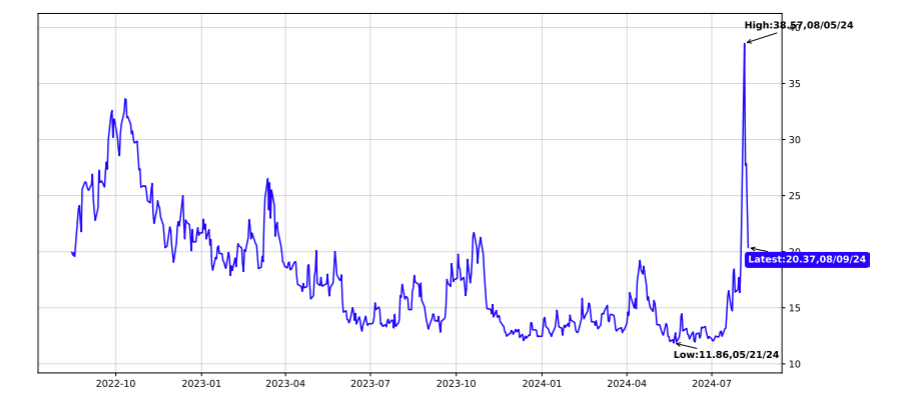
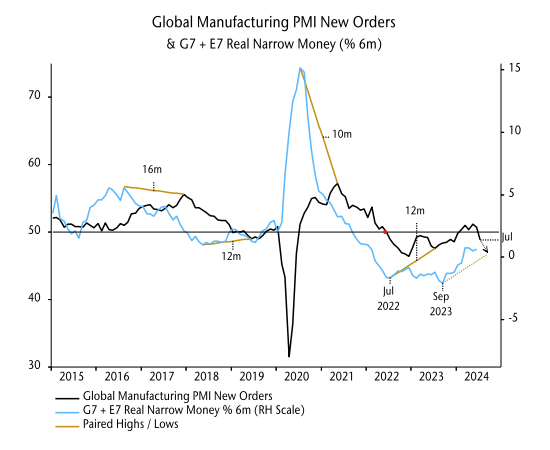
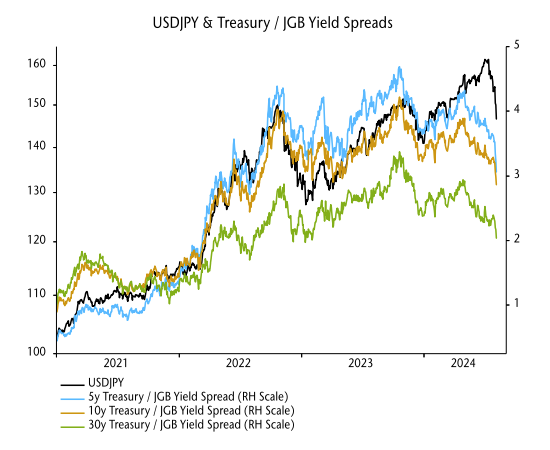
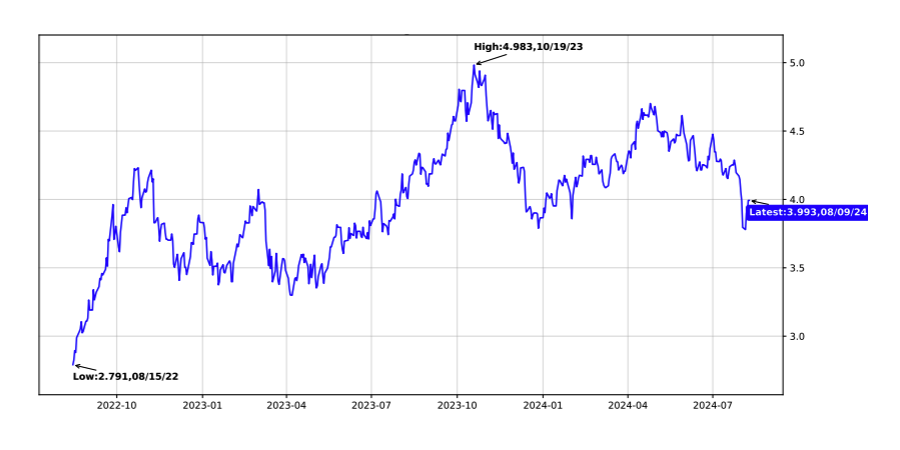
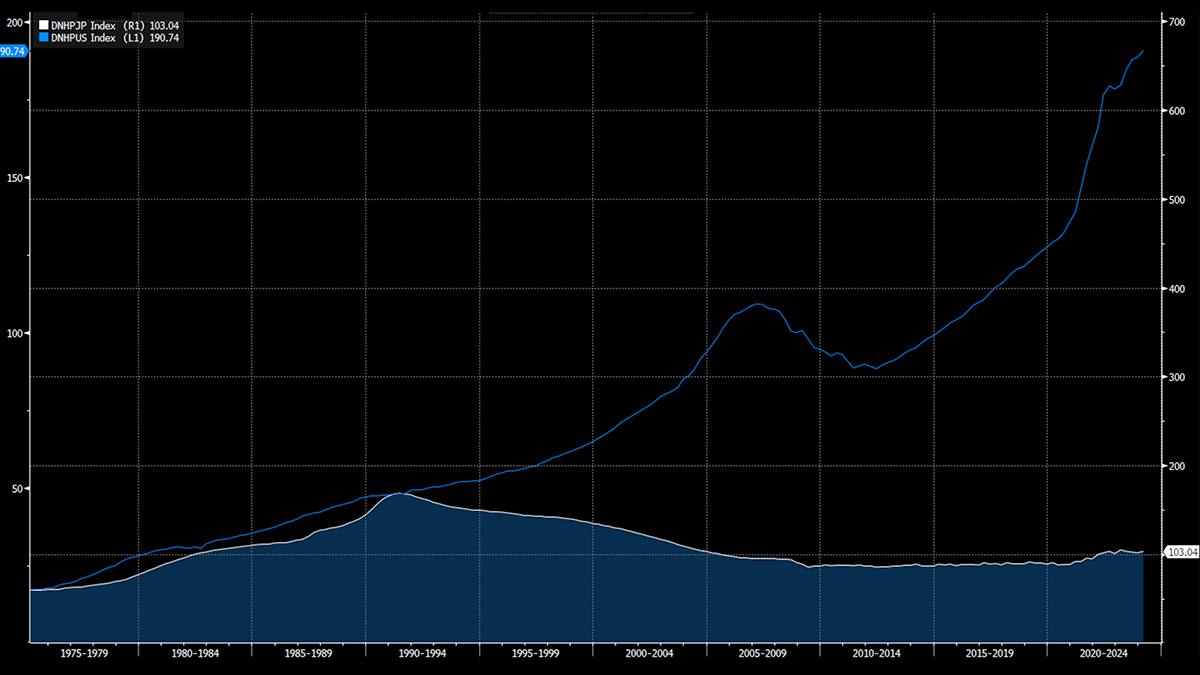
Our chief economist Simon Ward flagged in Money Moves Markets a few days before the rally that monetary growth was potentially bottoming, and that a falling USD/strengthening yen was opening up space for Chinese policymakers to act:
A key reason for expecting money / credit reacceleration is that the yen rally has relieved pressure on the RMB, easing monetary conditions directly and opening up space for further PBoC policy action. The balance of payments turnaround is confirmed by a swing in the banking system’s net f/x transactions, including forwards, from sales of $58 billion in July to purchases of $10 billion in August. This series captures covert intervention via state banks (h/t Brad Setser) and an August reversal had been suggested by a sharp narrowing of the forward discount on the offshore RMB, which has remained lower so far in September.
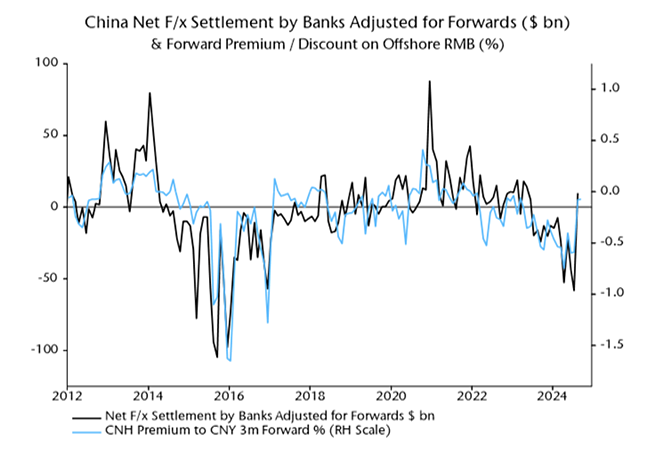
Source: LSEG Datastream
The stage was set for the largest rally in Chinese equities since 2008.
The rally reflects the significance of the monetary and fiscal policy announcements, which signal a shift in the way Xi Jinping views the state of China’s economy and the approach needed to break the malaise. How far is he willing to go?
Structural policy shift the fuel for a rally
Our view is that to break deflation, and for this rally to be anything more than just a liquidity driven trading opportunity, monetary and fiscal measures must be truly forceful. This would represent a structural shift in policy, and even the abandonment of a managed exchange rate in order to free up more room to stimulate. We aren’t so sure how likely this is. Although a falling USD and Fed rate cuts will certainly make a shift easier.
The signals from Beijing are certainly positive and indicate that a new approach is being embraced. Notably, the government is preparing to inject liquidity into the commercial banking system to expand balance sheets and boost money growth. In addition, the Politburo has pledged to deploy the fiscal bazooka to support local governments, small businesses, property and families (and not infrastructure).
Perhaps what is most significant is that Xi himself acknowledged the severity of China’s deflationary spiral and has taken up responsibility for fixing it. Will consumers and entrepreneurs respond, or will the stimulus be more pushing on a string? If the response is weak, Xi may feel compelled to do more lest he look incompetent.
Overall, the relative attraction for Chinese equities has increased. The rally has been short and currently looks overbought. We expect pullbacks to provide opportunities to add to China exposure and become less defensive, while favouring A-shares which should pick up some of the running from here.


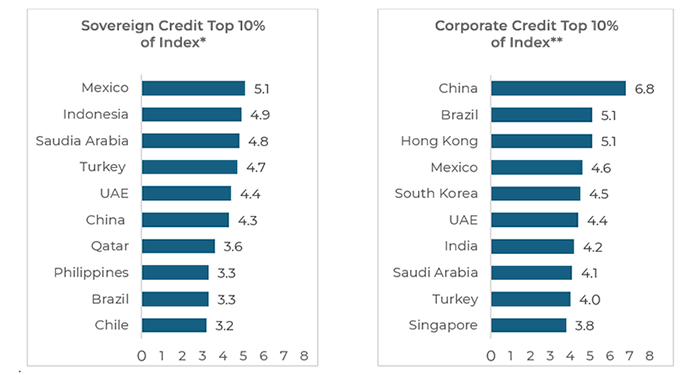
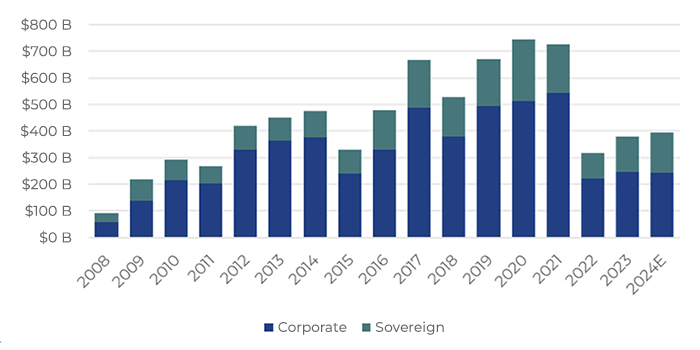 Source: JP Morgan & FortWood Capital
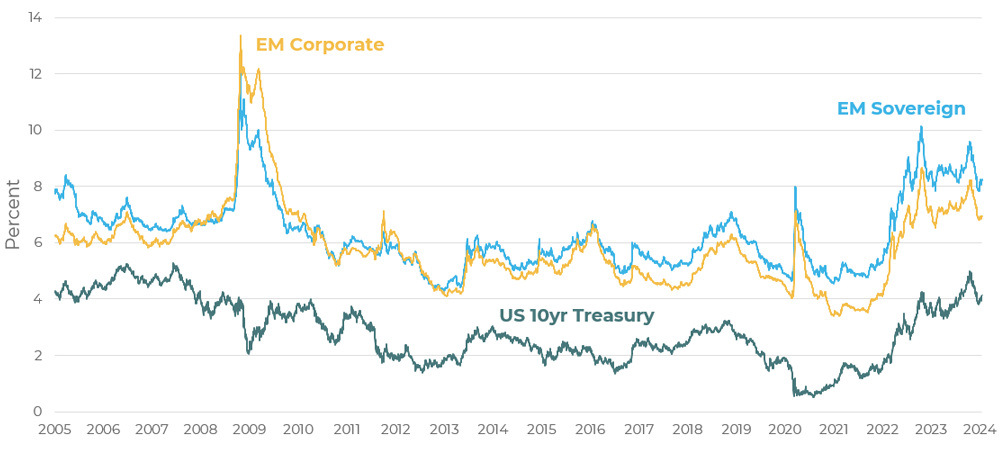 Note: EM Sovereign Index – EMBI Global Diversified, EM Corporate Index – CEMBI Broad Diversified
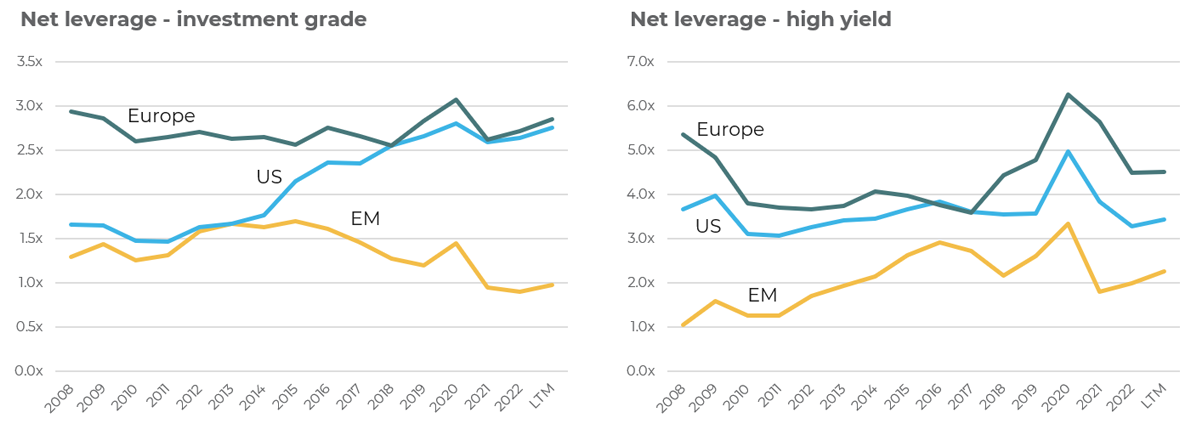 Source: JP Morgan (as of 2023) & FortWood Capital
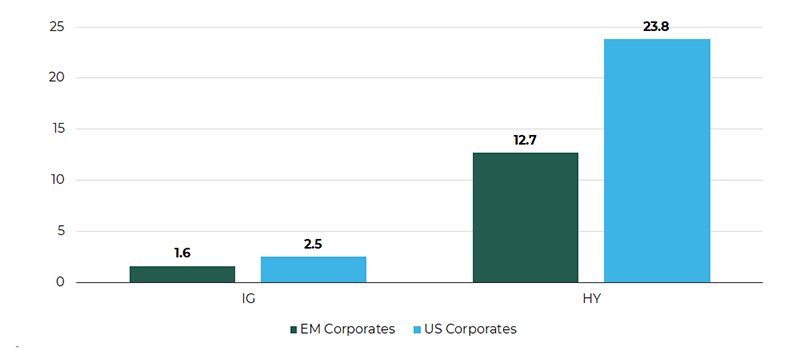 Source: S&P Global Ratings Research & FortWood Capital
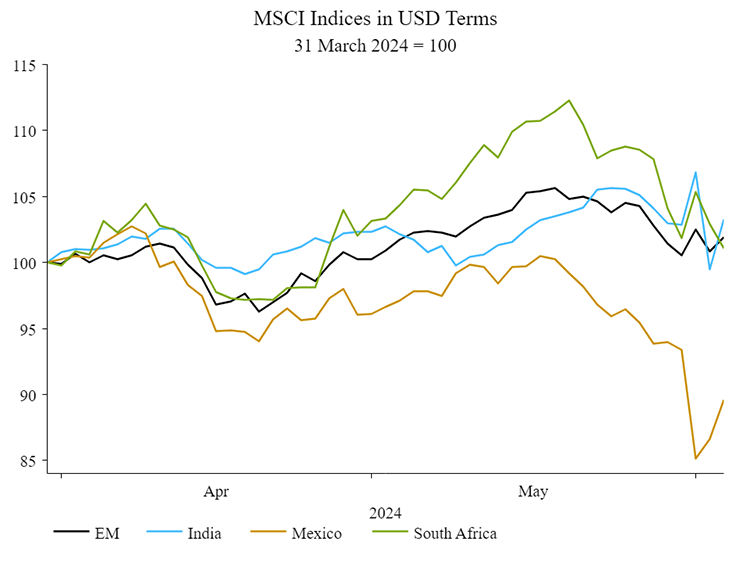
 Source: NS Partners & Bloomberg
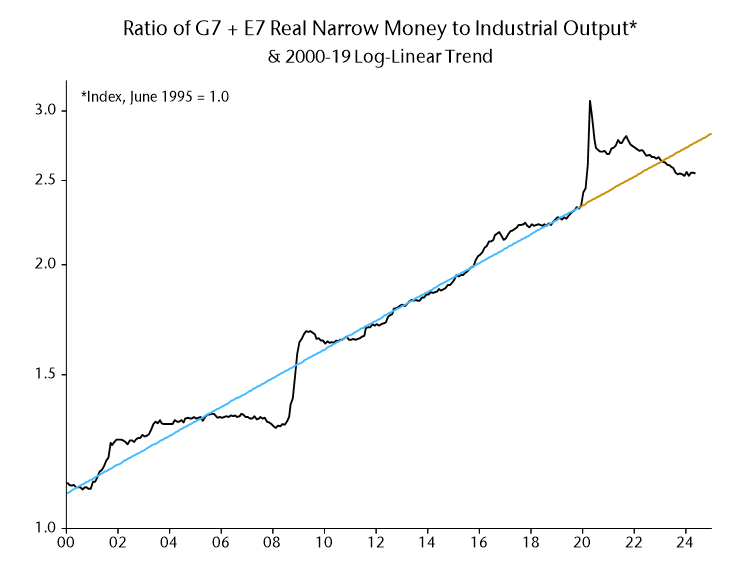
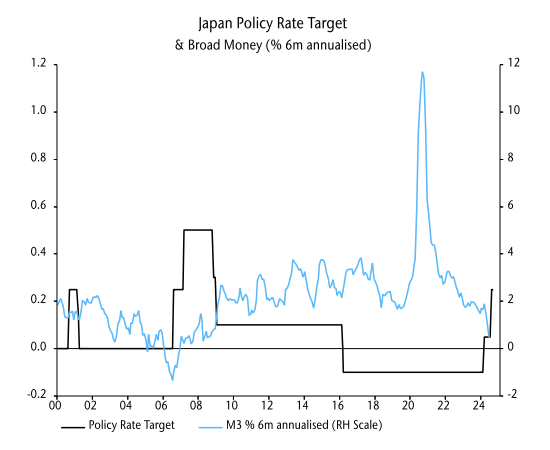


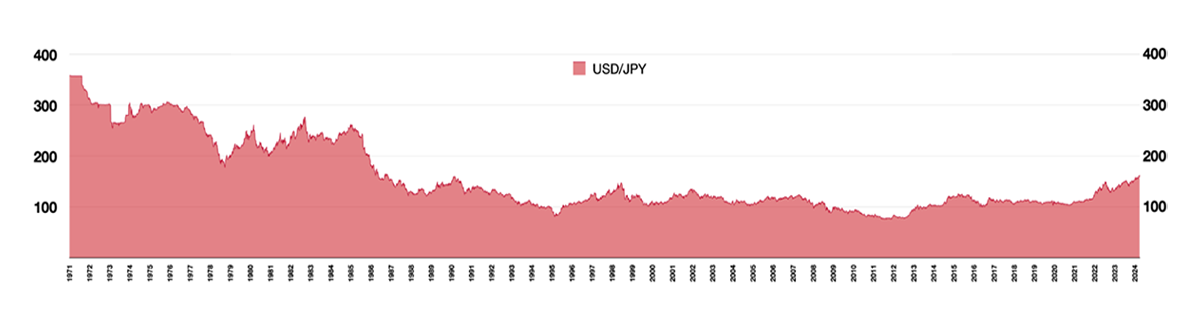 Source: Bank of Japan
 Source: public
 Source: public

 Source: NS Partners.
 Source: NS Partners.
 Source: NS Partners.
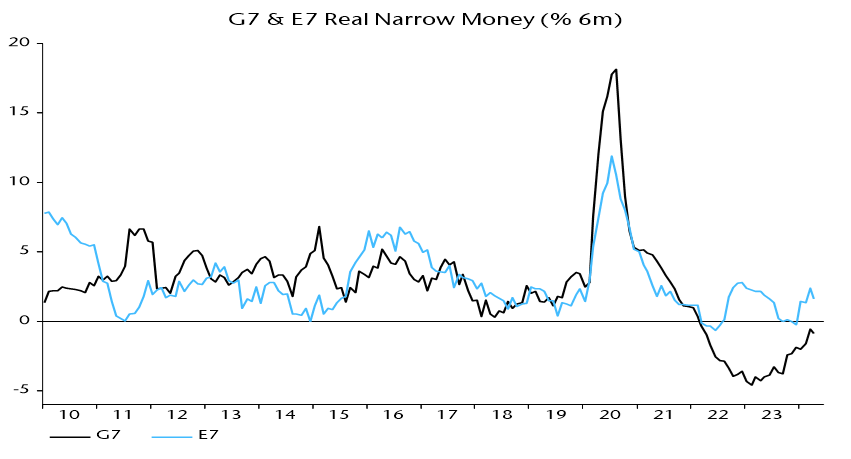 Source: NS Partners and LSEG Datastream.
 Source: NS Partners and LSEG Datastream.
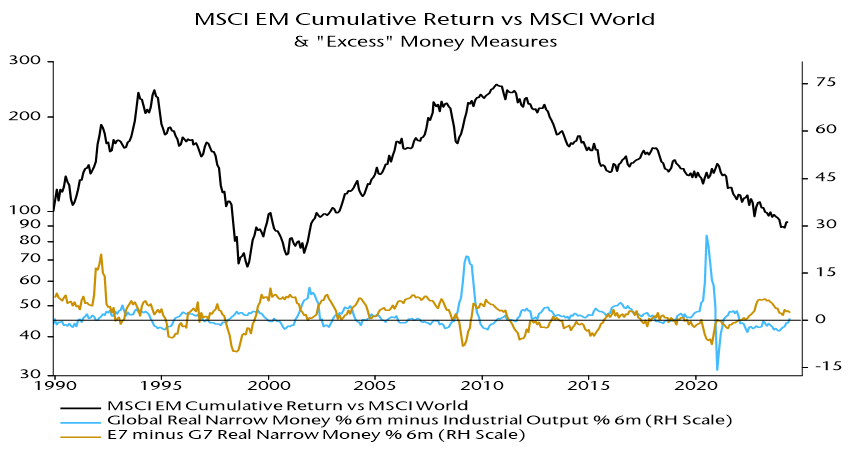 Source: NS Partners and LSEG Datastream.
 Source: NS Partners and LSEG Datastream.
 Source: NS Partners and LSEG Datastream.