
Strategy overview
The strategy invests in frontier and emerging market companies that we believe will benefit from demographic trends, changing consumer behaviour, policy and regulatory reform and technological advancement.
Egypt, Vietnam and Poland were the top three country contributors to strategy P&L in the quarter, whereas Indonesia, Lithuania and the Philippines were the worst three country contributors. On a sector basis, banks, non-bank financials and health care were the top three sector contributors to strategy P&L, whereas consumer staples, media and entertainment and consumer services were the worst three sector contributors. Below, we highlight the three best and worst stock performers during the quarter (by USD returns generated to the strategy) and share our latest observations on the portfolio and the broader investment environment.
Top Performers
Integrated Diagnostics Holdings PLC (IDHC LN)
IDHC is a leading laboratory and diagnostics provider in Egypt and Jordan with smaller operations in Nigeria and Saudi. IDHC shares returned 62.8% in during the quarter as investor sentiment turned more constructive toward Egypt and as the market responded positively to the resumption of dividends by the company that was announced with strong second quarter results. The resumption of dividends is a reflection of management’s more assured view on Egypt and signals confidence in the outlook for earnings going forward. We see further upside in the shares as we expect the company can generate nearly half of its market capitalisation in aggregate free cash in 2026 and 2027 and expect discount rates on Egyptian assets to decline as inflationary pressures subside. On the business model side, management continues to execute well by scaling the testing-at-home business (now approximately 20% of revenue), closing a ~$9 million transaction in a leading Cairo-based diagnostic imaging centre and expanding its capex-light lab roll-out via hospital and medical centre partnerships.
Kelington Group BHD (KGRB MK)
KGRB is a Malaysian engineer solutions provider with a core competency in Ultra-High Purity (UHP) gas and chemical delivery systems in the semiconductor, flat-panel display, solar and LED industries. KGRB shares returned 48.3% in the quarter as the market reacted positively to a string of contract awards announced in July and August. The most notable announcement by the company was the signing of a framework agreement with a multinational semiconductor company in Dresden, Germany with a minimum value of $35 million. KGRB is bidding on more than $1.3 billion worth of work, of which 44% is in Europe, so this contract win gives us more confidence in the company’s right-to-win in that market. KGRB’s market capitalisation crossed the $1billion mark in the quarter and its average daily value has quintupled to $5 million compared to its one-year average. While the shares have done very well year to date, the company would have only recently entered the radar screen of a large subset of emerging and global market investors who we believe will appreciate the positioning of the company in the semiconductor value chain. As a result, we see a nice combination of fundamental and technical catalysts for the shares going forward.
Ho Chi Minh City Development JS Commercial Bank (HDB VN)
HDB is a mid-sized private sector Vietnamese bank serving 23 million customers with a strong competitive advantage in the SME and consumer segments of the market. HDB shares returned 39.6% in the quarter as they benefitted from a sector-wide rally in Vietnamese bank stocks in the quarter on account of strong system lending growth, a pro-growth economic policy that appears to have been spurred on by tariff anxiety and a euphoric domestic retail investor base. We like HDB for its sector leading returns (ROE of ~27%) and proactive management which has allowed it to grow its loan book at twice the sector average. However, with the strong share price performance, we deemed the risk-reward setup no longer conducive for continued ownership and decided to exit the stock at the end of the quarter.
Worst performers
Sumber Alfaria Trijaya Tbk (AMRT IJ)
AMRT is the leading mini-market retailer in Indonesia with a network of over 20,000 stores. The company operates in an effective duopoly along with competitor Indomart, which operates around the same number of stores in Indonesia. AMRT shares lost 21.7% in the quarter as sentiment toward Indonesia soured on increased policy uncertainty and weak consumer confidence, culminating in a short period of violent protests in the last week of August. While we reduced the strategy’s exposure to Indonesia in the quarter (including in AMRT), we remain confident in the company’s ability to manage through this period of uncertainty aided by a net cash balance sheet and a defensive business model. We find the valuation appealing here at ~20x 2026 earnings and believe the business can underwrite mid-teens local currency bottom line and free cash flow CAGR for the next three years.
Hikma Pharmaceuticals PLC (HIK LN)
HIK is a Jordan-headquartered, global generic pharmaceutical company listed on the London Stock Exchange. HIK shares lost 19.4% in the quarter as policy uncertainty in the US market (~50% of group sales) and unfavourable currency movements weighed on the stock, despite the company affirming guidance in their latest results. While we see a lot of value in the shares at less than 10x 2026 earnings and think the group’s diverse revenue mix and manufacturing presence in the United States are appealing attributes, we decided to exit the shares for the time being as policy risk continues to supress the multiple and can present a risk to earnings.
Baltic Classifieds Group PLC (BCG LN)
BCG is the dominant online classifieds platform in the Baltic region operating across Lithuania, Latvia and Estonia. BCG shares lost 21.1% in the quarter following a revenue and profit downgrade issued by the company (by only 3–4%) which management attributed entirely to the new vehicle transaction and ownership tax in Estonia. Uncertainty on whether this tax will stay or go is impacting transaction activity on the company’s Auto 24 platform. Estonia has one of the highest motorisation rates in Europe and the Baltics and we believe the profit hit resulting from the tax uncertainty will likely be transitory in nature. We continue to like the pricing power of BCG across several verticals in the three countries it operates, and we see continued support for the share price from the company’s buyback program.
Outlook
Amidst volatile geopolitics and frothy asset markets, we continue to find attractive opportunities to deploy capital in our core markets. While some risks have emerged in the ASEAN region (namely in Indonesia, Philippines and Thailand) from messy politics, we find that valuations of our portfolio companies in those three countries have largely absorbed those risks. In other regions, we believe the Middle East offers good opportunities post the recent correction in Saudi and UAE equities. In Africa, we see green shoots emerge from subsiding inflationary pressure in Egypt, while Morocco’s “Gen-Z” protests offered an opportunity for us to reshuffle and add to favoured stocks on weakness. In Central Eastern Europe, we continue to see a rich opportunity set with our portfolio indexing to small and midcap high growth companies.
Broadly, the portfolio is appropriately diverse from a regional and sectoral perspective with 20 countries across 16 GICS industry groups. Within those areas, the portfolio owns a unique combination of companies that exhibit growth, re-rating potential and idiosyncratic catalysts.
We look forward to updating you on the strategy in the next quarter.


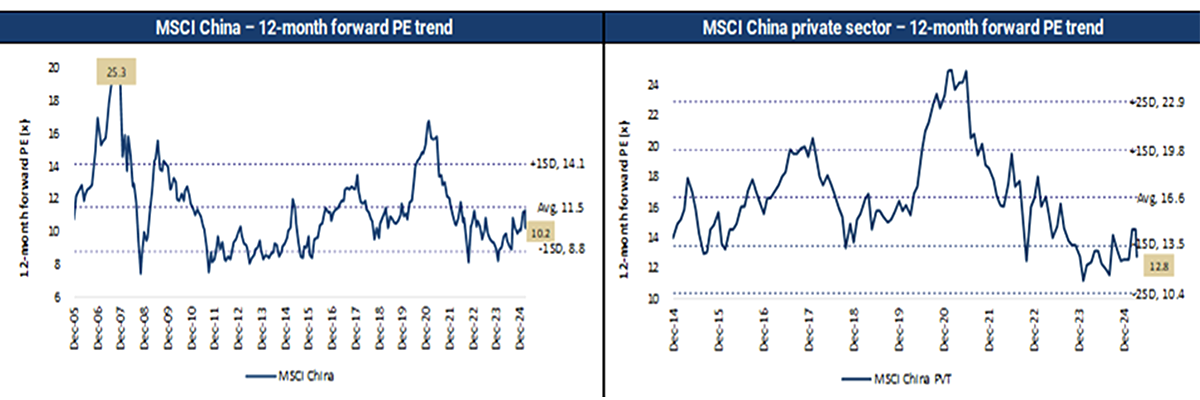


 Source: NS Partners and LSEG (May 2025)
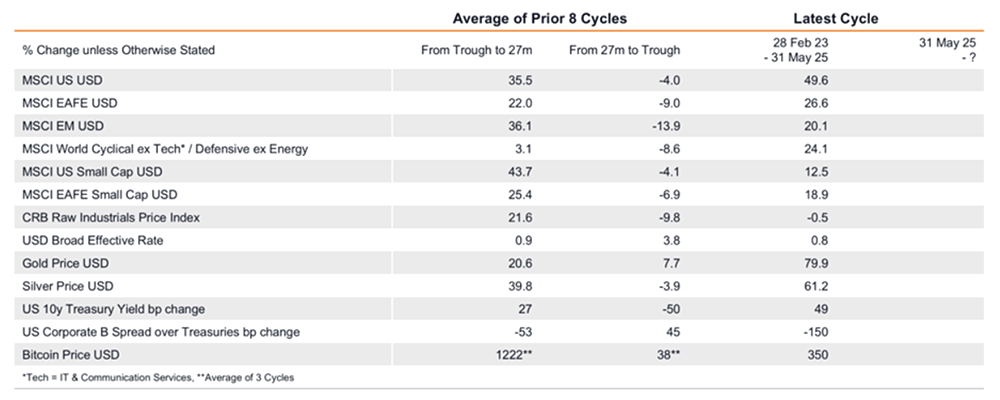
 Source: LSEG Datastream
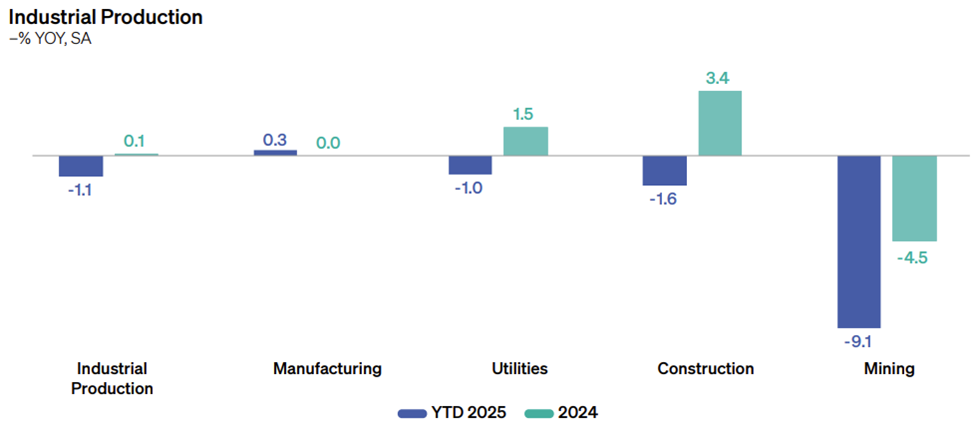
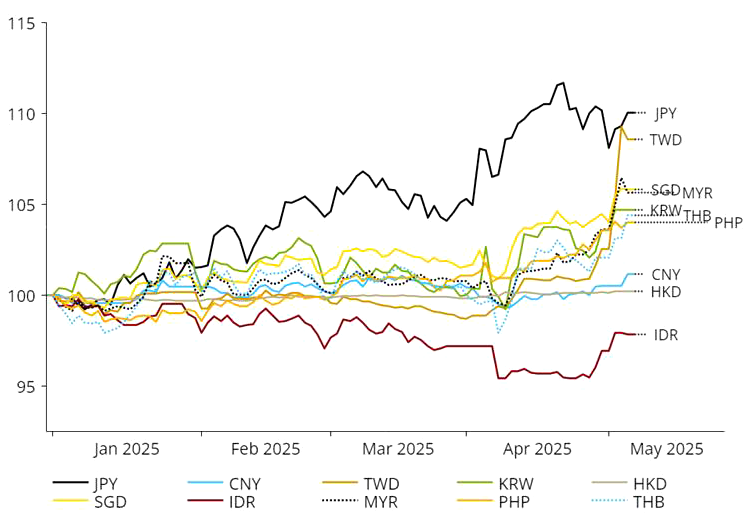