As we write this commentary, stock markets around the world have been staging a spectacular rebound over the last few weeks. Many are now in a bull market, meaning they are up more than 20% since the last bottom.
How to explain such optimism when inflation remains stubbornly high, central bank rates are still rising, the war in Ukraine rages on, and China is still committed to a COVID-zero policy?
In the last few weeks, we attended numerous small cap conferences in the U.S., Japan, the UK, Norway, France, Taiwan and Vietnam to further research that optimism. In all, we met over 100 companies and attended various industry and thematic panels.
There were a lot of takeaways from these meetings, and in this week’s commentary we will focus on the U.S.
A majority of companies indicated they will continue to raise prices in 2023 to offset continued inflationary pressures. For example, cement companies expect cement prices to go up 12% in 2023. Residential housing may be down, but infrastructure spending – turbocharged by the Inflation Reduction Act – will more than offset this decline. John Deere just announced equipment prices will go up 11% in 2023. Meanwhile, agricultural prices remain high and farm income is near a record, boosting demand. New car prices will go up double digits.
Companies expect to increase salaries in 2023 by more than they did in 2022, with the general expectation that wage inflation will be between 5-10%. As a possible indication of things to come, four freight rail unions – with a combined membership of close to 60,000 rail workers – recently voted down the five-year contract agreement brokered by the Biden administration back in September. The rejected deal would have given workers a 24% raise over five years and an average immediate payout of $16,000 in back raises and bonuses. As we write this comment, Amazon workers in more than 40 countries are staging walk-off protests with the slogan “Make Amazon Pay.”
Demand remains strong. Although some weakening has been felt since the latter part of November, the latest economic indicators seem to reflect a resilient economy that is still growing. For example, the Empire Manufacturing Survey came in at 4.5 compared to expectations of -5.0, indicating positive expansion. This follows -9.1 in October. Durable goods orders were very strong. Of note, retail sales were solidly positive – accelerating from the prior month – and new home sales were stronger than expected. As well, jobless claims remain below the pre-pandemic levels. In the hotel sector alone, more than 200,000 positions remain vacant.
Does the stock market believe in a soft-landing scenario? Maybe. But it is now convinced that the Fed will pause its interest rate hiking cycle and may even lower rates in 2023! The consensus right now is that inflation will continue to go down and should end next year at around 3.5%. Interest rates will continue going up but should peak around 4.5 to 5% by mid-2023, and may start coming down by the end of 2023.
Our scenario is very different.
We believe inflation at the end of 2023 will still be at 5% or above. Why?
As indicated above, wages will rise more than 5% and rent increases will continue to exceed 5%. Meanwhile, commodities – after relatively easy year-over-year comparisons in the early part of 2023 – will start going up again towards mid-2023. Metal prices are already going up, as are natural gas prices. Food prices will continue going up, and insurance prices are poised to explode in 2023.
Facing such inflation, and at the risk of losing its already low credibility, the Fed will continue raising rates. How high? We believe the only way to break the inflation expectation, which is what the Fed is focused on, is to see slack in the labour market. That probably means an unemployment rate above 6%. We are far from that level.
The Fed also needs to see home prices decline 20% or more. Yet despite price declines in the last few months, home prices were still up year over year at the end of October.
In other words, the market is too optimistic.
The rally is also explained by seasonal effect and oversold conditions. This rally, however, has been of poor quality, similar to what we saw in the summer of 2020. Unprofitable companies with weak balance sheets have been the best performers.
We knew that we might trail the market performance this fall and maybe even into early 2023. However, our portfolio is well-positioned for a more difficult environment in 2023, in which we will see much lower economic activity and possibly even a recession combined with higher interest rates.
Towards the end of the first quarter of 2023, we expect to see a rotation to higher-quality companies with little to no debt and the ability to gain market share.
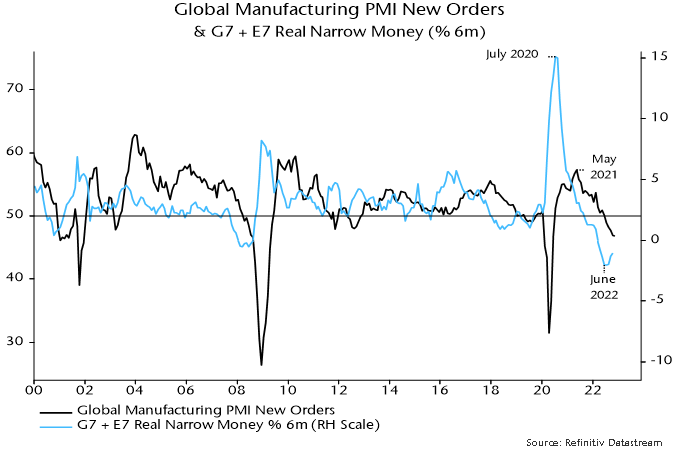
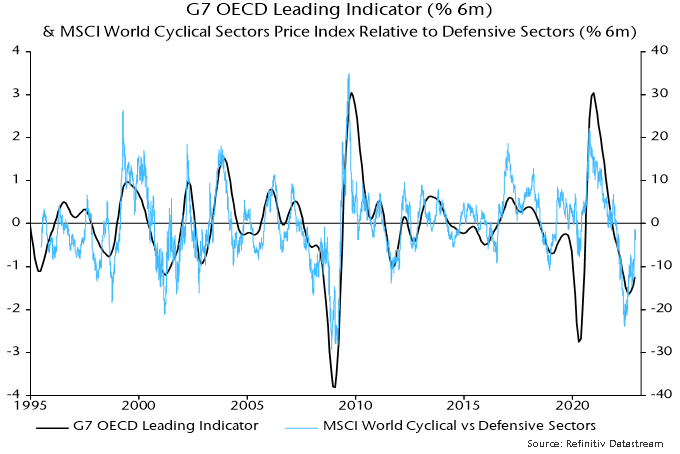
The global manufacturing PMI new orders index was little changed in November, the six-month rate of change of the OECD’s G7 leading indicator has hooked up and cyclical sectors have been outperforming defensive sectors in the recent equity market rally. Do these developments signal a bottoming of global economic momentum and a prospective H1 2023 recovery?
Monetary trends argue not. Global (i.e. G7 plus E7) six-month narrow money momentum rose slightly for a fourth month in October but remains in negative (i.e. recessionary) territory. All previous recoveries through the 50 level in global manufacturing PMI new orders were preceded by real money momentum rising above 2% – see chart 1.
Chart 1
The June low in real narrow money momentum will probably hold but a corresponding PMI new orders low is unlikely before Q1 2023. There was a 10-month lag between the most recent real money growth peak (July 2020) and the matching PMI top (May 2021).
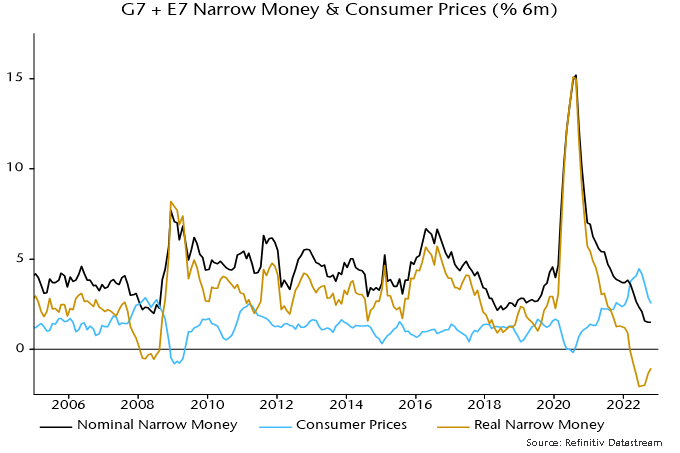
There are additional negative considerations. The rise in real money momentum since June has been due to an inflation slowdown, with nominal money growth weakening further – chart 2. Previous PMI recoveries were preceded by nominal as well as real money accelerations.
Chart 2
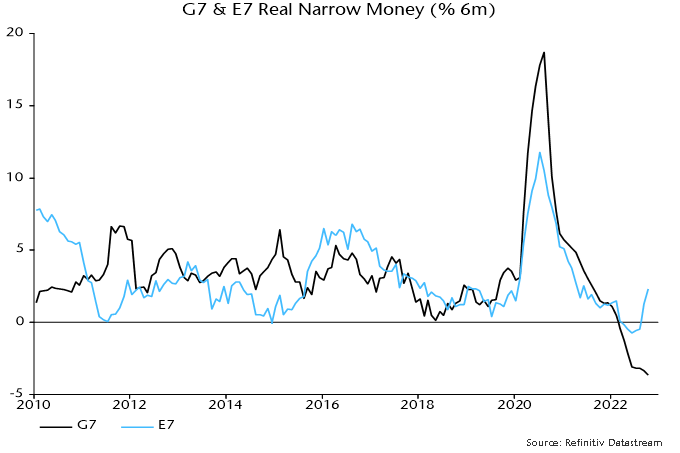
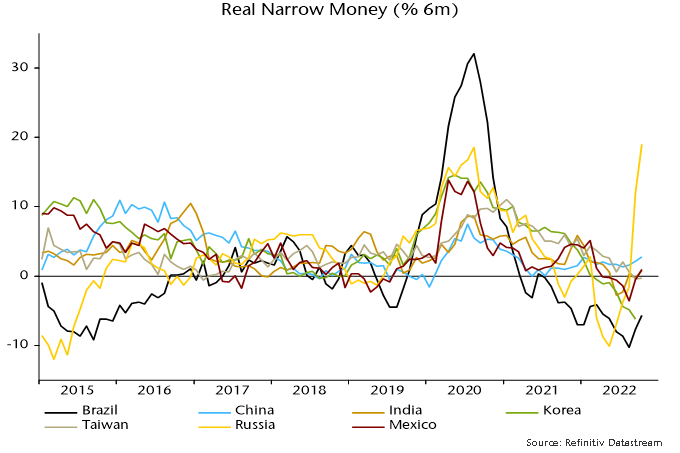
The rise in global real money momentum reflects the E7 component, with G7 momentum still weakening – chart 3. China, India, Mexico and Brazil have contributed to the E7 recovery but the increase has been exaggerated by a nominal money surge and inflation drop in Russia – chart 4. The latter may be of limited global relevance given Russia’s partial economic isolation.
Chart 3
Chart 4
The six-month rate of change of the OECD’s G7 leading indicator rose slightly for a third month in November, according to calculations here. This appears to be a hopeful signal – bottomings historically have usually been followed by sustained recoveries, as chart 5 shows. The uptick is also consistent with recent better relative performance of cyclical equity market sectors.
Chart 5
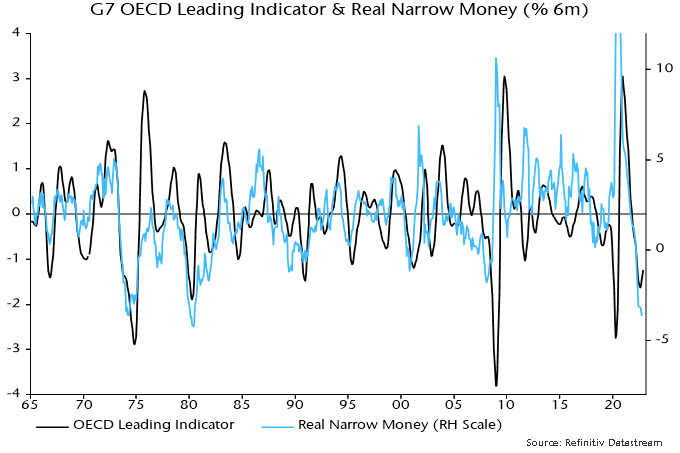
Initial indicator readings, however, are often revised significantly and previous sustained recoveries in the six-month rate of change from negative territory were accompanied or more usually preceded by a revival in G7 real narrow money momentum – chart 6. With the latter yet to bottom, the uptick in indicator momentum may be either revised away or reversed.
Chart 6
With recession risk concerning many developed countries, it seems there is nowhere to hide. But actually, there is. Japan’s GDP is expected to grow 1.6% this year and 1.8% next year, according to the latest forecast of the Organization for Economic Co-operation and Development (OECD). In contrast, 2023 GDP growth in both the U.S. and the eurozone is expected to be only 0.5%.
We think the following reasons could explain such differences.
Extremely loose monetary policy.The Bank of Japan maintained its key short-term interest rate at 0.1% and the 10-year bond yield around 0%.
Supportive fiscal policy. An extra economic package of ¥29 trillion (US$208 billion) was recently announced, worth around 5% of GDP. The package aims to bring down inflation by 1.2% between January and September next year.
Low inflation. Although Japan’s core CPI hit a 40-year high of 3.6% year over year in October, the pace of change was far slower than in the U.S. or Europe. Wage increases in September 2022 were up by only 2.1% on a year-over-year basis, contributing to Japan’s comparatively low rate of inflation.
Reopening catch-up. Japan has lagged the U.S. and Europe in easing COVID policies. Face-to-face services resumed in March 2022, accelerating private consumption. Another boost for consumption came on October 11, 2022, when Japan lifted its border restrictions. In 2019, about 32 million foreign tourists visited Japan and spent a record high of ¥4.81 trillion. Pent-up demand should carry over into 2023.
Automotive industry recovery. The manufacturing sector accounts for 20% of Japan’s total GDP, and automotive and ancillary manufacturing remain a substantial segment of that overall sector. As supply chain disruptions subside, automakers are expected to enhance production to fulfill record backlogs.
Weak yen. The yen (JPY) has declined this year by more than 20% against the U.S. dollar, to a 32-year-low. In October, Japan’s exports were up 25.3% year over year, led by shipments of chips, electronic parts, and cars. For foreigners, a weak yen and low inflation mean that Japan is a relatively cheap shopping destination.
The Nikkei 225 Index has been whipsawed so far in 2022 and is currently -3% compared to January 1, 2022. Yet there are many positive stories to be found when you dig a little further into the numbers. Based on the September quarterly results of over 1,800 companies on the Tokyo Stock Exchange Prime Market, sales on aggregate are up by 21.9% year over year, operating profits are up by 9.2%, and net profit by 31.6%. Likewise, 64% of companies have reported sales higher than consensus estimates, according to Mizuho Securities.
We invest in a total of 20 Japanese companies in Global and EAFE Small Cap strategies. Below are some common themes from the management of these firms.
All companies have benefited from the weak yen and/or reopening of the economy. Sales have been notably robust.
Six of our holdings reported very strong results and raised their full-year sales guidance. These are:
ASICS (7936.JP): a global sports goods maker best known for its performance running shoes.
HORIBA (6856.JP): a global measurement equipment maker specializing in the analysis of small particles in the fields of semiconductors, environment, health and safety.
Iwatani (8088.JP): a leading distributor of industrial and household gases in Japan.
DMG MORI (6141.JP): the largest machine tool maker in the world.
Seiren (3569.JP): a global leader in car seat materials.
Kurita (6370.JP): the largest industrial water treatment company in Japan.
Margin pressure remains a challenge: cost pass-on might be easier with time, but investment and spending are also rising.
Supply chain issues are improving. Compared with western peers, our Japanese holdings have been more conservative in inventory management. They have kept a high raw material inventory to ease supply chain disruption. Long-term relationships with diversified suppliers also contribute to these supply chain improvements.
Product prices continue to increase, though domestic increases are more difficult to impose than in overseas market.
To our surprise, leaders of our Japanese holdings do not see pressure on wage increases from employees or the Japanese government. Nor are they experiencing a labour shortage issue.
Reshoring is on the rise. Back in April 2020, Japan set aside a ¥243.5 billion fund to help manufacturers shift production out of China to avoid supply chain disruption. Recent U.S. restrictions on China to cripple its semiconductor industry should also help Japan attract more investment.
The MSCI Japan Small Cap Index is currently trading at a very attractive level, at 13x P/E. It is not only its lowest level in the past decade, but also lower than U.S. peers at 23x and European peers at 16x. We believe the fundamentals of the Japanese economy are still solid, with low inflation risk.
Le conflit en cours en Ukraine a forcé plus de 12 millions d’Ukrainiens à se déplacer, dont bon nombre cherchent refuge dans les pays voisins et ailleurs. La Fondation CC&L est intervenue pour fournir une aide humanitaire essentielle. Dans le cadre de deux campagnes de financement fructueuses, la Fondation a recueilli 409 000 $ pour soutenir 11 organismes comme Help Us Help et la Fondation Canada-Ukraine.
Ces campagnes ont eu un effet considérable, notamment :
La livraison de boîtes alimentaires à près d’un million de personnes dans 21 oblasts
La fourniture de gilets pare-balles, de nourriture, d’un abri et d’une aide pour le déménagement des familles
Le lancement d’un programme de traitement des traumatismes de guerre pour 9 900 enfants
L’achat de 1 000 nouvelles trousses personnelles d’outils de lutte contre les incendies
Le relancement du Canada-Ukraine Surgical Aid Program
La livraison de fournitures et de médicaments à 78 hôpitaux en Ukraine
La livraison de 140 tonnes métriques de graines de sarrasin en vue de la récolte en octobre, procurant une sécurité alimentaire très attendue
La Fondation a aussi déployé des efforts auprès de la communauté ukrainienne du Canada, la mesure Displaced Ukrainians Appeal ayant fourni du financement afin de permettre à plus de 1 000 enfants déplacés de participer à des camps d’été au Canada.
Grâce à ses diverses initiatives caritatives et au dévouement de ses bénévoles, la Fondation CC&L continue d’avoir un effet positif sur la vie des Ukrainiens touchés par le conflit, en leur fournissant l’aide et l’espoir dont ils ont besoin pour un avenir meilleur.
UK money trends remain consistent with inflation normalisation, implying that further MPC tightening will unnecessarily prolong and deepen the recession.
The artificial boost to headline money numbers from cash-raising by LDI funds partially unwound in October – the Bank of England’s M4ex measure fell by 0.6% on the month after a 2.6% September jump.
As usual, the focus here is on non-financial money measures, i.e. excluding volatile and uninformative financial sector holdings. The September surge in financial money was certainly no signal of future economic or inflation strength.
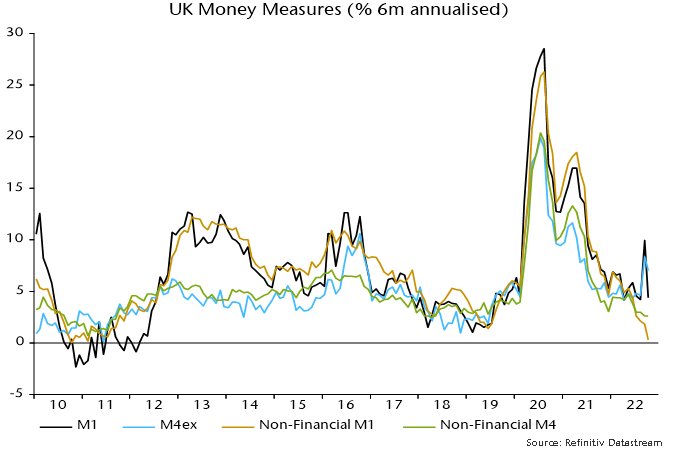
Annual growth of non-financial M4 was little changed at 3.4% in October, with the six-month annualised pace of increase lower at 2.7%. Annual non-financial M1 growth dropped to 2.6%, with the aggregate little changed in the latest six months – see chart 1.
Chart 1
The latter weakness reflects households and non-financial firms switching out of sight into time deposits in response to higher term interest rates. The decision to lock away money is a negative economic signal, indicating weak near-term spending intentions.
Broad money growth of 3-3.5% is unlikely to be sufficient to prevent inflation from falling below 2% over the medium term, unless potential economic expansion is even weaker than the generally assumed 1-1.5% pa. (This assumes no rise in velocity, which has exhibited a long-term downward trend, including during the 2010s.)
Non-financial M4 is growing more slowly than the comparable Eurozone aggregate, non-financial M3, which rose by 4.8% in the year to October.
The argument continues to be made that spending will be supported by the deployment of “excess” savings built up in 2020-21. The assessment of “excess” need to take into account inflation – fast price rises require more saving to maintain the real value of existing wealth.
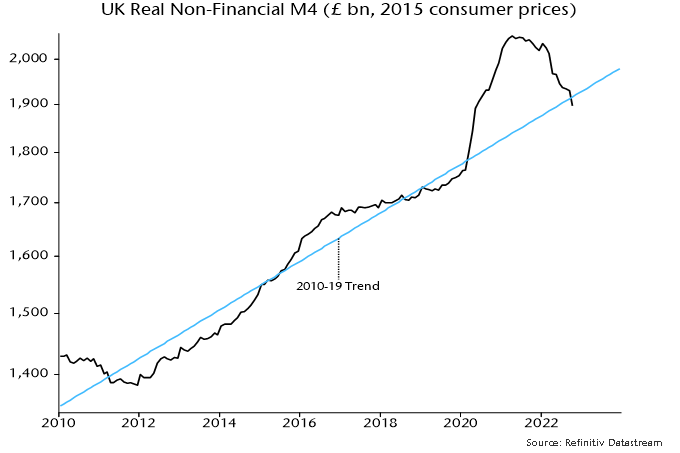
Real non-financial M4 has now crossed beneath its 2010-19 trend – chart 2. The suggestion is that money holdings are broadly in line with requirements given recent high inflation – there is no longer any buffer to cushion spending against an ongoing real money squeeze.
Chart 2
A post last month argued that a pick-in Eurozone broad money M3 growth into September reflected temporary factors that would reverse. October numbers delivered the expected turnaround, with M3 falling by 0.4% on the month. Narrow money measures, meanwhile, lost further momentum, with Italian data particularly weak.
The summer pick-up in M3 growth had been discounted here for two reasons: the numbers had been boosted by rapid and probably unsustainable expansion of financial sector deposits; and the pick-up was inconsistent with the behaviour of the credit counterparts (bank lending to government and the private sector, net external lending etc), instead reflecting a statistical “residual”.
October numbers showed a large drop in financial M3 holdings, correcting earlier strength, while the credit counterparts residual turned negative.
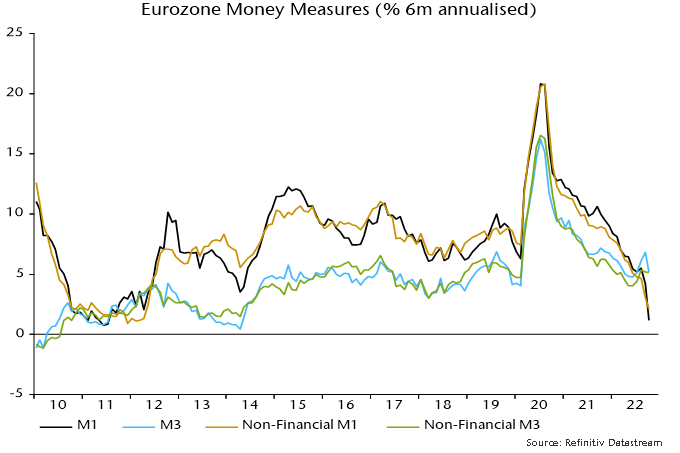
The preferred money measures here exclude financial sector holdings, which correlate poorly with near-term economic performance. Six-month growth of non-financial M3 was stable in October at 5.2% annualised; growth of non-financial M1 slumped further to 2.1% annualised, the weakest since the 2011-12 Eurozone crisis / recession – see chart 1.
Chart 1
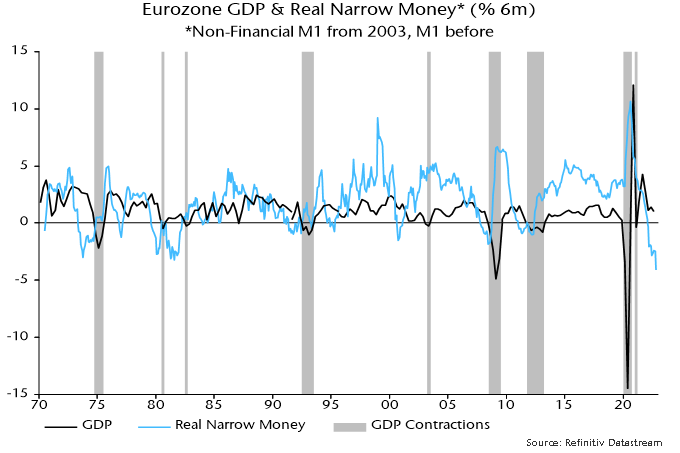
Real narrow money is contracting much faster than during that crisis: the six-month rate of decline reached a new record in data extending back to 1970 – chart 2.
Chart 2
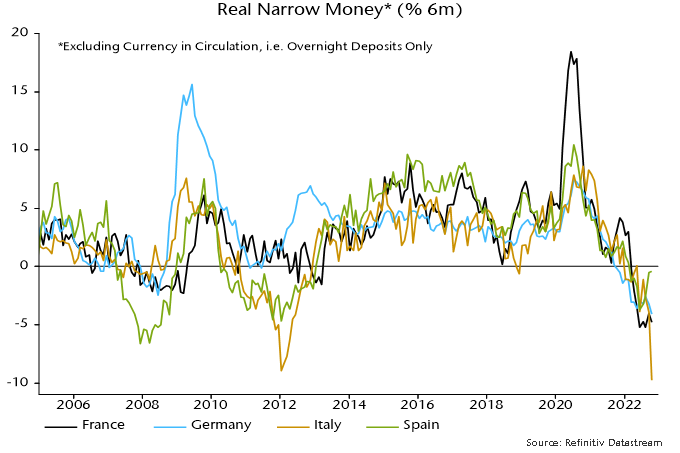
Country data on real overnight deposits (including financial sector holdings) show particular weakness in Italy, reflecting both nominal contraction and a larger recent inflation spike than elsewhere – chart 3.
Chart 3
The previous post suggested that a lending slowdown would act as a drag on broad money growth. Bank loans to the private sector were unchanged on the month in October.
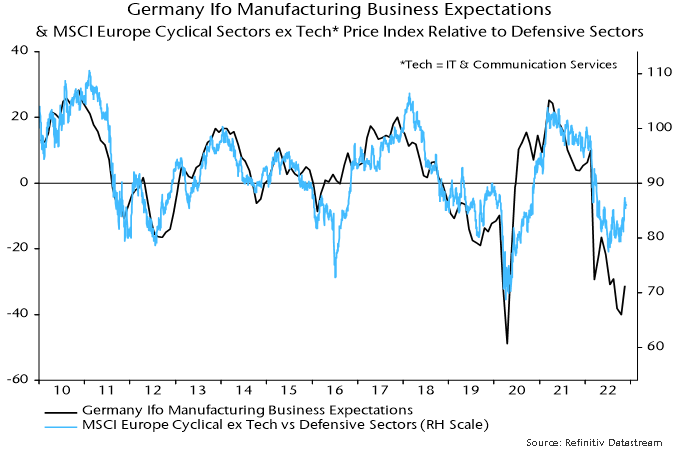
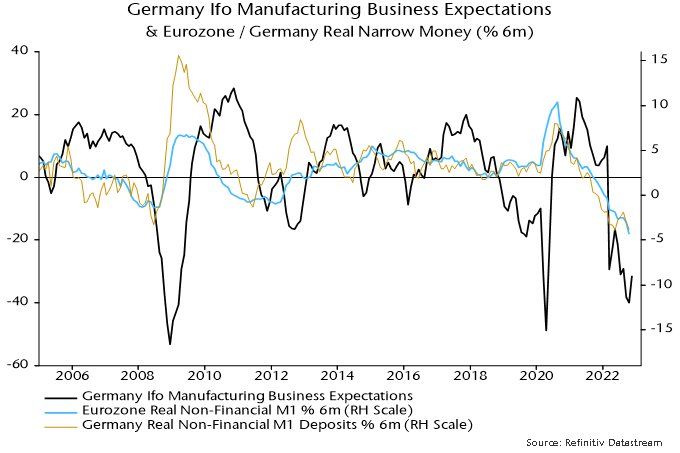
Cyclical sectors of European equity markets have recovered some relative performance recently, possibly reflecting a belief that a grim economic outlook was becoming less dire at the margin. A minor recovery in the expectations component of the German Ifo business survey might be viewed as supporting reduced pessimism – chart 4.
Chart 4
The level of Ifo expectations, however, remains historically weak and a further fall in Eurozone / German six-month real narrow momentum argues that economic stabilisation, let alone a recovery, remains distant – chart 5.
Chart 5
Nominal money trends and prospects suggest that monetary conditions are already restrictive, contrary to the ECB’s assessment*. Likely policy overtightening is another reason for fading the cyclical rally.
*See speech by Executive Board member Isobel Schnabel.
The major fiscal tightening announced by Chancellor Hunt in the Autumn Statement was motivated by a markedly more pessimistic OBR assessment of medium-term prospects for the economy and public finances. Even if its latest forecasts prove “correct”, revisions on this scale between six-monthly forecasting rounds are questionable and result in undesirable volatility in policy-making.
The economic outlook has deteriorated since the March Budget but the OBR’s fiscal assessment is based on the projected level of potential output four to five years ahead. This relies on assumptions about trends in productivity and labour supply and should be little affected by the prospect of a near-term recession.
The OBR has revised down its projection for potential output growth over the forecast horizon by a whopping 1.7 pp since March, mainly reflecting an assumed hit to productivity from energy prices staying high over the medium term. An associated loss of receipts accounts for almost a third of the £75 billion upward revision to borrowing in 2026-27 based on unchanged policies.
The OBR ignored the productivity implications of high energy prices in March on the grounds that it was unclear whether they would persist. The outlook is no less uncertain now yet the OBR has chosen to incorporate the full hit. A better approach would be to phase in adjustments over several forecasting rounds, varying the pace depending on energy price developments between rounds.
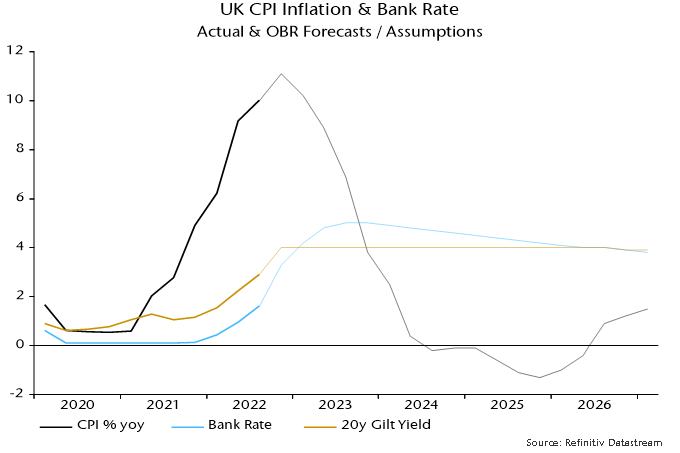
The most significant forecasting change since March was a substantial upward revision to the path of interest rates, with Bank rate and long-term (i.e. 20-year) gilt yields now averaging 4.4% and 4.0% respectively between 2023-24 and 2026-27, versus 1.5% for both previously. An increased debt interest bill accounts for £47 billion of the £75 billion boost to 2026-27 borrowing.
The interest rate assumptions are derived from market rates but they are clearly inconsistent with the OBR’s economic forecasts – particularly its projection that the annual change in consumer prices will turn negative in Q3 2024 and remain below zero for a further seven quarters.
The MPC’s latest forecasts show CPI inflation falling below target two to three years ahead if Bank rate remains at the current 3.0%*. An assumption of a 3.0% average for Bank rate is a more sensible basis for the medium-term fiscal forecast. If long-term gilt yields were also to average 3.0%, the interest bill in 2026-27 would be £21 billion lower than the OBR has projected, according to its debt interest ready reckoner. This is equivalent to three-quarters of the extra tax raised in 2026-27 from measures announced in the Autumn Statement.
A possible interpretation is that Chancellor Hunt has been bounced into unnecessary fiscal retrenchment by a combination of a questionable downgrade to the OBR’s productivity projection and its punctilious adherence to a forecasting convention – of using yield curve-derived interest rate assumptions – that made little sense in the context of recent stressed markets.
Chancellor Hunt, however, may have had an incentive to collude with the OBR’s doom-mongering, since it has allowed him to “kitchen sink” fiscal bad news in the reasonable hope that another OBR forecasting swing will open up space for him to reverse course and announce tax “cuts” before the next general election.
*CPI inflation falls below 2% in Q2 2024 in the MPC’s modal (i.e. central) forecast and in Q3 2025 in its mean forecast (which incorporates a risk bias to the upside).
In times of market challenges, companies are taking steps to reduce their cost structure. Over the past weeks, we have seen several layoff announcements. As companies review and adopt their operating budgets for next year, other non-personnel costs could be at risk.
With many economies on the brink of recession, executives could be inclined to decrease their marketing expenditures. As shown in the latest International Business Barometer, more than half of corporations expect to reduce marketing expenditures over the next year in fear of recession.
As seen in previous downturns, companies maintaining their marketing expenditures increase their likelihood of emerging from recessions in a better position than competitors. As the competitive landscape becomes less intense, companies maintaining these expenditures could differentiate themselves and gain market share.
Market research is vital in finding new customers or launching new products. Market research expenditures represent a small proportion of the total marketing expenditures. For that reason, they tend to be more resilient compared to advertising expenditures. For example, P&G spent $7.9 billion on advertising during its fiscal year 2022, as opposed to $2 billion for research and development costs. In our view, market research expenditures could be one of the most strategic expenditures inside marketing budgets. Market research is the starting point for the launch of new projects, and it drives commercialization.
Ipsos, a company we own in our International Small Cap strategy, is one of the largest market research companies globally. The company is active in 90 different markets and employs more than 18,000 people. We believe that Ipsos benefits from secular growth driven by strong demand for reliable information to solve more complex issues. Corporations need to access that information to position themselves in a fast-changing world. The new 2025 plan unveiled by Ipsos aims to have the company grow faster than the market research industry, notably through market share gains and the development of digital and tech-based services.
Market size
The global market research services industry is expected to reach $90.8 billion by 2025. That industry is expected to grow 5.3% per annum.
Growth strategy
Expanding its client base or grabbing more share of wallet from their existing customers.
Adding new tech-based services, such as: SaaS offering, advisory, DIY research, social intelligence.
Thanks to its global reach, Ipsos is one of few companies with capacity to manage worldwide market research programs.
Well-diversified geographically and by client types. Its exposure to defensive sectors like the pharma and public sectors represents close to 30% of revenues.
Long-term client contracts with high recurrency.
Strong balance sheet with a low leverage ratio of 0.4x net debt to EBITDA.
Opportunities
Fragmented market with lots of opportunities to conduct M&A, especially in DIY research.
Digitization trend in the market research industry. Digitization helps bring down costs associated with data collection while providing new source of revenue.
Its revenue from new services has grown rapidly over the years. Through these new services, Ipsos has met corporates’ needs in term of data collection in real time, quickly analyzing large amounts of information, leveraging measurement of social media, and providing advice for clients. The company can build on that expertise and experience to increase market share.
With 32% of its revenue being generated in the U.S., Ipsos has room to gain more market share in the biggest market research industry globally.
The industry is somewhat exposed to the cyclicality of its clients’ marketing budgets.
Failure to develop new services or falling behind on technology would negatively impact its revenue.
Background
The Gulf region is comprised of six nations that sit on some of the largest and most profitable hydrocarbon resources in the world. Large and successful investments in the extraction and commercialisation of those resources created tremendous wealth for the region in the last 50 years, with average GDP per capita growing from around $1,000 in 1970 to over $30,000 in 2021.
This transformational growth in a relatively short period of time far exceeded the region’s human capital capacity and necessitated that those nations attract foreign workers to fill the gap. Today, over 30% of the region’s ~50 million population is comprised of expatriate labour (ranging from ~90% in the UAE to ~35% in Saudi), the majority of which are employed in the private sector. In the last ten years, governments in the Gulf have embarked on a series of initiatives to promote the localisation of the private sector workforce (Saudisation) through schemes that encourage businesses to hire local citizens. A bloated public sector funded by dwindling oil revenues pushed labour localisation initiatives to the centre of domestic economic and social policy in the Gulf.
In this research, we focus on Saudi Arabia which is home to the largest population in the Gulf region (~35 million in 2021 according to the World Bank), and where Saudisation is a key policy pillar.
Saudisation has been negative for labour-intensive businesses that rely on foreign workers. That, naturally, has been the area that the market has most focused on. In this paper, we move the conversation to the top of the organisational hierarchy by examining the changes in the nationality of the CEOs of publicly listed main market Saudi companies. While Saudisation does not directly determine the nationality of a CEO, the underlying theme of localisation is indeed relevant and consequential for investors in the Saudi equity market.
Academic research measuring the performance of expatriate CEOs has found that executive characteristics have a measurable effect on company performance. One notable study by Sekuguchi et al. demonstrated that expat executives at multinational companies operating in Japan were more effective at increasing subsidiary revenues compared to their native counterparts[1]. Given the limited breadth of data on this subject, our aim -for now- is to use the data available to present a practitioner’s view on the subject.
Investment considerations
At Vergent, we place great emphasis on understanding the culture of the companies we are invested in. This is a difficult task that we reserve for the companies that we believe have compounding potential and we want to own for the long term. It takes years of interactions with business leaders and their teams to begin to appreciate a company’s culture. As such, our process combines quantitative analysis that captures the manager’s capital allocation track record with an understanding of their incentive structures, what drives them, and what irritates them (generally, we don’t invest in irritable CEOs). In Saudi, a country our team has been investing in for over a decade, this is a particularly difficult area to explore and is made more complicated by the fact that CEO tenures are generally short, they rarely own stock, and there is a reasonable likelihood they are expatriates. This does not compromise the quality of CEOs in Saudi, but simply requires a reframing of traditional management evaluation frameworks to reflect the nuances of the market.
The expatriate CEO
Expatriate CEOs come from neighbouring Arabic-speaking countries or from the West. American CEOs are a rarity, given the tax treatment of U.S. citizens’ incomes abroad which makes tax-free destinations like Saudi less attractive
Many of the Arab expat CEOs built their careers in the region, and so naturally have an advantage over their western peers in the form of a more developed local network and a deeper understanding of consumer behaviour and culture
Western CEOs are typically appointed directly into a CEO role. Most would have spent time in emerging markets with a multinational company previously. The advantage those CEOs have over their Arab expat and Saudi CEO counterparts is they tend to have a better grasp of global trends and a global multinational managerial experience
The proportion of expat CEOs leading main market Saudi companies has decreased since 2016. Breaking that down, we find that IPOs contributed six expatriate CEOs by 2021, but that their net number dropped from 15 to 13 because of de-listings/mergers and a churn of expatriate CEOs that was filled by their Saudi peers
Figure 1: Expats lead a decreasing proportion of Saudi main market companies (%)
Source: Saudi Exchange Filings, Bloomberg
Sector dynamics
Certain sectors have historically had an above average percentage of expatriate CEOs. For example, in telecoms, two of the three listed companies are majority owned by multi-regional companies (UAE’s Etisalat and Kuwait’s Zain) that have tended to appoint expatriate leadership from within their broader group to run the Saudi units. In addition, the telecom industry requires global experience and technical knowledge that is less likely to be found among Saudi CEOs
Banking is another area where expatriate CEOs are over-represented (relative to the average). We attribute this to the presence of global banks in Saudi. Selective appointments made by leading banks to execute on transformational and highly complex growth strategies have also contributed to this over-representation. Al Rajhi Bank, the largest bank in the country by market capitalisation, hired an American CEO in 2015 to help build out and execute their growth strategy before transitioning to a very capable Saudi CEO in 2020
Banking as a sector has the highest percentage of Saudisation in the economy. It is therefore expected that we will see more Saudi leadership, even at the traditionally expat-led global banks. Our conversations with those banks suggests that they are increasingly looking to localise at the top. Saudi banks like Al Rajhi have displayed much more agility in the market in the last five years and have materially outperformed global banks who are realising that this competitive environment requires local expertise at the top. A recent example is Saudi British Bank (majority-owned by HSBC) which hired Lama Ghazzaoui, a female Saudi, as CFO in March 2021
We find that asset-heavy and cyclical industries have a greater proportion of Saudi leadership. Cement and petrochemicals are traditionally Saudi-led sectors. This is because these are established sectors with a good supply of capable Saudi managers with relevant educational and technical backgrounds. Many of these companies tend to be majority-owned by the state, and so naturally Saudi leadership is desired
Figure 2: Proportion of Saudi main market companies who have had an expatriate CEO at any time since 2016 by sector
Source: Saudi Exchange Filings, Bloomberg
Family business
Family-controlled businesses are a notable feature of the Saudi main market. From a list of 169 main market companies with a market cap of over $200 million (excluding REITs), we found that 84 are family-controlled. For clarity of methodology, we define family control as companies where one or more families sit at the top of the shareholder list
It is expected that the universe of family-controlled companies will grow as the stock exchange becomes a more desirable growth and exit option for those families. Therefore, an understanding of management dynamics in this area will only grow in importance
Family-owned companies are particularly prominent in sectors like building materials, retail, real estate, education, and healthcare
Of the 84 family-owned companies, 17 are still run by CEOs from the controlling family (family CEO). We expect the proportion of family CEOs to decline over time as businesses evolve and shareholder structures fragment with the entry of a new generation of family members who are less interested in being involved in the business. In the last two months, family CEOs of two retail companies resigned from their positions on account of operational and institutional underperformance
Outsider CEOs (from outside the family) are primarily Saudis rather than expatriates. In fact, 94% of family-controlled companies are run by outsider Saudi CEOs, which is in line with the overall market average
Saudi CEOs are better placed to fill professional CEO roles in family-controlled companies as they can manage the different stakeholders and processes involved in a traditionally family-run business
We believe there are significant value unlocking opportunities for companies that effectively transition from a family CEO to a professional CEO. Irrespective of nationality, CEOs will need the freedom to operate, and an aligned compensation that preferably includes stock ownership
Figure 3a: Proportion of CEOs by nationality in family-controlled businesses
Source: Saudi Exchange Filings, Bloomberg
Figure 3b: Proportion of family CEOs leading their family business today
Source: Saudi Exchange Filings, Bloomberg
Tenures
Intuitively, one would expect the tenure of Saudi CEOs to exceed their expatriate counterparts. Expats often return to their home countries for a variety of reasons and so leave the labour force more frequently. However, the data is inconclusive and suggests nationality is not a determining factor in CEO tenure. It should be noted that we are comparing a small population of expatriate CEOs to a large population of Saudi CEOs and so any observations should be noted in the context of that limitation
Family-owned and operated businesses with family executives have less turnover. One example is Jarir Marketing where the founding family has occupied the chairmanship of the Board and role of CEO since it listed the company in 2003
A few Saudi business leaders have been called to serve in government. Just this September, SABIC, the largest petrochemical company in the country, announced the resignation of CEO Yousef Al Benyan after he was appointed Minister of Education by royal decree. This impacts the tenure profile of Saudi CEOs
We believe that limited stock ownership among professional (non-family) CEOs is a contributing factor to the overall short tenure observed in Saudi
We observe that demand for the services of Saudi CEOs is high in the market. In the absence of stock ownership, Saudi CEOs are more likely to entertain and accept competing offers, resulting in tenures continuing to be relatively short
Figure 4: Tadawul Main Market CEO tenure by sector (Since 2016)
Source: Saudi Exchange Filings, Bloomberg
Summary
The measurement of management performance in Saudi is an area of research that is nascent and limited by data constraints (i.e., a small number of observations). Any conclusions we make in this paper are therefore largely based on anecdotal evidence, with data used to sense check those conclusions and provide context
Localisation and a new generation of Saudi business leaders is likely to see expatriate CEOs become less of a feature in the market. We believe this is positive as it should create more stability in tenures if coupled with aligned compensation structures and less competition for Saudi executives from the public sector
Family-controlled businesses run by family CEOs have a great opportunity to unlock shareholder value through effective professionalisation of management
We find that analysts and investors in the Saudi market are sanguine about management quality and alignment. There are numerous examples of the market looking through changes in management and not expecting negative future fundamental performance as an outcome
We believe management changes carry strong predictive power of future company fundamental performance. Developing an understanding of the people and culture of Saudi companies can contribute to generating significant insights on the quality of a company. This leads to better investment decisions and improves the prospect of generating investment alpha
[1] Sekiguchi T, Bebenroth R, Li D. (2011). Nationality Background of MNC affiliates’ top management and affiliate performance in Japan: Knowledge-based and upper echelons perspectives. International Journal of Human Resource Management 22 (5), pp. 999—1016.
Summary
We have been discussing the news flowing out of China’s 20th Party Congress (held from 16th-22nd October) at length over the past few weeks. While the press and market reaction was poor, there are some positives from the event that are underappreciated by the press/market. While political and structural risks remain elevated, we have kept our China weighting at neutral given positive signs of economic bottoming and improving liquidity data.
The event is important as the Congress report outlines high level, long term structural issues with more detailed economic policy due for release at the Central Economic Work Conference in December this year. Xi’s speech to Congress, a shortened version of the report, signalled no dramatic changes to policy. In addition, the new Central Committee of the CCP and Politburo Standing Committee were both announced at the conclusion of Congress. The Standing Committee, which is the apex of China’s political system, were all Xi loyalists and with Shanghai Party chief Li Qiang touted as the next Premier being the major surprise.
Below we list the positive, negative and neutral points which emerged from Congress.
Positives
Reiteration of development (implies economic growth) as a top priority and the real economy is the cornerstone (vs. pessimistic market speculations that this will come in second place after national security, or China would reject opening up). However, it seems that they’re calibrating the balance between development and security.
Continued emphasis on education, technology and innovation (in fact, higher priority vs. 19th congress). More support to semis and IT.
Relationship between consumption and investment: strengthen the fundamental role of consumption in economic development and the key role of investment in optimizing the supply structure.
Reiterated target that in 2035, China’s GDP per capita should reach that of a “medium-level developed country », target was first announced 3yrs ago with no specific definitions, but it will carry more weight given it’s in the opening report of the congress this time.
Negatives
Major shock was the composition of the new Politburo Standing Committee – all belong to Xi’s faction, some are relatively young (by CCP standards) and perceived to lack central government experience.
The market reacted negatively to the news despite this direction of travel having been made clear years earlier when Xi changed the Party constitution in 2018 to remove the two term limit for the presidency. However, most China watchers were hoping to see some checks and balances in the Politburo make-up as per historic precedent.
Foreign investors were quick to dump Chinese stocks once the list of Standing Committee members was announced – especially H-shares and US ADRs, while A-share declines were more moderate.
Appointments broke unwritten precedent that any officials aged 67 or under at the time of a party congress can be promoted, while anyone aged 68 or over is expected to retire (Xi turned 69 this year).
Appeared to double down on zero covid.
Plenty of mentions of common prosperity (basic requirement of China’s modernisation).
Reiterates policy continuity in the housing market (housing is for living, not for speculation).
More security (89 times in his speech, vs. 55 in 2017), less reform (48 vs. 69 before). National security a higher priority (vs. 19th congress). The concept of national security is comprehensive, covering political, economic, military, technology, cultural and social aspects and integrating external and domestic issues. Including key aspects like energy, self-reliance of food & technology.
Relationship between the market and the government: the market plays a determining role in resource allocation, and the role of the government should be improved.
Neutral
Relationship between SOE and non-SOE sectors: consolidate and develop the public sector economy; meanwhile, encourage, support and guide the non-public sector economy.
Chinese-style modernisation (more mentions vs. 19th congress).
Li Qiang is the de facto Premier (officially appointed in March next year). He is a Xi loyalist and the ex-Shanghai chief who presided over the city’s 2-month lockdown earlier this year. Li will be expected to steer the economy out of its current slump, relying on extensive experience in regional economic management in a number of business hubs.
No change of rhetoric on Taiwan – will make every effort to foster a peaceful resolution, seek more exchanges with Taiwan, but use of force cannot be ruled out.
Other observations
First time Xi didn’t read out full report (1.8h speech yesterday vs 3.3h 5yr ago), full report is more important – hasn’t released the official version, a 72pg version available on internet.
Zhao Lijian (spokesman for Chinese Ministry of Foreign Affairs) said: « China will never follow the old path of being closed and rigid, instead China’s door will only open wider. We will maintain high quality development and high level of opening up to provide a sustainable driving force for global economy. »
Conclusions
Long term investment implications
Congress does nothing to reduce the risk of China becoming stuck in the so-called “middle income trap”.
No clear sign that historic tendency for pragmatic policy making will change.
Cold War 2.0 with US to persist.
Short term investment implications
Short to medium term returns will be driven by the economy and Covid.