Hagia Sophia in winter (Istanbul, Turkey)

Summary

  • Slight down month for EM to round out the year.
  • The US dollar steadied against major currencies, following a sharp fall in November.
  • Turkey finished the year as the best performing market in EM (having been the worst in 2021), nearly doubling in USD terms.
  • Unsurprisingly, Russia was the worst, having been rolled out of the index in Q1.
  • China was the only major EM market to notch positive gains through the month as reopening moves ahead at a rapid clip.
  • Gulf markets struggled as a darkening global economic outlook hit energy stocks.
  • India had a down month following strong performance through the year. We think the long-term structural story in India is extremely compelling, but valuations look rich at this point.
  • Political risk in South Africa fell following president Cyril Ramaphosa’s re-election as African National Congress (ANC) party leader for a second five-year term, allowing the leader to run in the South African presidential election in 2024.
    • Re-election followed a tumultuous campaign, rocked by allegations that emerged in June that a large sum of foreign currency stashed inside a couch had been stolen from the president’s game farm in 2020.
    • A subsequent parliamentary investigation indicated that the president may be liable for misconduct, leading to an impeachment vote that was ultimately shot down by the ANC majority parliament in December.

Portfolio activity

  • Paring back exposure in Southeast Asia and India to add to China H-shares.
  • Maintaining bias to defensive sectors and quality.

Missed opportunity in Turkey?

  • There is currently no exposure to Turkey in the portfolio. Despite the sharp rally this year, we are wary of very poor liquidity and high macro risk. It is hard to see how the recent run is sustainable, to say the least.
  • Portfolio Manager Oliver Adcock visited Turkey earlier in 2022 to see whether there is a realistic chance of political change in presidential and parliamentary elections scheduled for most likely June 2023. Markets would undoubtedly cheer the election of an Erdogan alternative who would move quickly to establish a more orthodox fiscal and monetary regime.
  • Oliver met with pollsters, the head of one of the opposition parties, banks, corporates and a local thinktank.
  • Elections in 2023 look to be a close call, with the most likely outcome being that Erdogan and his AK Party lose control of parliament while retaining the presidency. We see this as a poor outcome.
  • One of the factors in Erdogan’s favour is that the coalition of opposition parties (the “Table of Six”) are struggling to decide on a presidential candidate, much less one that is likely to beat Erdogan to the presidency.
  • Erdogan does have room on the fiscal side and is likely to continue to pump the economy as much as he can into elections. This is despite headline inflation running at around 80%. Rates have recently been cut to 12%.
  • Cutting rates in the face of raging inflation courts serious currency risk, especially when forex reserves stand at around -$56 billion when accounting for currency swap lines (mainly with other Middle Eastern countries).
  • One large factor in the market rally has been driven by single stock futures, whereby the Turkish regulator has been allowing investors to reinvest gains made on trades even though they were not closed out. This has had the effect of supercharging the upswing.
  • Meetings with a number of banks confirm the economic situation is very volatile and fragile. The government is trying to control everything. New regulation attempts to force banks to lend at rates lower than 25%. The central bank rate is set at 12% but no one is lending there, banks are lending at 20% to SME and consumers, while deposits are 16%.
  • Overall, the economic backdrop is changing so rapidly that banks are reluctant to do anything, compelled to keep lending tight, and are holding weekly strategy meetings to assess key risks such as dwindling forex balance sheets.
  • The rally in Turkish stocks looks fragile and recent data indicates that foreign investors have been selling into it. Foreign ownership was already at historic lows and has continued to fall so it would seem that very few people have benefitted from this rally apart for the domestic traders who have been pumping the market (in many cases on margin) with the domestic liquidity created in the election run-up.
  • Risks are too high for us to build conviction in Turkey, however, it will be worth keeping an eye on polls in the coming months to see if sentiment changes once an opposition candidate for the presidency is chosen.

China regulatory headwinds abating

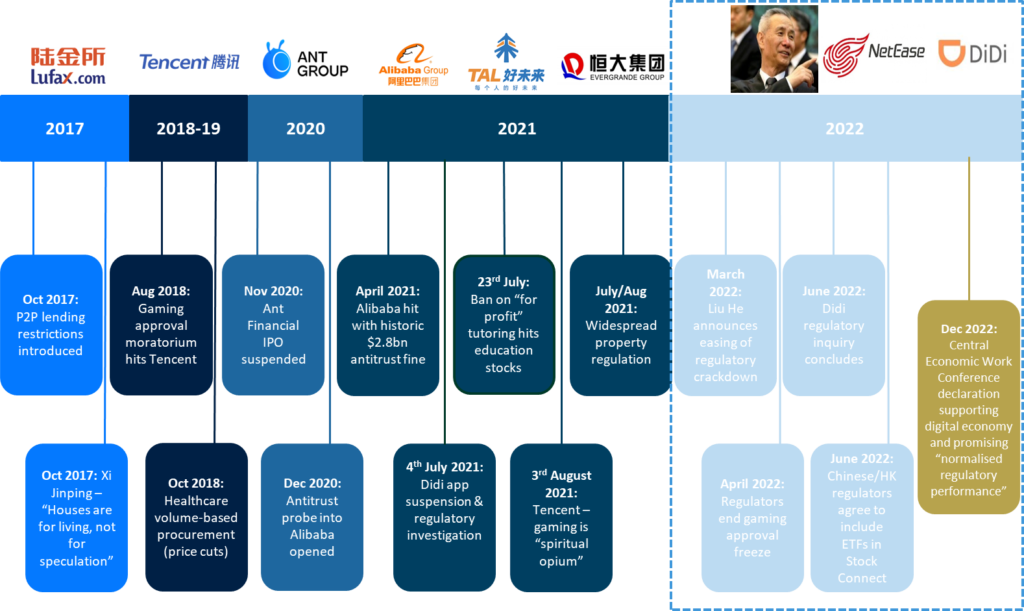
  • In March, Chinese Vice-Premier Liu He called for greater order and transparency in regulation of the tech sector. Our view was that this signalled a policy shift from Beijing, and that regulatory pressure was set to ease.
  • China made further supportive moves in December at the CCP’s annual Central Economic Work Conference (which shapes economic policy priorities), with policymakers declaring that it is essential to “support platform-based companies to leverage their abilities in leading development, creating jobs, and participating in international competition” (China Daily, December 2022).
  • This was soon followed by news that the China’s gaming regulator had granted 84 new game licences to domestic developers, and critically, 44 licences for imported games. These are the first approvals for imports for nearly two years. This shift from Beijing, which in August 2021 described gaming as “spiritual opium,” lifted the stocks of major gaming companies including Tencent and Netease.
Image shows timeline of Chinese regulatory events in the tech sector between 2017 to 2022.
Source: NS Partners Ltd., authorized and regulated by the Financial Conduct Authority.

China’s reopening accelerates

  • Following last month’s COVID 180 and rapid shift to reopening, Beijing pressed ahead through December despite news of a huge spike in cases (and presumably deaths) and hospital ICUs being overwhelmed.
  • China’s National Health Commission (NHC) announced a downgrade to the risk level for COVID (from class A to class B infectious disease), effective from 8 January. This effectively removes all centralised quarantine, contact tracing and risk area categorization throughout the country. Further, no control measures related to infectious diseases will apply at the border to all goods and people arriving from overseas. Travellers will only need a 48 hour pre-departure PCR test.
  • Outbound travel for Chinese citizens will also resume.
  • The NHC also reiterated that its focus will shift to boosting elderly vaccination levels, securing medical supply and healthcare resources (especially in rural areas), as well as prioritising treatment of severe cases.

Recent Bank of England signals have been deemed to be less hawkish than those of the Fed and ECB, contributing to a view that UK policy tightening is less likely to prove excessive, in the sense of causing greater economic damage than necessary to return inflation to target. 

Monetary trends do not support this hope. 

It should be remembered that the Bank embarked on rate hikes and QT before the Fed and has raised rates by 340bp versus the ECB’s 250 bp. 

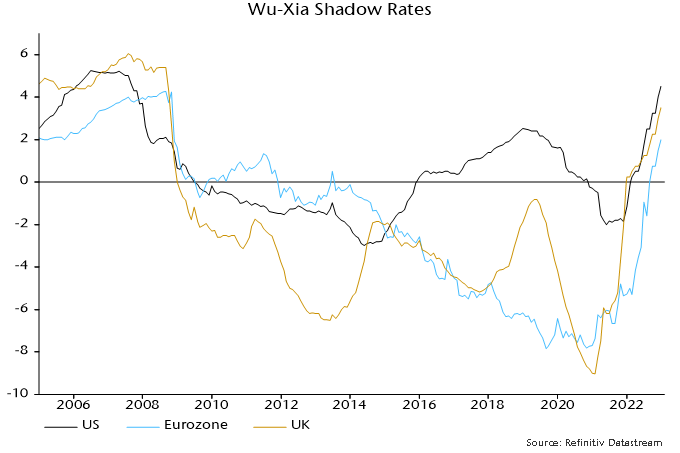
“Shadow” rate estimates attempt to incorporate the impact of unconventional monetary policy measures. The Wu-Xia shadow rate for the UK has risen by 1250 bp from its 2021 low versus increases of 650 bp and 980 bp respectively in the US and Eurozone – see chart 1. 

Chart 1

Chart 1 showing Wu-Xia Shadow Rates

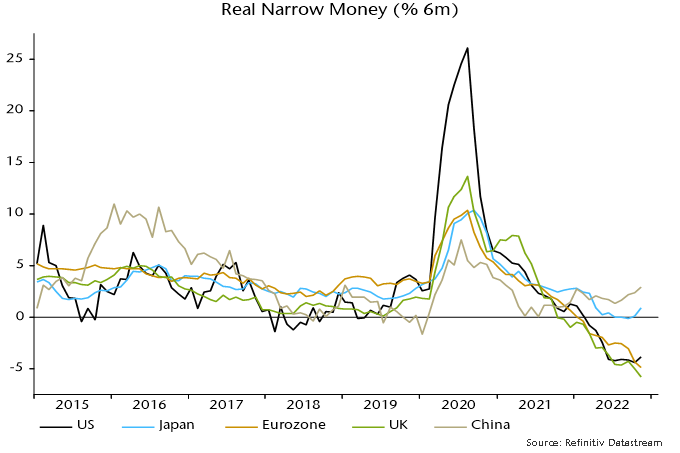
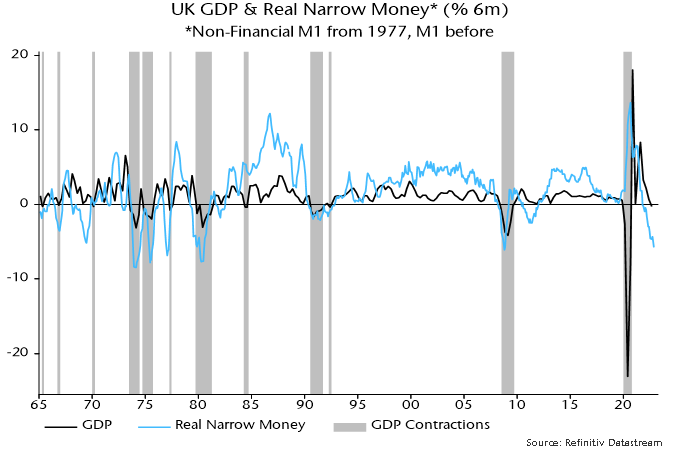
UK real narrow money (i.e. non-financial M1 deflated by consumer prices) contracted by more than comparable US / Eurozone measures in the six months to November – chart 2. The decline is historically extreme and suggests a severe recession – chart 3. 

Chart 2

Chart 2 showing Real Narrow Money (% 6m)

Chart 3

Chart 3 showing UK GDP & Real Narrow Money* (% 6m) *Non-Financial M1 from 1977, M1 before

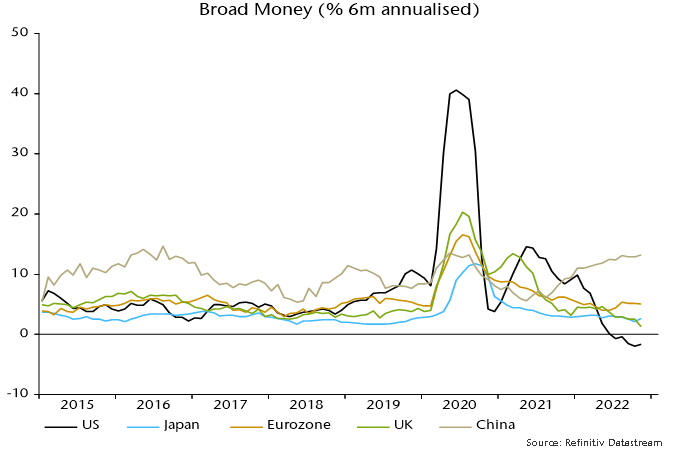
UK nominal broad money (non-financial M4) grew by just 1.3% at an annualised rate in the six months to November – chart 4. The comparable Eurozone measure rose at a 5.0% pace. US broad money contracted but is correcting a much larger increase in 2020-21. 

Chart 4

Chart 4 showing Broad Money (% 6m annualised)

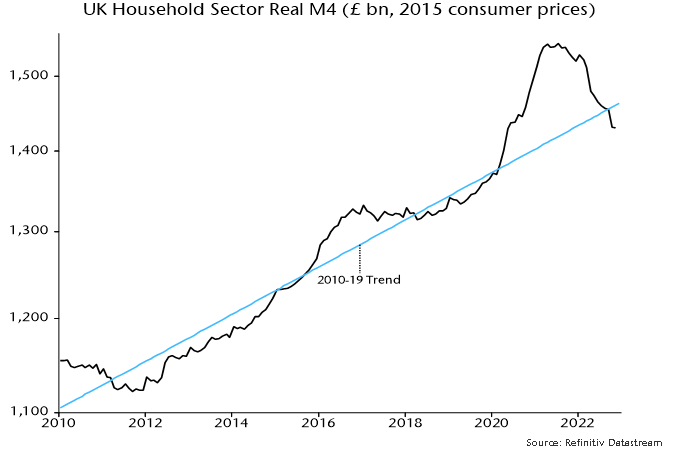
Real broad money holdings of UK households have retraced almost all of the pandemic-related surge, falling to the lowest level since May 2020 – chart 5. Far from “excess” money balances supporting spending, a real money squeeze is now likely to magnify consumption weakness. 

Chart 5

Chart 5 showing UK Household Sector Real M4 (£ bn, 2015 consumer prices)

Bank of England communications may be becoming less hawkish but the damage has been done. Officials ignored the monetary signal that a 2021-22 inflation spike would reverse with modest policy restraint. The economic consequences of overkill are likely to be at least as bad as in the US / Eurozone.

Gas price relief and Chinese reopening have tempered pessimism about Eurozone economic prospects, contributing to a Q4 rally in equities. Monetary trends, by contrast, suggest a worsening outlook due to the ECB’s scorched earth policy tightening. 

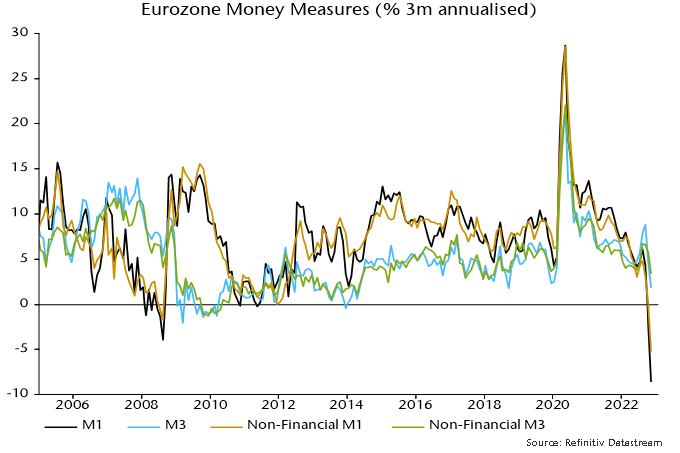
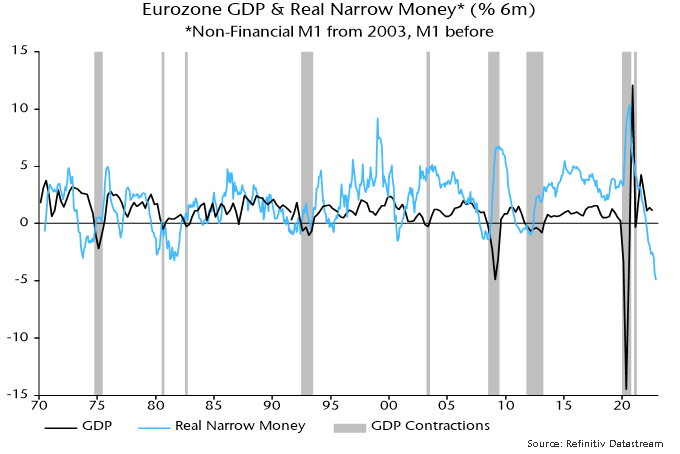
The preferred narrow money measure here – non-financial M1 – contracted for a third straight month in November. The three-month annualised rate of decline of 5.3% compares with a maximum fall of 1.7% during the GFC – see chart 1. 

Chart 1

Chart showing Eurozone Money Measures

Narrow money weakness is being driven by households and firms switching out of overnight deposits into time deposits and notice accounts – a normal pre-recessionary development. Broad money, in addition, is slowing – non-financial M3 rose by only 0.2% in November, pulling three-month annualised growth down to 3.4%, the slowest since 2018. 

The headline M1 and M3 measures are displaying greater weakness, reflecting a fall in money holdings of non-bank financial corporations.

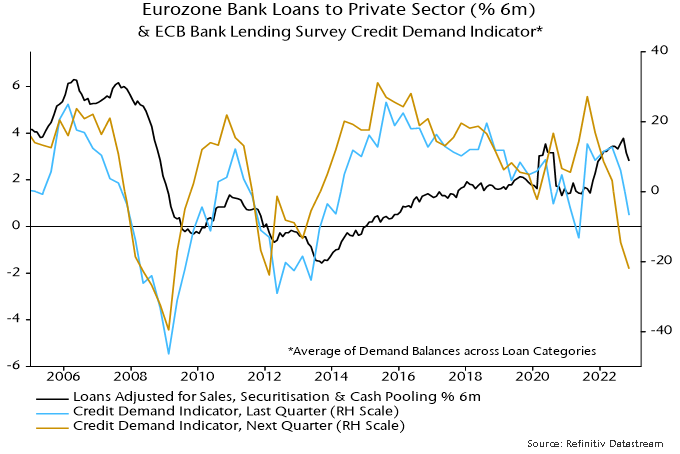
Broad money growth had been supported by solid expansion of bank loans to the private sector but, as expected and signalled by the ECB’s lending survey, momentum is now fading – chart 2. Slumping credit demand and forthcoming QT suggest that broad money will follow narrow into contraction. 

Chart 2

Chart showing Eurozone Bank Loans to Private Sector and ECB Bank Lending Survey Credit Demand Indicator

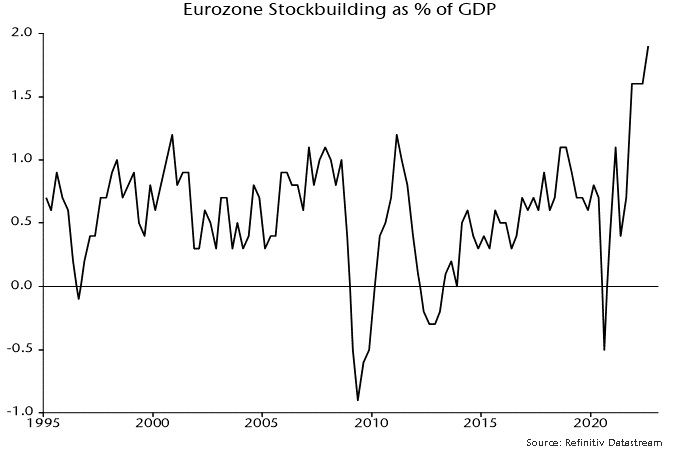
Corporate loan demand had been boosted by inventory financing but stockbuilding reached a record share of GDP in Q3 – chart 3 – and is probably now being cut back sharply, contributing to a move into recession. Consistent with this story, short-term loans to corporations contracted in both October and November. 

Chart 3

Chart showing Eurozone Stockbuilding as Percent of GDP

A sharp fall in inflation will support real money trends but has yet to arrive. The six-month rate of contraction of real non-financial M1 reached another new record in November – chart 4. 

Chart 4

Eurozone GDP and Real Narrow Money

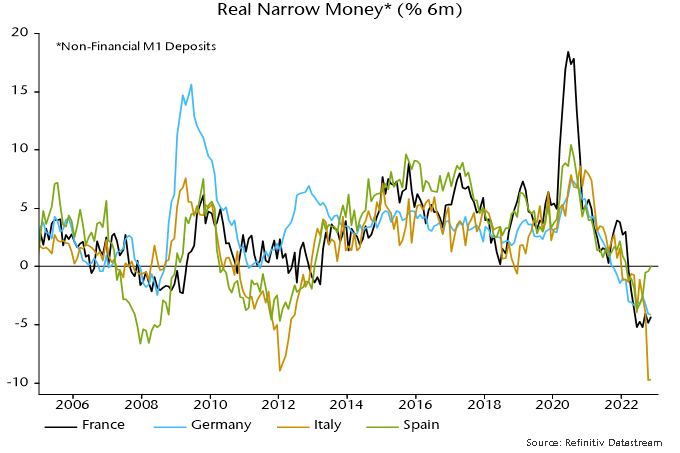
Monetary tightening in 2007-08 and 2010-11 was associated with a divergence of money trends across countries, reflecting and contributing to financial fragmentation. This is occurring again, with weakness focused on Italy. 

Italian real narrow money deposits contracted by 9.7%, or an annualised 18.4%, in the six months to November, with the larger decline than elsewhere due to both greater nominal weakness and higher CPI inflation – chart 5.

Chart 5

Chart showing Real Narrow Money

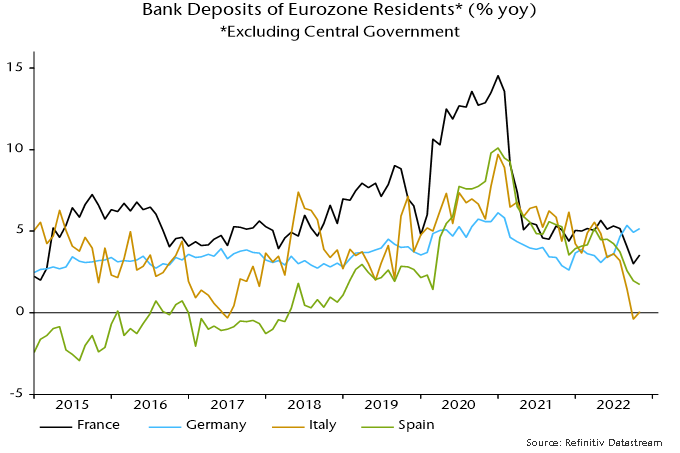
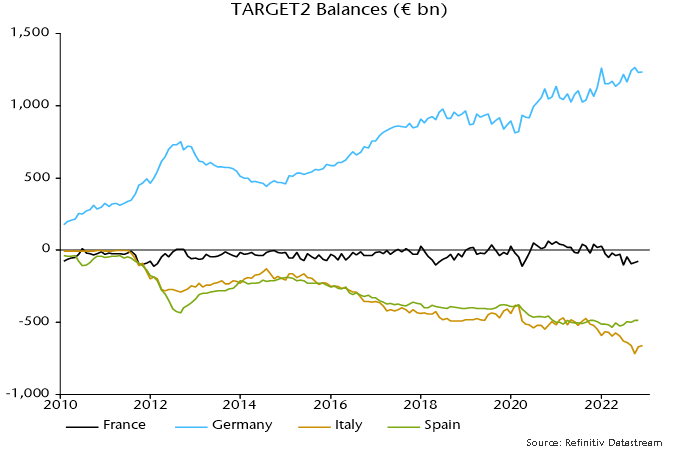
In nominal terms, total bank deposits in Italy were unchanged in the year to November – chart 6. Italian banks’ assets grew modestly over this period. The banks funded this expansion by increasing their net borrowing from Banca d’Italia, which in turn accessed additional funding from the Eurosystem, resulting in a further widening of its TARGET2 deficit. The deficit reached a record €715 billion in September following a surge in Italian BTP yields, falling back in October / November – chart 7. Another rise in yields since early December may have been associated with deposit outflows from the banking system and renewed upward pressure on the TARGET2 shortfall. 

Chart 6

Chart showing Bank Deposits of Eurozone Residents

Chart 7

Chart showing TARGET2 Balances

Image of human hand stacking generic coins over a black background with hexagonal golden shapes. Concept of investment management and portfolio diversification.

As discussed recently, inflation will be supported by low unemployment in 2023. This could be described as a classic inflation gap, as we expect a wave of salary adjustments persisting well into 2023.

Many important factors will keep unemployment at low levels. These include:

  • Demographics, especially in the U.S. where more and more Baby Boomers are accelerating their exit from the workforce, following a difficult COVID period.
  • Many developed countries halted immigration during COVID, causing backlogs compared to normal intakes.
  • Long COVID among many workers has been keeping them out of the workforce for lengthy durations.

As economic data comes out, high interest rates are beginning to affect the economy, as reported by the recent consumer price index (CPI) report. Weakening demand mixed with higher costs will weigh on corporate profits in 2023. The good news is Global and EAFE Small Cap valuations are at their lowest since the 2008-2011 period. These low valuations could provide stock price support as corporations reduce their profit guidance. As well, sentiment is at multi-year low and can only improve.

So, where to position in an economic downturn? Warren Buffet once famously asked, “What was the most popular chocolate bar in 1962?” Snickers, he answered. And what was the most popular chocolate bar in 2020? Snickers. Focus on what is resilient is the moral of this story.

The second anchor in a downturn is balance sheet strength as interest expense for many corporations start to rise. Recent Federal Reserve statements forecast a lengthy period of elevated interest rates. And the recent Carvana debt debacle will not be the only one. We certainly feel that many companies and analysts are too conservative in their medium-term (i.e., two year) interest rate outlook.

A third anchor relies on themes and long-term positive industry trends. Stocks with high exposure to critical, well-supported trends (renewables or onshoring, for example) will certainly help weather markets suffering from consumer demand decelerations.

Our portfolio companies hold substantial net cash war chests, and they have important M&A growth options during a slowdown. Let’s have a closer look at some holdings.

Several of our firms have net cash as a percentage of their market cap at a level greater than 10%. These include: Mabuchi Motor Co., Ltd. (37%), LINTEC Corp. (28%), SEGA SAMMY Holdings Inc. (17%), THK Co., Ltd. (12%), and Globus Medical, Inc. (11%). In addition, Ain Holdings Inc., Sakata Seed Corp. and Daiseki Co., Ltd. are all at 10%. This is only a short list of holdings at or above the 10% mark. Many of our companies have simply no debt.

What is even more reassuring is that a variety of tailwinds benefit our holdings. Let’s take SEGA SAMMY (6460 JT) for example. The Japanese gaming provider has transformed into an integrated entertainment powerhouse. Born from gaming, Sega’s Sonic the Hedgehog brand has been featured in movies, including a recently launched Netflix animated series. Additionally, the entertainment company’s newest 3D Sonic game, Sonic Frontiers, has sold more than 2.5 million copies worldwide since its launch in early November.  

Mabuchi Motor (6592 JT), the leading small motor provider out of Japan, is flush with cash and has no requirement of large expansion capex. Small motors are growing faster than many industrial markets due to increased demand for robotics. Moreover, the market in which Mabuchi operates is highly fragmented. The company can certainly use its cash for highly accretive acquisitions in the future.

At 11% net cash, Globus Medical is a quality anomaly in the medical technology world. The U.S.-based provider of orthopedic devices and robots is clearly a technology leader. Its surgical robots increase productivity four-fold in terms of successful back surgeries. As the company will ultimately see a peak penetration for its robots, it will be in a strong position to accelerate new innovations either by development or acquisitions.

Many of our companies demonstrate three key attributes:

  • product resilience,
  • positive tailwinds, and
  • balance sheet strength.

Product resilience can come in many forms and can be found in types of business models: Software as a Service (SaaS), maintenance services, and long-term fixed agreements, just to name a few. Global Alpha initiated in Reliance Worldwide Inc. (RWC AU). The Australian company is a leading provider of emergency plumbing equipment sold through global retailers such as Home Depot and Lowes. Reliance Worldwide’s sales performed well during the 2009 real estate collapse, and we feel its sales will hold up equally well in current market conditions.

Net cash is not the only way to uncover balance sheet strength. One of our holdings, Meliá Hotels International (MEL SM), recently went through an asset valuation analysis with CBRE. The Spanish hotel owner and operator is presently benefiting from strong volumes from its quality portfolio of hotels. The CBRE valuation of real estate assets came in at € 4 billion. This is against a debt level of € 1.3 billion and a market cap of € 1.1 billion.


US non-farm payrolls have risen by an average of 337,000 per month in the eight months since the Fed started hiking rates in March. The household survey measure of employment was essentially flat over this period.

The gap between the eight-month changes in the two series is at a record high, excluding April-May 2020 when data were distorted by the pandemic*. (This comparison, however, uses revised data for the two series.) 

The payrolls numbers have informed the FOMC’s judgement that “job gains have been robust”, in turn influencing the magnitude of the rise in rates this year. 

The payrolls survey covers about 670,000 worksites, while the household survey has a sample size of about 60,000. Sampling error, therefore, is larger for the household survey – the standard error of the monthly change in the household survey employment measure is more than four times that of the monthly payrolls change, according to the BLS. 

The payrolls survey, therefore, is conventionally regarded as the more reliable gauge of short-term employment movements. 

A focus on monthly sampling error, however, ignores sometimes large revisions to the payrolls data due to annual benchmarking against unemployment insurance tax records. There is no comparable annual revision to historical household survey data. 

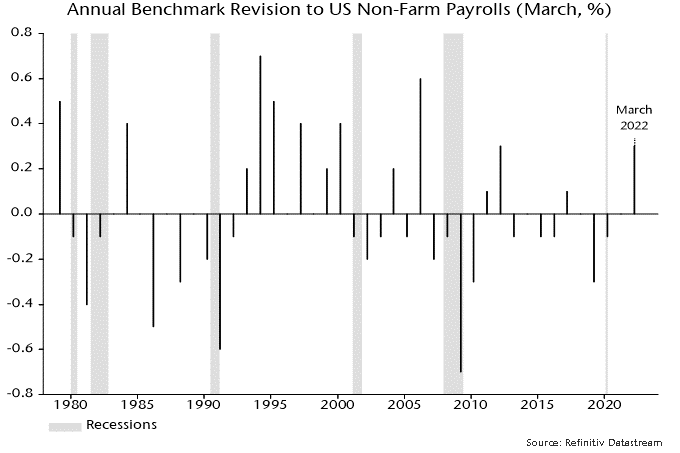
The annual payrolls revisions have averaged close to zero over the long run but there have been clusters of negative revisions around recessions – see chart 1. 

Chart 1

Chart 1 showing Annual Benchmark Revision to US Non-Farm Payrolls (March, %)

Benchmark revisions occur with a long lag. The BLS in August issued a preliminary estimate of a 462,000 upward revision to the March 2022 level of payrolls. This will be incorporated in monthly historical data up to March 2022 in February 2023. 

Benchmark revisions to recent monthly data, therefore, will occur in February 2024 under current BLS practice. 

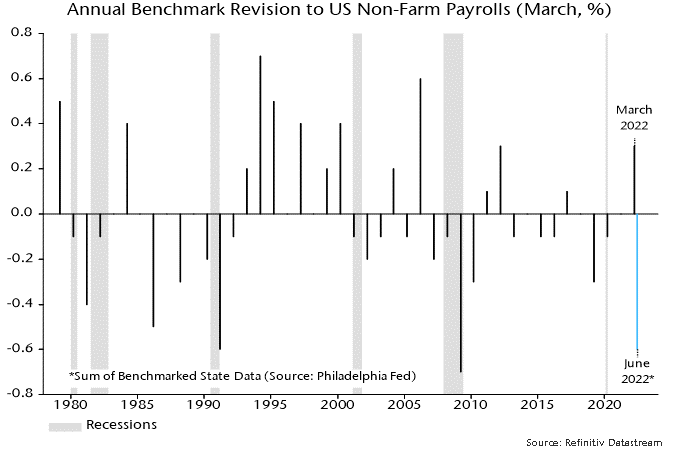
Research by the Philadelphia Fed suggests that these revisions will be negative and potentially very large. The researchers have attempted to replicate the annual BLS benchmarking procedure using quarterly UI records. They estimate that the currently-reported level of payrolls in June 2022 of 151.9 million will be revised down by 843,000, or 0.55% – chart 2. 

Chart 2

Chart 2 showing Annual Benchmark Revision to US Non-Farm Payrolls (March, %) *Sum of Benchmarked State Data (Source: Philadelphia Fed)

This would imply that payrolls grew by only 3,500 per month on average between March and June compared with the currently-reported 349,000. 

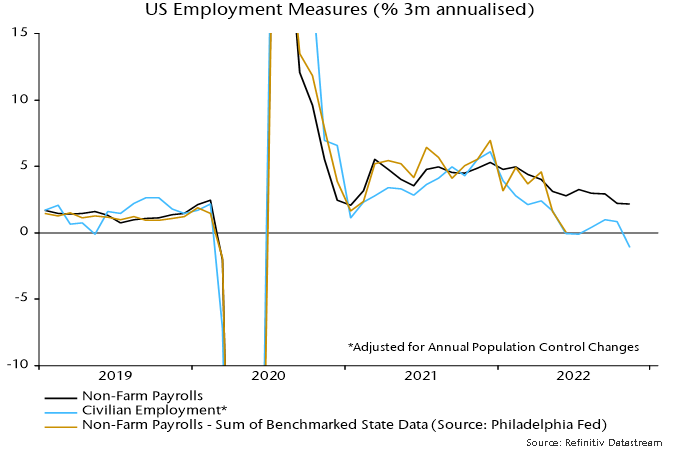
Chart 3 compares three-month growth rates of the official payrolls series, the household survey employment measure and the Philadelphia Fed benchmarked payrolls series. The May / June readings of the latter two are equal.

Chart 3

Chart 3 showing US Employment Measures (% 3m annualised) *Adjusted for Annual Population Control Changes

The official payrolls measure has risen by an average of 329,000 per month in the five months since June. Monthly gains in the household survey employment measure averaged 72,000 over this period. 

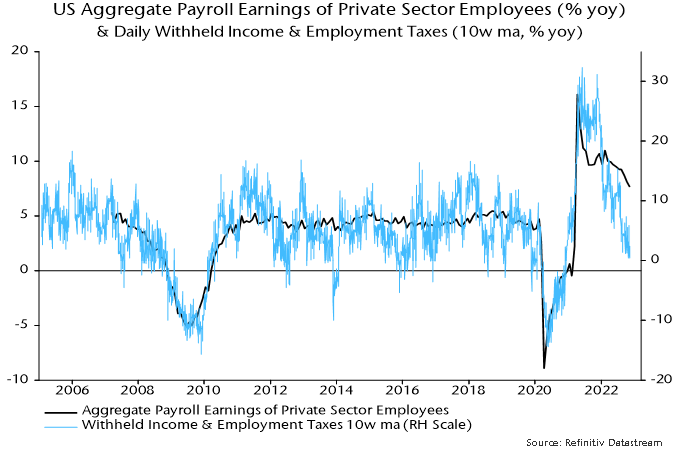
A benchmarked September payrolls estimate from the Philadelphia Fed will be released in March but timely data on withheld income and employment taxes – including UI taxes – suggest that the official payrolls series has continued to overstate gains. The daily tax data are noisy but year-on-year growth of a moving average has fallen sharply since June, widening an undershoot of the normal relationship with aggregate private sector earnings growth from the payrolls survey – chart 4. 

Chart 4

Chart 4 showing US Aggregate Payroll Earnings of Private Sector Employees (% yoy) & Daily Withheld Income & Employment Taxes (10w ma, % yoy)

*The payrolls series measures jobs while the household survey measures people. The wide gap partly reflects a rise in the number of people with multiple jobs. A BLS research series is available that attempts to convert household survey employment data to a payrolls concept, including by adding multiple jobs. This series rose by an average of 103,000 per month in the eight months to November. The difference with payrolls growth is also a record excluding 2020 data.

The BoJ’s decision to widen the fluctuation band of the 10-year JGB yield around the zero target follows an apparent withdrawal of monetary policy support by the PBoC in recent weeks. 

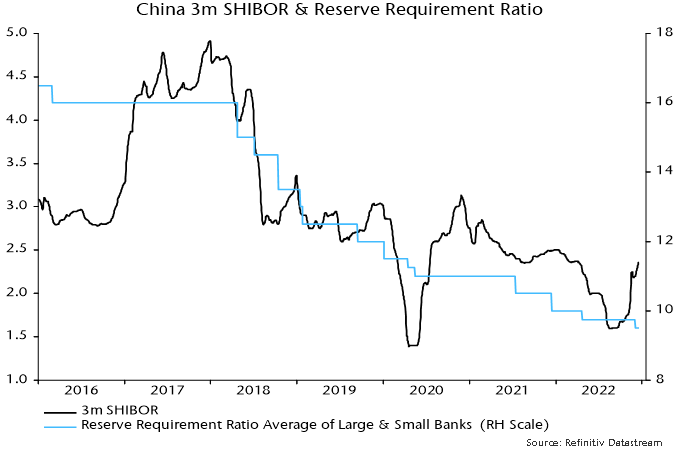
Three-month SHIBOR has risen by 75 bp since late September and is now only 15 bp below its start-of-year level – see chart 1. Upward pressure has been partly market-driven but the PBoC has chosen not to accommodate increased demand for liquidity. 

Chart 1

Chart 1 showing China 3m SHIBOR & Reserve Requirement Ratio

The PBoC’s Q3 monetary policy report, issued in November, expressed concern about medium-term inflation risks, stressing the importance of avoiding excessive monetary growth. An apparent hawkish shift may have been reinforced by the shock abandonment of the zero covid policy, which officials may view as likely to boost near-term price pressures via a faster demand recovery and / or an increase in supply bottlenecks. 

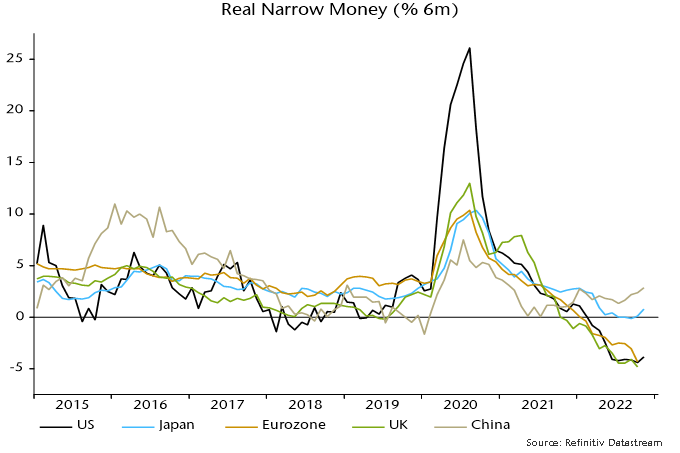
The Japanese / Chinese policy moves are worrying because monetary trends in the two economies have been providing a modest offset to significant US / European weakness – chart 2. That support could now fade. 

Chart 2

Chart 2 showing Real Narrow Money (% 6m)

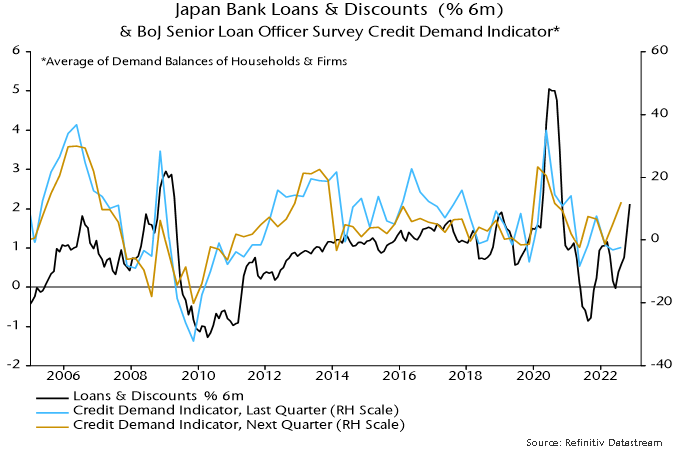
A rise in Japanese six-month narrow money growth in November was accompanied by a further pick-up in bank lending, consistent with stronger credit demand expectations in the BoJ’s Q3 loan officer survey – chart 3. The hope is that firmer bank loan growth / money creation will survive a modest policy adjustment. 

Chart 3

Chart 3 showing Japan Bank Loans & Discounts (% 6m) & BoJ Senior Loan Officer Survey Credit Demand Indicator* *Average of Demand of Households & Firms

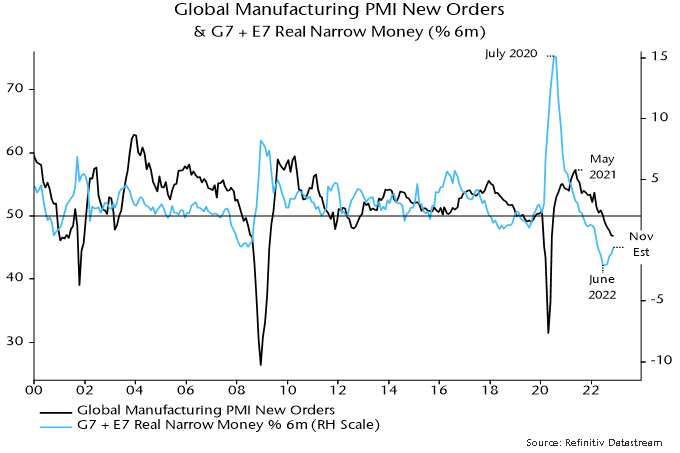
Global six-month real narrow money momentum is estimated to have risen for a fifth month in November but remains negative – chart 3. Allowing for the usual lag, the suggestion is that global manufacturing PMI new orders will bottom by next spring but remain in recessionary territory into Q3. 

Chart 4

Chart 4 showing Global Manufacturing PMI New Orders & G7 + E7 Real Narrow Money (% 6m)

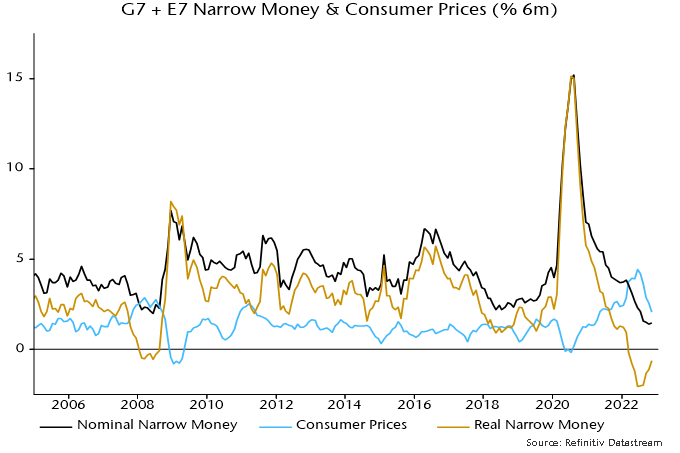
The recovery in real money momentum continues to be driven by a slowdown in six-month CPI inflation, with nominal money growth languishing – chart 5. The inflation decline will extend but overly hawkish central banks risk pushing nominal money momentum to new lows. 

Chart 5

Chart 5 showing G7 + E7 Narrow Money & Consumer Prices (% 6m)

Nous sommes heureux d’annoncer que Banyan a récemment établi un partenariat avec Jason Grouette afin de cibler des occasions de placement dans les domaines des B2B industriels, des équipements de protection individuelle (fabrication et distribution), des systèmes de sécurité techniques ainsi que des services de sécurité et de réparations.

M. Grouette est un ancien cadre de 3M qui, depuis 2005, a dirigé diverses unités d’exploitation au Canada et aux États-Unis, dont la valeur variait entre 100 M$ et plus de 1,5 G$. Plus récemment, il a dirigé l’intervention de 3M sur les masques N95 pendant la pandémie au Canada et aux États-Unis, tout en dirigeant la division de la sécurité personnelle.

M. Grouette s’est engagé auprès de Banyan Capital Partners à titre de partenaire opérationnel dans le but de trouver, d’acquérir et de diriger une entreprise dans le domaine de la sécurité industrielle.

Apprenez-en plus sur nos critères de placement avec Jason.

Nous continuons d’ajouter des placements à notre portefeuille et vous pourriez être le prochain partenaire. Joignez-vous à notre réseau de partenaires d’exploitation et achetons et bâtissons une entreprise ensemble.

In mid-October 2022, after more than 2.5 years of strict border control measures, Taiwan lifted all its COVID entry restrictions and allowed foreigners free access. As countries returned to their pre-pandemic routine, Taiwan was among the laggards (along with China and Hong Kong) in loosening requirements for visitors to complete a mandatory lengthy quarantine. That is why we welcomed (to say the least) the announcement of easing travel restrictions. And after two weeks of preparation, we landed in Taoyuan International Airport at the beginning of November.

Except for the requirement to wear a mask in all public places including outdoors, lifted only on December 1, life in Taipei looked normal. There was strong traffic in malls, convenience stores, hotels and restaurants. Over the span of a week, we met with 28 corporates engaged in the information technology, consumer, healthcare and industrial sectors.

Our general impression was mixed, with more optimism around healthcare and consumer-oriented companies balanced by a more cautious outlook provided by the technology operators. Overall, most corporates noted quite low visibility going into 2023, with only a handful of companies ready to provide guidance for the next year.

Key takeaways from our meetings:

  • Strong domestic consumption recovery after the reopening in Taiwan.
  • Most of the semiconductor companies are in the midst of weak momentum due to slow demand for consumer electronics and inventory corrections. PC and handset unit sales are expected to decline in 2023.
  • Data servers, automotive and industrial remain the only bright spots for now. The U.S. hyperscaler server market is expected to continue growing at a double-digit rate in 2023, although global enterprise and China server demand are expected to remain weak. Demand for ASIC (application-specific integrated circuit) design remains strong, as does demand for the ABF (Ajinomoto build-up film) substrate despite a correction in the PC market.
  • The impacts so far of U.S. sanctions on the Chinese semiconductor space are limited on Taiwan semiconductor companies because the new rules target only the most advanced technology, and most Chinese IC (integrated circuit) designers are making changes to fall within key thresholds of those sanctions. Moreover, some companies aim to reap benefits on lower competition with Chinese peers in the long term. However, there is a risk of further escalation in U.S.-China relationships, which could disrupt global technology supply chains and impact demand in 2023.
  • Many technology companies pointed out an increased need to de-risk their production facility locations following their customers’ requests for production capacities outside of both China and Taiwan.
  • General supply chain normalization, with remaining tightness in the supply of some key components.

Taiwan is the second largest market for our Emerging Markets strategy (behind India), with about 20% weight in the MSCI EM Small Cap index. It is the only country in the EM universe with a clear sector bias, as information technology accounts for more than half of the country weight in the benchmark. In the first 10 months of the year, Taiwan Small Cap underperformed the EM benchmark by more than 10%, a result mostly driven by derating of the technology sector. However, its performance in November looks like the beginning of a year-end rally on the expectations of semiconductor inventory correction bottoming. Likewise, moderating geopolitical risk may ease following the results of local mayoral elections on November 26, in which the Kuomintang, a party taking a more moderate stance on China, scored a big win over the incumbent Democratic Progressive Party.

Although we remain cautious on the technology inventory correction cycle, as there are multiple risks that might delay the sector recovery (e.g., deep recession in the U.S. and Europe, and broader geopolitical escalation), we acknowledge that some of the corporates in Taiwan are progressing well ahead of their peers. Most of market participants expect that a cyclical bottom in semiconductor demand might occur in the first half of 2023, with sequential improvement starting in the second half of 2023. This could drive a strong recovery in technology stocks. The importance of understanding inventory cycles was discussed in our note published on March 13, 2009. We see similar patterns here and remain alert to understanding where we are in the cycle.

Our EM portfolio is currently in a market-neutral position in Taiwan. We have a balanced roster of technology leaders, dominant operators catering to domestic markets, and exporters benefiting from secular tailwinds.

Here is a description of a sample of our holdings in Taiwan.

Chroma ATE Inc. (2360 TT) is a power and semiconductor testing equipment provider enjoying a leading position among the top-five global IC testers. For instance, NVIDIA uses Chroma testing equipment for all its products. Chroma also enjoys strong growth momentum in the electric vehicle (“EV”) industry. The company is one of the few operators in the technology sector that is less susceptible to industry cyclicality, and it has better visibility into the longer-term growth trajectory of the semiconductor industry.

Universal Vision Biotechnology Co., Ltd. (3218 TT) is the largest ophthalmology chain in Taiwan. The firm offers various eye treatments and related medical services such as laser vision correction and cataract surgeries. It is the leading brand in Taiwan, backed by a 30-year track record of high-quality services and innovation, with a dominant position in advanced eye surgeries such as SMILE (Small Incision Lenticule Extraction) and FLAC (Femtosecond Laser Assisted Cataract Surgery). The company also sells optometry products such as eyeglasses, contact lenses, and orthokeratology lenses at its self-operated eyewear stores. Benefiting from structural demographic tailwinds in Taiwan – due to high prevalence of myopia in the population – UVB is also a beneficiary of China’s COVID reopening, where it derives 25% of revenue. Following the recent easing of COVID restrictions, the company is looking to accelerate clinic openings in China.

Makalot Industrial Co., Ltd. (1477 TT) is one of the major global apparel manufacturing companies with industry- leading design flexibility, lead times, product offering and scale. We believe it is one of the main beneficiaries of the supply chain consolidation trend due to its diversified production sites, aggressive expansion in Indonesia and Bangladesh, and ability to deliver rush orders.

UK payrolled employment rose solidly again in November, while pay growth numbers for October surprised to the upside. It has been suggested that this news reinforces the case for a Bank rate hike of at least 50 bp this week. 

Employment is a lagging economic indicator. There is ample coincident evidence that a recession is under way. Annual broad money growth – as measured by non-financial M4 – is down to 3.4%, a level suggesting a medium-term inflation undershoot. The view here is that any rate rise this week will be a mistake. 

The monthly payrolled employment measure has a short history but it correlates closely with the quarterly (and less timely) Workforce employee jobs series. In the 2008-09 recession, the latter measure peaked two quarters after GDP.

Labour market indicators that lead employment / unemployment include the stock of vacancies and average hours worked. These indicators are usually roughly coincident with GDP.

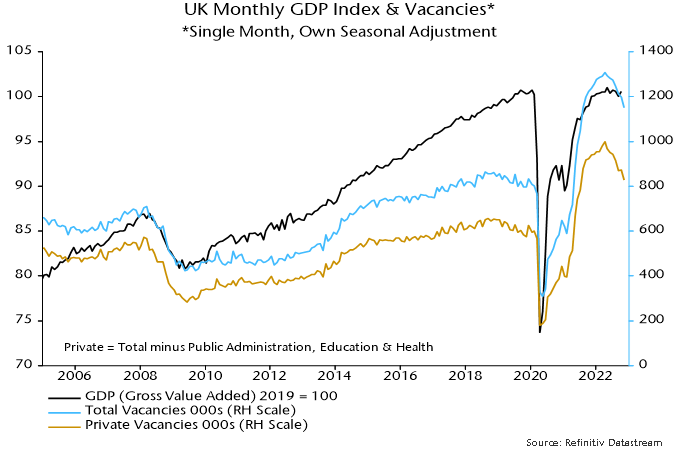
The headline vacancies series is a three-month moving average but non-seasonally-adjusted single-month numbers are available and can be adjusted using a standard procedure. The resulting series peaked in April, one month before GDP, and fell again in November – see chart 1. The recent pace of decline is comparable with the 2008-09 recession.

Chart 1

Chart 1 showing UK Monthly GDP Index & Vacancies* *Single Month, Own Seasonal Adjustment

The weak November vacancies number suggests that GDP contracted significantly last month after October’s catch-up from reduced September activity due to the Queen’s funeral.

Average weekly hours tell a similar story. The series, which is available only as a three-month moving average, peaked in March and fell again in October, reaching its lowest level – excluding the pandemic recession – since 2012.

Should the MPC react to strong pay numbers? The monetarist view is that pay pressures are an effect rather than a cause of high inflation and will moderate as the dramatic slowdown in money growth since 2021 feeds through to slower price rises.

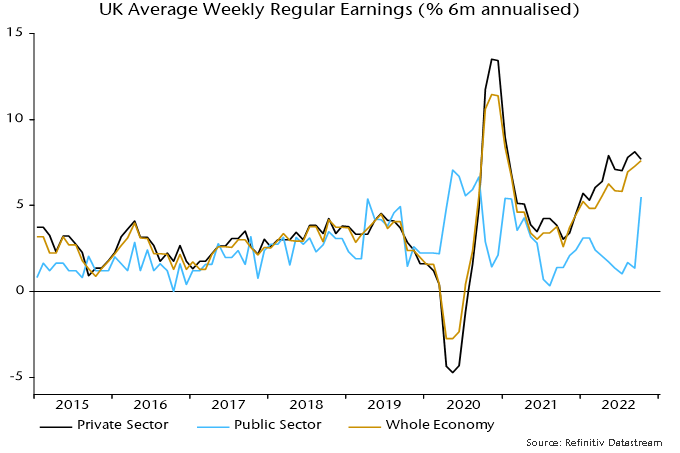
The latest upside surprise, in any case, reflects a belated catch-up in public sector pay; six-month growth of private sector regular pay is high but moving sideways – chart 2. A public sector pay pick-up may be bad news for real government spending and / or the public finances but will have little effect on the pricing behaviour of private sector suppliers of goods and services – especially against a backdrop of deepening recession and a loosening labour market.

Chart 2

Chart 2 showing UK Average Weekly Regular Earnings (% 6m annualised)
U.S. flag and Wall street sign in Manhattan's financial district.

As we write this commentary, stock markets around the world have been staging a spectacular rebound over the last few weeks. Many are now in a bull market, meaning they are up more than 20% since the last bottom.

How to explain such optimism when inflation remains stubbornly high, central bank rates are still rising, the war in Ukraine rages on, and China is still committed to a COVID-zero policy?

In the last few weeks, we attended numerous small cap conferences in the U.S., Japan, the UK, Norway, France, Taiwan and Vietnam to further research that optimism. In all, we met over 100 companies and attended various industry and thematic panels.

There were a lot of takeaways from these meetings, and in this week’s commentary we will focus on the U.S.

  • A majority of companies indicated they will continue to raise prices in 2023 to offset continued inflationary pressures. For example, cement companies expect cement prices to go up 12% in 2023. Residential housing may be down, but infrastructure spending – turbocharged by the Inflation Reduction Act – will more than offset this decline. John Deere just announced equipment prices will go up 11% in 2023. Meanwhile, agricultural prices remain high and farm income is near a record, boosting demand. New car prices will go up double digits.
  • Companies expect to increase salaries in 2023 by more than they did in 2022, with the general expectation that wage inflation will be between 5-10%. As a possible indication of things to come, four freight rail unions – with a combined membership of close to 60,000 rail workers – recently voted down the five-year contract agreement brokered by the Biden administration back in September. The rejected deal would have given workers a 24% raise over five years and an average immediate payout of $16,000 in back raises and bonuses. As we write this comment, Amazon workers in more than 40 countries are staging walk-off protests with the slogan “Make Amazon Pay.”
  • Demand remains strong. Although some weakening has been felt since the latter part of November, the latest economic indicators seem to reflect a resilient economy that is still growing. For example, the Empire Manufacturing Survey came in at 4.5 compared to expectations of -5.0, indicating positive expansion. This follows -9.1 in October. Durable goods orders were very strong. Of note, retail sales were solidly positive – accelerating from the prior month – and new home sales were stronger than expected. As well, jobless claims remain below the pre-pandemic levels. In the hotel sector alone, more than 200,000 positions remain vacant.

Does the stock market believe in a soft-landing scenario? Maybe. But it is now convinced that the Fed will pause its interest rate hiking cycle and may even lower rates in 2023! The consensus right now is that inflation will continue to go down and should end next year at around 3.5%. Interest rates will continue going up but should peak around 4.5 to 5% by mid-2023, and may start coming down by the end of 2023.

Our scenario is very different.

We believe inflation at the end of 2023 will still be at 5% or above. Why?

As indicated above, wages will rise more than 5% and rent increases will continue to exceed 5%. Meanwhile, commodities – after relatively easy year-over-year comparisons in the early part of 2023 – will start going up again towards mid-2023. Metal prices are already going up, as are natural gas prices. Food prices will continue going up, and insurance prices are poised to explode in 2023. 

Facing such inflation, and at the risk of losing its already low credibility, the Fed will continue raising rates. How high? We believe the only way to break the inflation expectation, which is what the Fed is focused on, is to see slack in the labour market. That probably means an unemployment rate above 6%. We are far from that level.

The Fed also needs to see home prices decline 20% or more. Yet despite price declines in the last few months, home prices were still up year over year at the end of October.

In other words, the market is too optimistic.

The rally is also explained by seasonal effect and oversold conditions. This rally, however, has been of poor quality, similar to what we saw in the summer of 2020. Unprofitable companies with weak balance sheets have been the best performers.

We knew that we might trail the market performance this fall and maybe even into early 2023. However, our portfolio is well-positioned for a more difficult environment in 2023, in which we will see much lower economic activity and possibly even a recession combined with higher interest rates.

Towards the end of the first quarter of 2023, we expect to see a rotation to higher-quality companies with little to no debt and the ability to gain market share.