According to research by the Bank of America, global risk assets have lost over $35T since November 21, 20211. This should come as no surprise as we are seeing: the co-dependency of Wall Street and the Fed, stop-go economic policies, zero COVID policy in China, headline inflation, political instability, war, oil and food shocks, fiscal excess, and industrial unrest.

Given all this volatility, recession is a common topic of conversation among investors and companies. The general consensus? Avoid small cap stocks and stick to the so-called safer large cap companies.

In today’s weekly, we’re busting this myth by explaining why small cap is back and why exposure to this asset class is your best bet during a recession. We’ll begin with a brief trip down memory lane.

1970s – Small caps shine amid economic volatility

Investors assume that for small cap to outperform, we need economic certainty, lower rates and better credit conditions. But history proves otherwise. The 1970s were one of the best decades for small cap, and yet this era was plagued with a wide variety of economic volatility.

Throughout the 70s, inflation averaged 7.1% with a high of 13.3%. Fed rates peaked at 14% in 1979 from 3.5% in 1971. The economy faced oil shocks, embargoes, and taxes were high. Real economic growth was below the previous decade by 1%, and productivity was even lower. Meanwhile, President Richard Nixon became the first U.S. president to resign, and the dollar abandoned the gold standard and devalued.

Incredibly, in the midst of all this uncertainty, small cap outperformed large. Why?
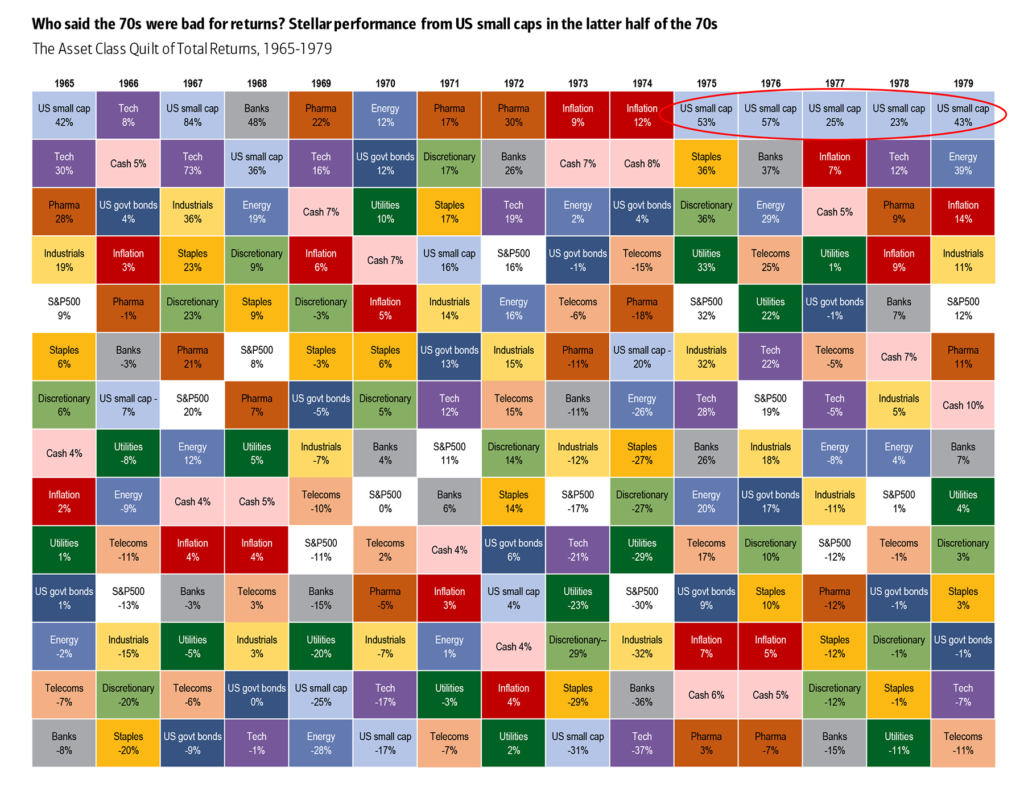
Table showing stellar performance from US small cap in the latter half of the 70's.
Source: BofA Global Investment Strategy, Bloomberg

Why small cap succeeds during unexpected inflation

What really helped small cap outperform during the 70s was the unexpected inflation. According to Aswath Damodaran, a finance professor at NYU Stern, there are two reasons why unexpected inflation benefits small cap companies.

  1. Nimbleness in price adjustments – Large cap stocks, with their layers of management, have very entrenched pricing models. On the contrary, small cap can quickly change pricing structures to reflect the new inflationary environment. Hence, small cap reports much better margins.
  2. Less long-term investment projects – Large cap generally undertakes investment projects, which can have a 10 to 30-year timeline. They need to think much longer term just to maintain their growth rates. The problem is during high inflationary and interest rate environments, the Net Present Values for the projects drop drastically as cost and revenue inputs change. By contrast, small cap companies are in growth ramp-up mode and have a long runway for potential expansion.

Why is now the time to buy small cap?

With inflation at 8.3%, the probability of a recession in the U.S. is almost certain. Earning season is already indicating lower earnings growth, especially for large caps.

Meanwhile, central banks are raising rates across the globe. It goes without saying, we are in a very uncertain economic environment.  So let’s break down the top seven reasons to invest in small cap right now.

1. A history of long-term outperformance – small cap stocks have consistently outperformed large cap over the long term by a considerable amount.
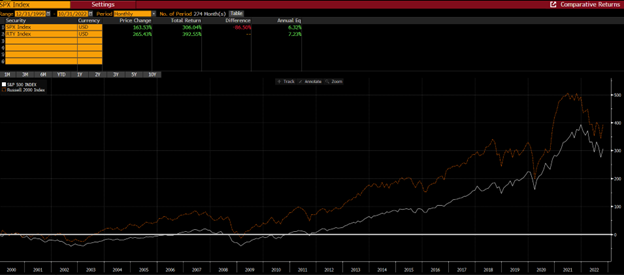
Source: Bloomberg

2. Unexpected inflationary environment – The data shows that small cap consistently outperforms large cap during unexpected periods of inflation.

3. Valuation – Perhaps most compellingly, small cap is very cheap compared to large cap stocks. The below chart shows that the relative P/E of the S&P 600 (which excludes negative P/E stocks) versus the S&P 500 is the lowest since at least 1992.
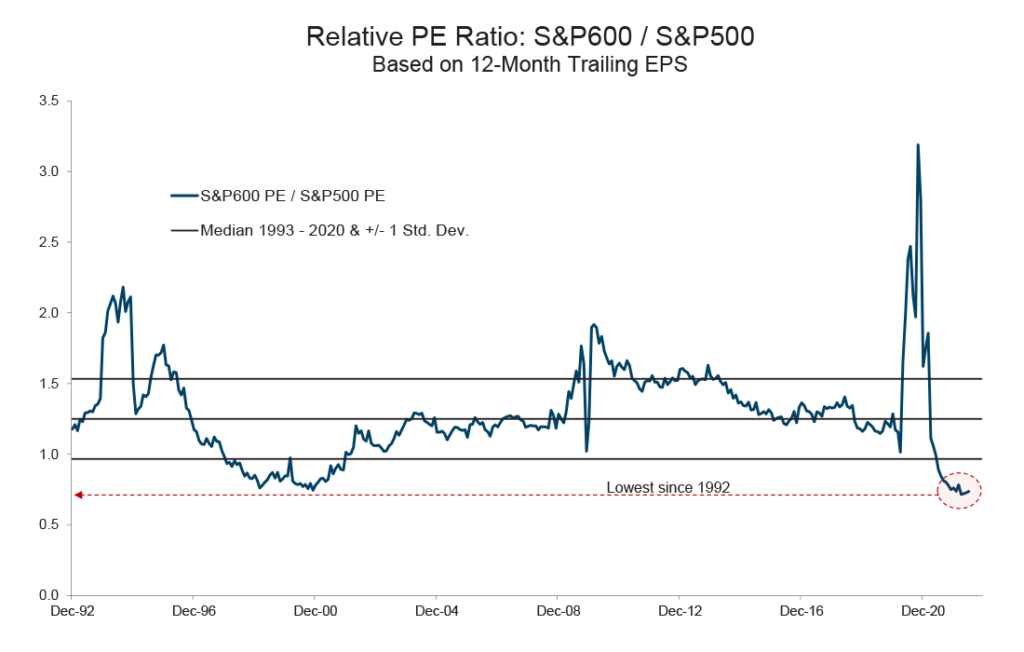
Chart showing Relative PE Ratio: S&P 600 / S&P 500 based on 12-month trailing EPS
Source: Bloomberg, William Blair Equity Research

The story is similar if we look at the Russell 2000. The last time it traded at this depressed relative multiple to the S&P 500 was during the dot-com bubble burst. From 10/9/2002 to 10/9/2007, Russell 2000 outperformed the S&P 500 by more than 50%.
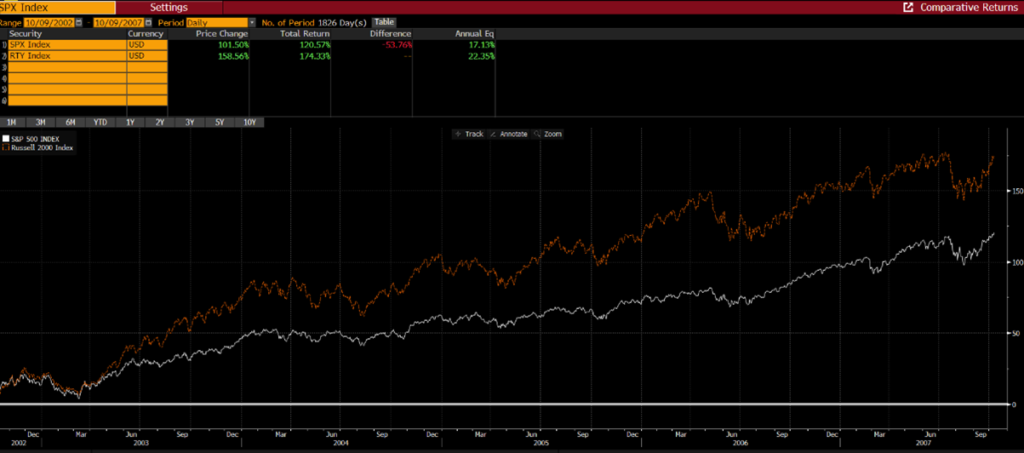
Source: Bloomberg

4. Small cap does well from early in the recession – While we do not know exactly when a recession will begin, it certainly feels like we’re getting close. So, getting exposure to small cap now would be a great idea for long-term investors. Small cap stocks have outperformed large cap in each of the previous six recessions that we have data for, going back to 1980.
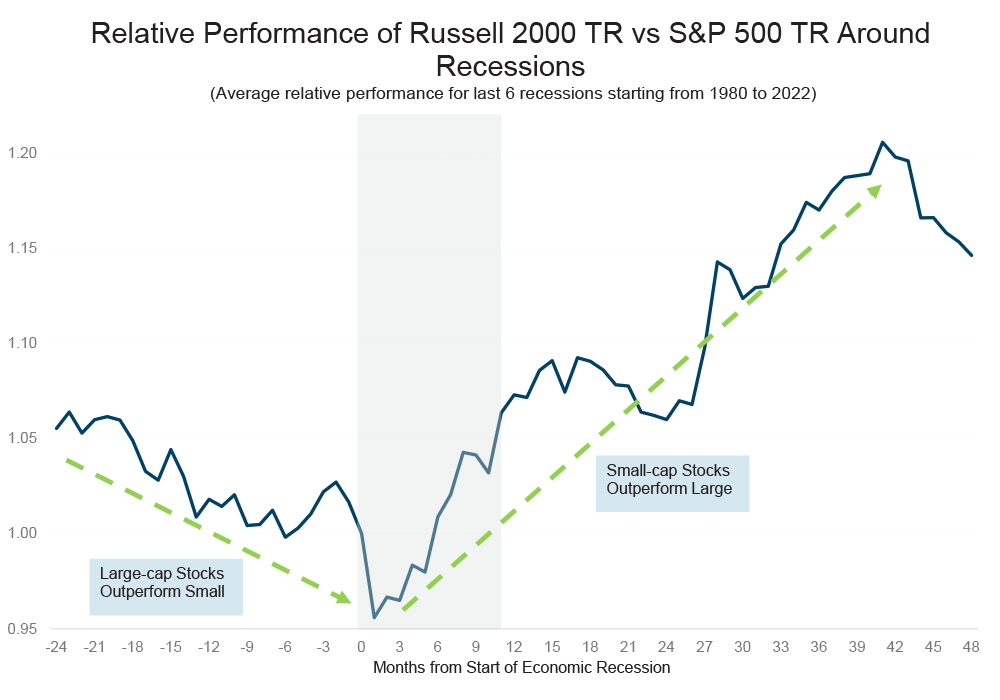
Chart showing relative performance of Russell 2000 TR vs S&P 500 TR around recessions.
Source: Bloomberg, William Blair Equity Research

5. Low exposure – The percentage of small cap in the U.S. equity market now stands below 4%, a level last seen at the COVID bottom. Prior to this point, we must go back to the 1930s to see such little exposure to small cap. As investors will increase their allocation to the asset class, patient investors will be rewarded.
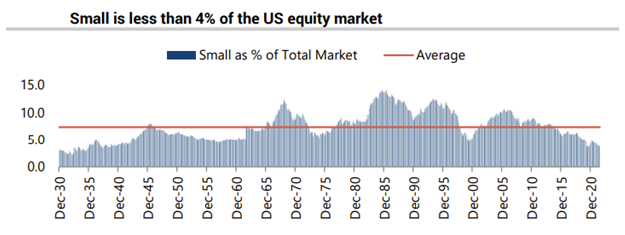
Source: Center for Research in Security Prices (CRSP®), The University of Chicago Booth School of Business; Jeffries

6. M&A is another consistent tailwind for small cap – Small cap represents approximately 95% of all deal volumes globally. The average acquisition premium is in the range of 35-40%.

7. Undercovered – Small cap is far less researched than large cap. Globally, small cap is covered on average by three brokers, versus 16 that cover the average large cap. There are hundreds of small caps in any region still not covered by a single broker. This provides bigger alpha opportunities for investors.

Final thoughts

When it comes to small cap outperforming large cap during recessions, we see the same trends play out across the globe. For example, valuations in Europe have dropped to levels last seen during the Global Financial Crisis (GFC).

So, now is the time to increase exposure to small cap, as most investors are underweight in this asset class. At Global Alpha, we are patient long-term investors who should benefit as small caps return to their historical outperformance and take a market leadership position.

1BoA Securities Global Research: The Flow Show – The Next Big Thing is Small, November 3, 2022
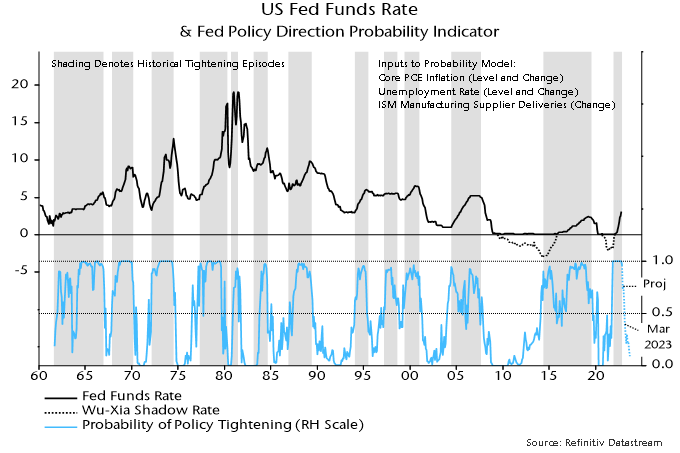
A simple model of the Fed’s past behaviour suggests a shift in policy direction from tightening to easing in March 2023, assuming that the economy evolves in line with its forecasts.

The Fed could delay cutting rates for several months but the model suggests a strong likelihood of action by Q3.

The model is based on the following observations / judgements about the Fed’s historical behaviour:

  • Policy direction alternates between tightening and easing and is rarely “on hold” for long.
  • Fed officials aren’t guided by a “target” level of rates; rather, they continue to tighten or ease until incoming data prompt them to stop / reverse.
  • The Fed places little weight on forecasts, focusing instead on recent trends in variables related to its mandate objectives.

The aim of the model is to estimate the probability that the Fed will tighten or ease in a particular month based on data available at the time of the decision. It does not attempt to predict the size of any move (although extreme probability readings suggest larger moves).

The model assesses the relative probability of tightening versus easing – “on hold” is excluded by design. As noted, periods of stable policy have been infrequent and usually short-lived historically. (The long period of Fed funds stability in the 2010s is misleading because the Fed was easing / tightening via QE and other “unconventional” policies during this period, as reflected in movements in “shadow” rates.)

To estimate the model, history was divided into alternating unbroken episodes of tightening and easing. This division was made judgementally based on the timing of peaks and troughs in official or shadow rates. Shaded areas in the chart below denote tightening episodes.

A decision was made to limit the model inputs to a small number of “obvious” variables, rather than cherry pick from a large data set to achieve maximum fit. The model, nevertheless, performs adequately, with the probability estimates consistent with policy direction in 88% of months (i.e. above 50% in tightening months and below 50% in easing months).

Chart 1 showing US Fed Funds Rate & Fed Policy Direction Probability Indicator

The key inputs are the levels and rates of change of core PCE inflation and the unemployment rate. The rate of change of the ISM manufacturing supplier deliveries index – an indicator of production bottlenecks – was also found to be significant.

The model assessment was that there was a 96% probability of tightening in November. This estimate incorporated a September number for core PCE inflation and October readings for the unemployment rate and ISM supplier deliveries.

The median forecast of FOMC participants in September was for core PCE inflation to average 3.1% in Q4 2023, versus 5.1% in September 2022. The unemployment rate was forecast at 4.4% in Q4 2023 versus 3.7% in October 2022. The probability projections in the chart assume straight-line movements in the two variables from their latest levels to the Q4 2023 forecasts. Additionally, the ISM supplier deliveries index is assumed to be stable at its October 2022 level.

The forecast probability of tightening falls to 74% in December, suggestive of a smaller rate hike of 50 or even 25 bp next month.

The first FOMC meeting in 2023 is on 31 January-1 February. The forecast tightening probability is little changed from its December level in January but falls further in February and moves below 50% in March – the 40% reading implies a 60% likelihood that the Fed will by then have shifted to an easing bias.

The implied easing probability increases further after March, exceeding 90% in September, suggesting a strong likelihood that the Fed will be cutting rates by then.

Alternative assumptions can be examined. If the unemployment rate were to rise to 4.4% in Q2 rather than Q4, the easing probability would reach 90% three months earlier, in June.

An unlikely worst case scenario is that core inflation and the unemployment rate remain at current levels. Interestingly, even in this scenario the tightening probability falls below 50% in April, fluctuating around the 50% level over the remainder of the year. (This reflects a downward pull from the rate of change terms, which offsets continued upward pressure from levels of core inflation and unemployment.)

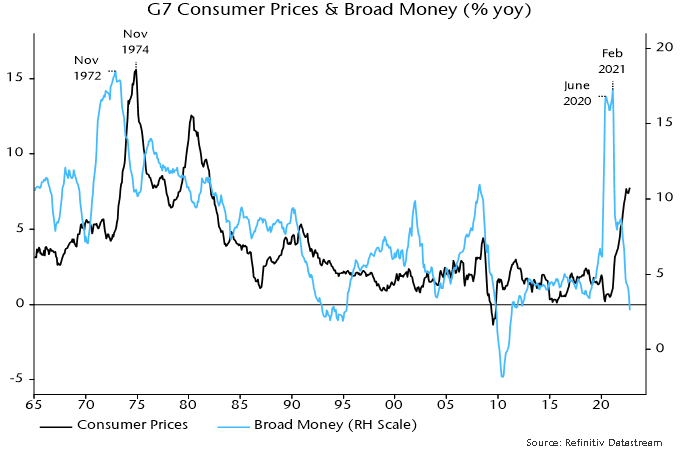
The “monetarist” rule of thumb that broad money growth leads inflation by two years suggests a rapid fall in G7 CPI inflation in 2023 and an undershoot of targets by H2 2024.

Annual growth of the G7 broad money measure calculated here is likely to have fallen below 3% in October, based on US and Japanese data. The money stock appears to have stagnated in the latest three months, with a contraction in the US offsetting weak growth elsewhere*.

The monetarist rule worked perfectly in the early 1970s, when a surge in annual money growth to a peak in November 1972 was followed by a spike in annual CPI inflation to a high exactly two years later – see chart 1.

Chart 1

Chart 1 showing G7 Consumer Prices and Broad Money (% yoy)

Inflation fell sharply from its 1974 peak, mirroring a big decline in money growth in 1973-74. The difference from now is that annual money growth bottomed above 10%, resulting in inflation stalling at a still-high level.

The money growth surge in 2020-21 was almost complete by June 2020 but a final peak was delayed until February 2021. Consistent with the two-year rule, CPI inflation spiked into June 2022, since moving sideways. It may or may not make a final peak but the rule suggests that a major decline will be delayed until after February 2023.

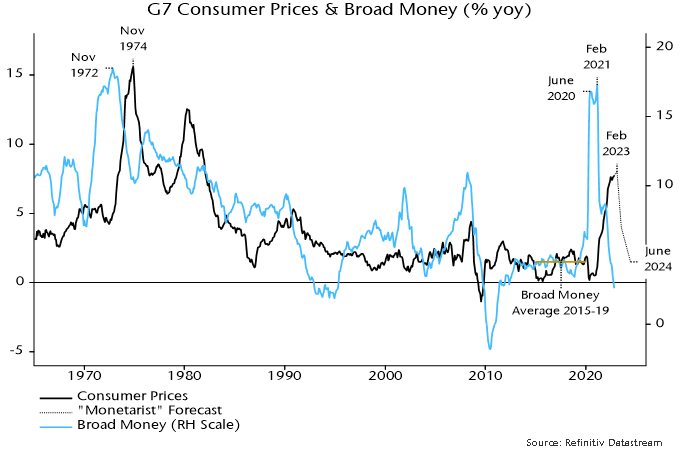
Broad money growth averaged 4.5% in the five years to end-2019. CPI inflation averaged 1.9% in the five years to end-2021 (i.e. allowing for the two-year lag). Money growth returned to the 2015-19 average in June 2022 (4.4%). The monetarist rule, therefore, suggests that inflation will be back below 2% by mid-2024 and will continue to move lower later in the year, reflecting the further decline in money growth since June.

How fast will inflation fall? A reasonable assumption is that its decline will mirror the rapid drop in money growth two years earlier, consistent with the 1970s experience. An illustrative projection is shown in chart 2. Inflation, currently at 7.8% (October estimate), falls to 4% in July 2023 and below 3% by December.

Chart 2

Chart 2 showing G7 Consumer Prices & Broad Money (% yoy) with “Monetarist” Forecast

Some monetarist economists expect inflation to be stickier in 2023. They argue that there is still a monetary “overhang” from the growth surge in 2020-21. Inflation, according to this view, will remain high into H2 2023 to “absorb” this excess. The impact of current monetary weakness will be delayed until 2024-25.

The assessment here is that the overhang is much reduced and its removal is consistent with the optimistic inflation projection shown in chart 2 as long as money trends remain as weak as currently, which is likely.

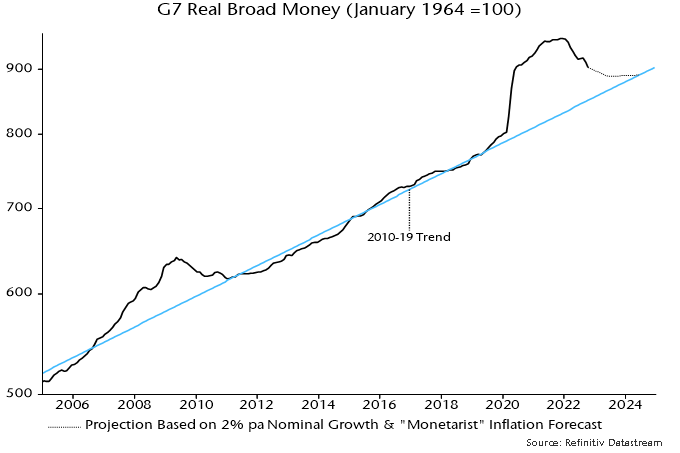
One measure of the monetary overhang is the deviation of the real broad money stock from its 2010-19 trend. This deviation peaked at 16% in May 2021 and has since narrowed to 6% as inflation has overtaken slowing nominal money growth – chart 3. 

Chart 3

Chart 3 showing G7 Real Broad Money where January 1964 = 100

The projection in chart 3 is based on the inflation profile in chart 2 and an assumption that broad money grows by 2% pa. The deviation of the real money stock from trend falls below 2% in H2 2023 and is eliminated by mid-2024.

Is the assumption of 2% money growth realistic? As noted, there has been no expansion in the latest three months.

As the chart shows, there was a larger deviation of real money from trend than currently at the end of the GFC in 2009. The adjustment back to trend was driven by nominal money weakness rather than high inflation – the money stock contracted by 1.9% between July 2009 and June 2010.

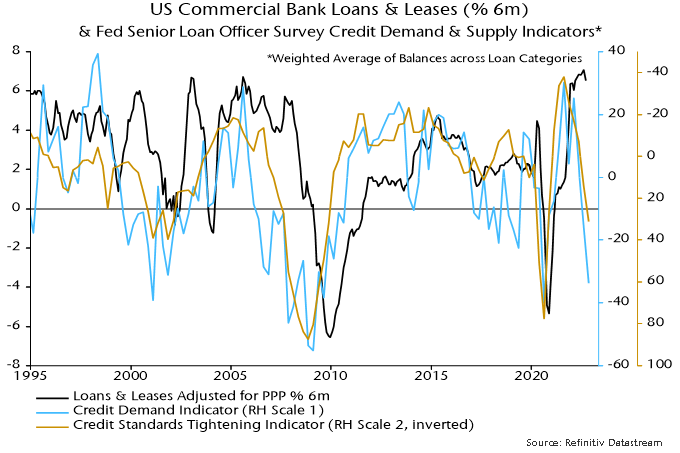
Bank lending has been supporting money growth but central bank loan officer surveys suggest a sharp slowdown ahead: October Fed survey results released this week echo weakness in earlier ECB and BoE surveys – chart 4.

Chart 4

Chart 4 showing US Commercial Bank Loans and Leases (% 6m) with Fed Senior Loan Officer Survey Credit Demand and Supply Indicators* *Weighted Average of Balances across Loan Categories

Continued monetary stagnation – or worse – would confirm that G7 central banks, with the honourable exception of the BoJ, have overtightened policies, compounding their 2020-21 policy error.

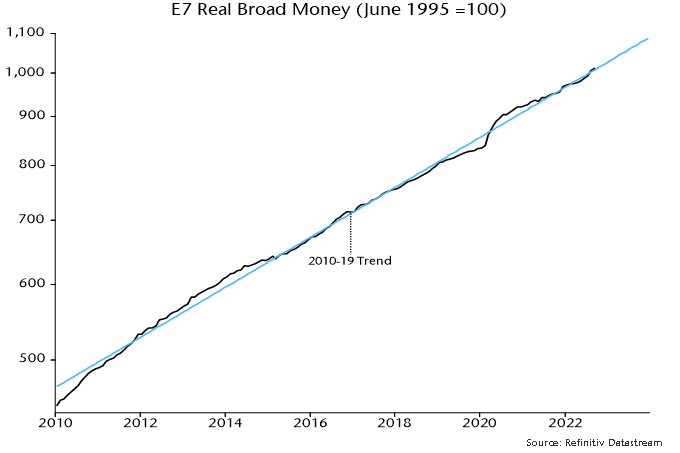
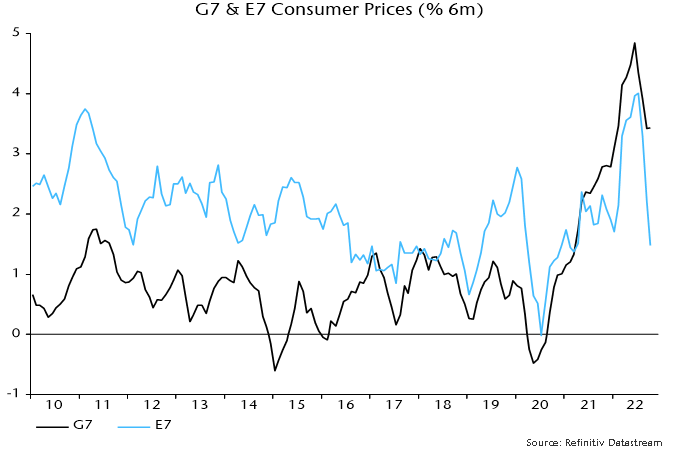
G7 monetary gyrations may be contrasted with relative stability around trend in E7** real broad money – chart 5. E7 central bank eased policies conventionally in 2020 and were quick to reverse course as economies rebounded and / or inflationary pressures emerged. This has been reflected in lower average inflation than in the G7 and a faster turnaround – chart 6.

Chart 5

Chart 5 showing E7 Real Broad Money where June 1995 = 100

Chart 6

Chart 6 showing G7 and E7 Consumer Prices (% 6m)

*Money measures used: US M2+ (M2 plus large time deposits and institutional money funds), Japan M3, Eurozone non-financial M3, UK non-financial M4, Canada expanded M2+ (M2+ plus non-personal time deposits).

**E7 defined here as BRIC plus Korea, Mexico and Taiwan.

Financial district of London and the Tower Bridge.

The UK has been going through an unprecedented time. From the death of the Queen, to three prime ministers in a little over two months, what the country needs now more than ever is stability and unity from both the new monarch and incumbent governing party.

A disastrous 44 days as prime minister by Liz Truss led to tremendous turmoil in the gilt and sterling markets. The pound hit a record low against the US dollar towards the end of September, forcing the Bank of England to step in and stabilize markets.

New Prime Minister Rishi Sunak has an unenviable task ahead of him. While being the sole candidate to achieve enough support from MPs to stand for the Prime Minister position prevented further infighting within the Conservative Party, the fact remains that there are still factions and loyalties pitted against each other. With this as a backdrop, it is even more difficult to regain the confidence of voters ahead of the next general election. Latest opinion polls show the Conservative Party facing a 26-point deficit.

Perhaps the most difficult task of all will be to reassure investors and increase credibility concerning public finances. Initial reactions to Sunak’s appointment were positive due to some goodwill built up through his handling of COVID and furlough schemes as Chancellor, a reputation for being fiscally conservative and the belief that he and the current Chancellor, Jeremy Hunt, are both singing from the same hymn sheet. Contrary to his predecessor, Sunak has already stressed the importance of government policy working hand in hand with the central bank to combat inflation, while emphasizing the independence of the Bank of England over interest rate decisions.

The next financial statement, due on November 17, will go a long way to re-establishing some credibility. Difficult, but necessary decisions on increased taxes and spending cuts are to be expected. Even freezing income tax thresholds will see more people enter the income tax system, or into a higher tax band, due to the wage inflation currently being experienced. Only one area has been designated as off limits for cuts – the National Health Service. Other areas such as welfare, education and­—perhaps controversially given the current geopolitical environment, defense—could be in the firing lines, as well as reviewing the HS2 rail project.

Fiscal responsibility is at odds with regaining the favour of the voting public. Just this week the Bank of England hiked interest rates by 75 basis points to 3%, the largest hike since 1989, and said that the UK is potentially facing its longest ever recession. Unemployment is expected to almost double, albeit from its lowest level in 50 years.

The instability surrounding the UK government and future economic prospects means investors want a discount on UK equities to compensate for current additional risk and uncertainty. However, based on the forward price-to-earnings ratio, the UK is at its lowest valuation versus global peers since records began. The attractive valuations combined with weak sterling and/or strong dollar leads us to believe that there is a significant opportunity for international and more specifically U.S. corporates or financial institutions to increase takeover activity. Longtime holding, Clipper Logistics (CLG.LN), was acquired by U.S. peer GXO Logistics (GXO.US) earlier this year. Current holding, Biffa (BIFF.LN) is being acquired by a private equity firm, with the transaction expected to close by the end of Q1 2023 at the latest.

The larger question is if there remains compelling reasons to own UK equities right now given the warning of a deeper recession than other regions. We would argue that this is a good environment for bottom-up fundamental stock pickers. Some quality international companies are now available at a significant discount. The FTSE 100 derives around 70% of its revenues internationally, while the FTSE 250 is at 50%.

When looking at our holdings in the UK, we have a diverse mix of companies, many of which have diversified their source of revenues away from just the UK. Often the market leaders can capitalize in economic downturns and increase market share while competitors struggle. This could also be the case for our holdings, briefly summarized below.

Our UK holdings with significant overseas revenues include:

Coats Group (COA.LN) is the world’s leading industrial thread manufacturer with market-leading position in apparel and footwear, plus a leading and growing position in performance materials. The company derives the overwhelming majority of its revenues from Asia and the Americas.

IWG Pls (IWG.LN) is the world’s largest provider of hybrid workspace with a network of 3,323 locations across 120 countries. The UK accounted for 16% of group revenues in 2021.

Oxford Biomedica (OXB.LN) is a leading cell and gene therapy group and does not disclose the geographical segmentation of revenues.

Safestore (SAFE.LN) is the UK’s largest self-storage group with 130 stores located in the UK and 48 stores located in Europe, mostly in Paris but with locations in the Netherlands and a growing presence in Spain. Around 25% of revenues come from overseas.

Savills (SVS.LN) is one of the leading real estate advisors in the world with 57% of revenues coming from outside the UK.

Our UK holdings with largely domestic revenues include:

Biffa (BIFF.LN) is a UK-based waste management company whose operations include collection, recycling, treatment, disposal and energy generation. As mentioned above, the company is in the process of being acquired.

CVS Group (CVSG.LN) is one of the largest integrated veterinary services providers in the UK (plus a small presence in the Netherlands and Republic of Ireland). The firm has four main business areas: veterinary practices; diagnostic laboratories; pet crematoria; and e-commerce (non-prescription medicines, pet foods and pet care products).

Onesavings Bank (OSB.LN) is a UK specialist lender which targets market sub-sectors that are underserved by the mainstream banks, most notably the professional landlord buy-to-let market.

Printed circuit board and chip.

In the past year or two, semiconductors have been under the spotlight across industries and countries, even in our everyday conversations. People around the world have started to realize just how much this small component affects their daily lives in significant ways, from long lead times in car purchasing, to being unable to get hold of a PS5 game console. Modern defense capabilities also rely on sophisticated electronics systems powered by advanced semiconductor components. No wonder semiconductors are considered the new oil, given their wide-spread consumer, military, and strategic significance.

However, the key difference is that chipmaking is even more concentrated geographically than oil production. The three biggest oil producing countries, the United States (U.S.), Russia, and Saudi Arabia, accounted for 15%, 13% and 12% respectively of global production in 2021. Taiwan, on the other hand, supplies 20-25% of the world’s semiconductors every year, while the U.S. only accounted for 12% in 2021. When it comes to leading-edge chips (10 nanometers and smaller), Taiwan has 92% of global production capacity. Meanwhile, China is expected to emerge as a leading player in chip manufacturing. The country plans to add about 40% of the global new capacity by 2030 and is expected to reach 24% of world’s total capacity by that same year, according to Semiconductor Industry Association. China’s potential leading position has raised concerns that it might threaten the economic advancement and national securities of other countries, especially the U.S.

In light of these threats, the U.S. government has been tightening regulations on chip exports to China. Last month, on October 7, the U.S. Department of Commerce announced reinforced regulations on cutting-edge semiconductor technology exports to China. Export controls to China already existed before this new round. So what’s new this time, and why has the market been so nervous about it? Well, this new set of restrictions have been broadened substantially. First, the expanded list of restricted exports to China now includes the most cutting-edge chips as well as chips that are one to two generations behind the cutting edge. In addition, the new rule restricts the ability of Americans to support the development or production of Integrated Circuits (ICs) at China-located semiconductor fabrication facilities without a license.

The cumulative effects of these restrictions could have major implications on the industry. For example, many scientists and engineers with U.S. citizenship or permanent residency work in the Chinese semiconductor industry, including several top executives in Chinese companies. The new controls will likely force them to choose between their U.S. citizenship or their jobs.

The new rules will affect Chinese companies the most. Without new supplies of equipment from the U.S., Chinese chipmakers could be unable to expand their production lines and wind up stuck with existing capacity for the time being. Even for existing capacity, they may not be able to get maintenance services from the U.S. suppliers, which could affect the quality of the products.

The global market for wafer fabrication equipment is also expected to be hurt by these regulations. According to Jefferies, total investment value by Chinese companies in this market in 2022 is projected to be US$18 billion. This makes China the largest investor in this global sector by far.[1] However, the impacts of these new regulations on chip exports might affect around US$5 billion of Chinese investments in wafer fabrication.

American companies could suffer as well. China is the largest market for the three biggest U.S. semiconductor equipment manufacturers, accounting for roughly 30% of the revenue at Applied Materials, Lam Research and KLA Corp. Applied Materials declared the new regulations will reduce its fourth quarter net sales by US$250–$550 million, and a similar impact is to be expected for the following quarters. Applied Materials’ 2021 annual sales, as a reference, was about US$23 billion. Similarly, Lam research also warns the U.S. ban could lead to sales loss of US$2–$2.5 billion in 2023 (their 2021 annual sales was about US$17 billion).

Japan also has a major presence in the semiconductor production equipment (SPE) industry. At present, Japanese companies are not subject to regulatory constraints if U.S.-made parts and software are 25% or less of their products. This may potentially give Japanese SPEs a boost versus their U.S. counterparts. However, a regulation-induced slowdown of investment by Chinese companies could eventually diminish overall orders with Japanese SPEs.

What is the potential impact of all this on our portfolio?

While we do not invest in semiconductor manufacturing companies directly, a few companies we invest in Japan do have semiconductor equipment manufacturers as their clients.

Horiba (6856 JP) is a Japan-based manufacturer of measurement equipment. We have introduced their automotive emission measurement business in previous commentaries. Horiba is also a leading supplier of mass flow controllers, with 60% global market share. Their measurement equipment is used to regulate gas and liquid flow rates and is a key component in the production of high-quality semiconductors. Over half of the segment revenue comes from their Japanese customers, but Lam Research and Applied Materials are also among their key customers. The revenue from its semiconductor segment is over 40% of total revenue, the demand for this segment has been strong, and the company has revised up its 2022 guidance as a result. Horiba will report its third quarter result on November 11 and is expected to comment on the impact of the new regulations.

Kurita Water (6370 JP) is a Japanese manufacturer of water treatment equipment and chemicals. There is a growing need in the water treatment industry for advanced, comprehensive solutions, especially in the semiconductor and electronics manufacturing industries. Kurita is the only company in the world that has businesses in both water treatment chemicals and facilities. The company is the leading manufacturer in the water treatment industry in Japan, and over the past several years, Kurita has expanded its presence in the U.S. and European markets. As the semiconductor makers and other U.S. high-tech companies are bringing production bases home, this will present Kurita with business opportunities. There are still many uncertainties on the magnitude of this new set of restrictions and its potential impact. We will provide updates in future communications as we gain more clarity.


[1] Masahiro Nakanomyo, “Impact of Stricter US regulations on Exports to China”, Jefferies, Oct 16, 2022

UK monetary statistics for September were heavily distorted by cash-raising by LDI funds to meet collateral requirements for derivative contracts. 

The headline M4ex broad money aggregate surged by £91 billion, equivalent to 2.7% after seasonal adjustment, between end-August and end-September. Money holdings of non-bank financial corporations* accounted for £71 billion of this increase. 

The long-standing practice here has been to focus on non-financial monetary aggregates, where available, because movements in financial sector money holdings can be erratic and usually have little bearing on near-term economic prospects. 

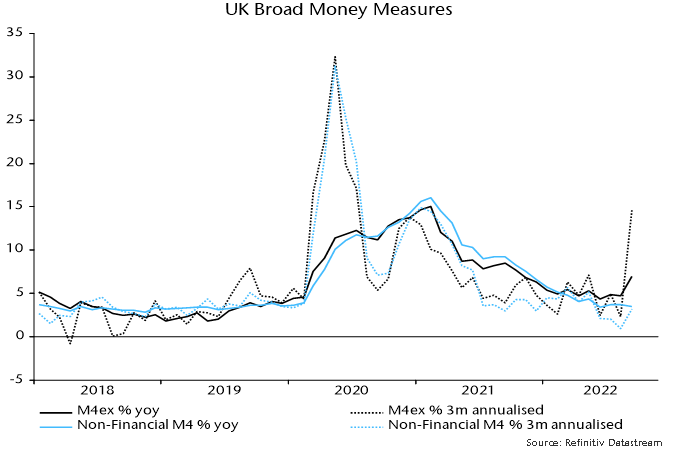
Non-financial M4, encompassing money holdings of households and private non-financial businesses, rose by £21 billion, or a seasonally adjusted 0.3%, in September. Annual growth eased to 3.5%, with the aggregate expanding at an annualised rate of 3.2% in the latest three months – see chart 1. 

Chart 1

Chart 1 showing UK Broad Money Measures

The Bank publishes an industrial breakdown of sterling deposits at commercial banks. The LDI cash-raising is reflected in large monthly increases in deposits of insurance companies, pension funds, fund managers and securities dealers (LDI funds posted margin to dealers, with the dealers placing the funds with banks). This group added a combined £39 billion to sterling deposits in September. 

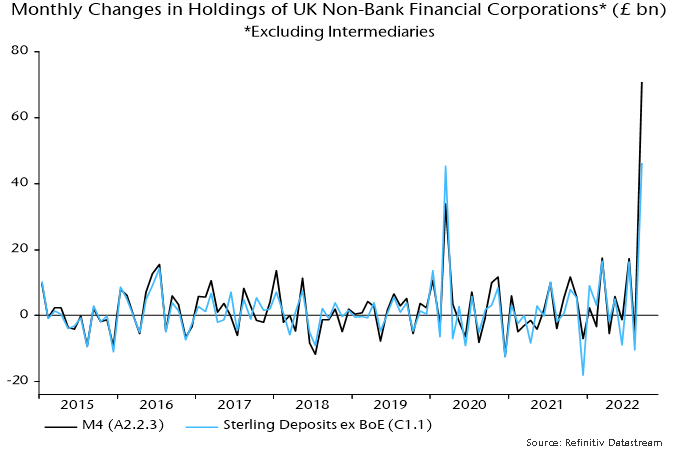
However, the rise in aggregate deposits of non-financial corporations, according to this table (C1.1), was £46 billion in September – far short of the £71 billion increase in their total M4 holdings (A2.2.3). This represents a record divergence – chart 2. 

Chart 2

Chart 2 showing Monthly Changes in Holdings of UK Non-Bank Financial Corporations* (£ bn) *Excluding Intermediaries

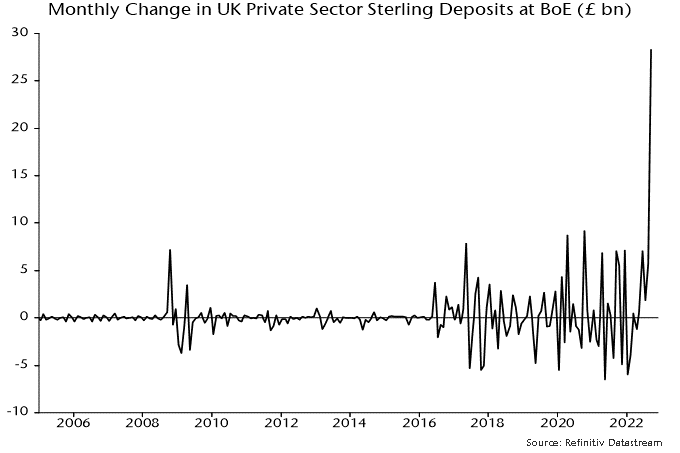
The “missing” funds show up on the Bank’s balance sheet: private sector sterling deposits held at the Bank jumped by £28 billion in September (B2.2.1), also a record movement – chart 3. 

Chart 3

Chart 3 showing Monthly Change in UK Private Sector Sterling Deposits at BoE (£ bn)

Securities dealers and clearing houses have accounts at the Bank, which they appear to have used to deposit a portion of the margin cash received from LDI funds. 

Note that this increase in deposits is not attributable to the Bank’s gilt-buying operation, which started on 28 September: the Bank’s holdings of public sector securities fell by £5 billion during September. 

Sterling cash-raising related to the LDI crisis may have totalled about £67 billion – the sum of the £39 billion increase in commercial bank deposits of insurance companies, pension funds, fund managers and dealers and the £28 billion placed at the Bank. 

LDI funds were also scrambling to raise foreign currency liquidity. The rise in foreign currency deposits of the same group of institutions rose by £25 billion in September. 

Not all the cash-raising represents sales of assets – LDI funds were also borrowing to meet margin requirements. Sterling bank lending to the same group rose by £16 billion in September, with foreign currency lending up by £18 billion. 

Was the Bank involved in facilitating the supply of liquidity to the funds, over and above its gilt-buying operation? It is unlikely to have played a direct role but banks may have borrowed from its discount window to onlend to LDI funds. 

This possibility is suggested by partial data on the Bank’s sterling liabilities and assets – it no longer publishes a full balance sheet on a timely basis. Identified sterling liabilities, including bank reserves and the sterling deposits referred to earlier, rose by £14 billion, while assets – including gilt holdings – fell by £6 billion. The implication is that unpublished items on the balance sheet resulted in the creation of £21 billion of identified sterling liabilities, with discount window lending a candidate explanation. 

*Excluding intermediaries such as central clearing counterparties.

Relatively speaking, the strategy’s returns for the quarter are respectable. While a single quarter of outperformance versus global and emerging market equities is by no means significant, there are observations that we deem significant in shaping the medium-term outlook for the strategy. Those are summarised below:

  • Investor positioning in frontier and emerging markets is light relative to mainstream emerging markets and developed equity markets. Given the non-core/off-benchmark nature of where we invest, outflows should generally have a less pronounced impact on performance.
  • The political risk premium in key portfolio countries has arguably declined in the last few months. Peaceful and orderly elections in the Philippines and Kenya resulted in business-friendly governments in both countries. Even in Kazakhstan, a country that experienced seismic political shifts earlier this year, there are reasons to be optimistic. President Tokayev continues to consolidate power domestically while masterfully navigating the country’s precarious foreign policy position by pivoting toward China and the West whilst maintaining deep-rooted historical ties with Russia. Tokayev’s call for a snap election reflects increased confidence in his ability to win and push through with policies that are on net positive for the economy
  • By process design, we invest in highly profitable businesses underpinned by sustainable competitive advantages and run by highly skilled and aligned managers. These characteristics are particularly valuable in the current market environment and are translating to market share gains for our companies at the expense of weakening competitors. Aligned ownership has and will continue to prove valuable in this environment. During the quarter, the CEO of a top ten portfolio company added to her already large stake through open market purchases. In October, another top ten portfolio company received a tender offer from its majority owners for part of the free float at over a 30% premium to the 30 day trading volume-weighted average price (VWAP).
  • In a rising rate environment, our portfolio companies experience a net positive carry as most hold more cash than debt. Where there is debt, it is mostly in local currency or otherwise matched with foreign currency income. Of the top ten companies in the portfolio (accounting for ~55% of assets), seven enjoy a net cash position
  • Our portfolio companies operate in sectors that are likely to outperform the general economy due to structural demand drivers underpinned by changing consumption habits and technological advancements. Nearly half the strategy’s assets are invested in consumer staples and information technology companies that we expect will prove more defensive in the next few quarters

The difficulty of investing in this environment is that visibility is particularly poor, and risks are apparent in every direction. Investors in such a market often exhibit paralysis or excessive risk aversion at a time when taking calculated risks can be very rewarding. We emphasise calculated because we believe there is a higher likelihood that markets will trade down rather than up in the next few months. Having experienced the global financial crisis, we understand how historical asset correlations can break down, markets can dislocate, and extreme volatility in one asset class or country can be a harbinger for significant volatility in other asset classes or countries. This is why we do not see the turmoil in British politics and the resulting gilt market volatility as isolated events but very much a result of a shift in global monetary and fiscal conditions that has a way to go. Of course, as Liz Truss has hopefully learned, reckless policy making will only exacerbate the negative impact of these shifts. That being said, we’ve made calculated additions to the portfolio and are well placed to take advantage of further volatility given the long term nature of the assets we manage and the dry powder we built up over the last 6 months.

An additional word on strategy is warranted in this environment: from a buy decision perspective, we are aware that valuations on certain high quality businesses on our watchlist have come down from “excessive” to “high” and that more than a few of those companies are still well-owned. We are making a conscious effort not to get tempted into those opportunities until we think the market has caught up with the economic realities and has adequately captured the meaningful earnings downgrades that are likely to come through in the next quarter.

It is also tempting to think that we are sitting on a portfolio of companies that is immune from further downside. However, our team is constantly looking for signals that we may have overstated our companies’ ability to generate cash flows (relative to the market’s expectations) or that there might be cracks appearing in the long-term thesis we’ve built when we invested in those businesses. This constant monitoring has and will continue to lead to downward position size adjustment and/or exits.  

We believe this environment is ripe for value creation through active engagement with management teams of portfolio companies and other like-minded shareholders in those companies. Our evolving sustainability framework and the research work we conduct in that area is proving to be extremely valuable in guiding our discussions with key stakeholders. We view our work on sustainability as an enabler for better investment decision making and have committed resources in that area to ensure we reinforce our investing edge. Finally, our values as an investment business should serve the strategy well in this environment. Focus, curiosity, humility, excellence, and alignment form the bedrock of our culture and drive our daily pursuit of differentiated value-added returns for our clients.

Vergent Asset Management LLP

Chinese money trends remain moderately favourable but the economy has been held back by covid disruption and now faces an export threat from global recession. Stocks, meanwhile, have been hit by a ramping up of the Biden administration’s war on Chinese tech along with President Xi’s take-over of economic policy-making, which investors have viewed as negative for longer-term growth prospects. “Excess” money has accumulated in the bond market and has the potential to flow into the economy and equities if the covid drag fades and policy-makers signal a continued commitment to private-led economic expansion. 

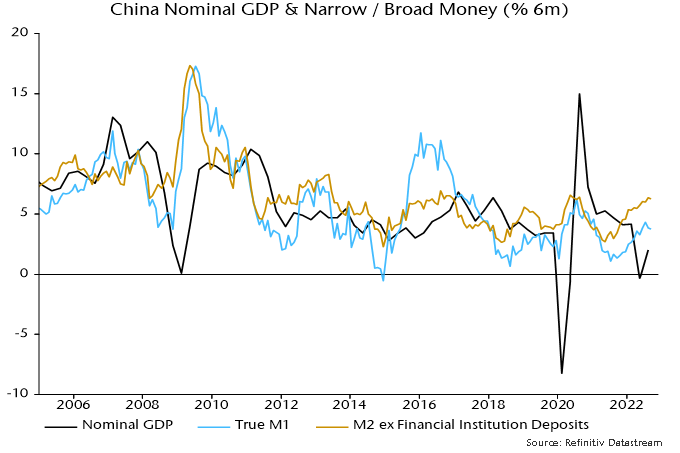
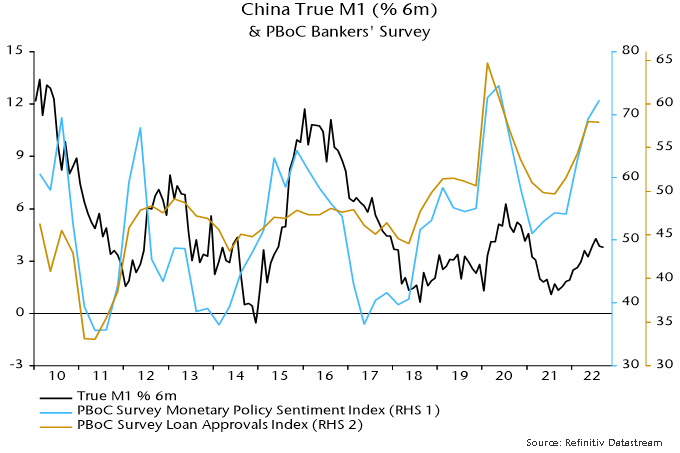
Six-month growth rates of nominal narrow and broad money have risen significantly over the past year, with the recovery reflected in a rebound in two-quarter nominal GDP expansion in Q3 despite further covid lockdowns – see chart 1. August / September numbers hint at a peak in money growth but continuing policy support, including directions to banks to expand lending, argues against a relapse – chart 2. 

Chart 1

Chart 1 showing China Nominal GDP & Narrow / Broad Money (% 6m)

Chart 2

Chart 2 showing China True M1 (% 6m) & PBoC Bankers’ Survey

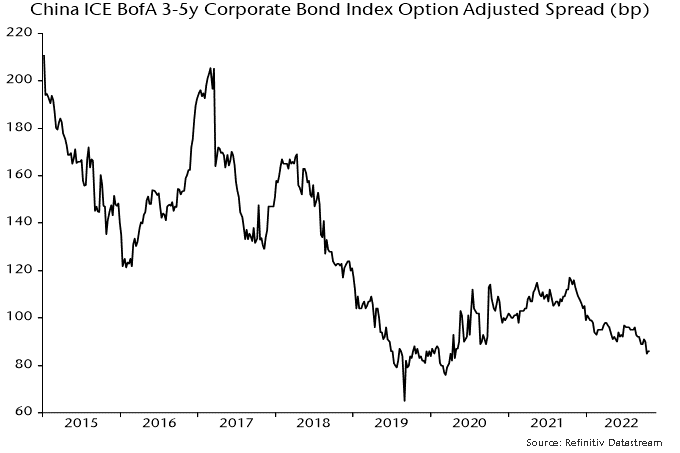
The faster growth of money than GDP, and of broad money relative to narrow, indicates that the transmission of monetary stimulus is incomplete and “excess” money is currently trapped in the financial system. The key reason for the impaired transmission, of course, is the zero covid policy. With economic activity suppressed, excess money has flowed into the bond market, reflected in a fall in government yields despite the global surge and a tightening of onshore credit spreads – chart 3. 

Chart 3

Chart 3 showing China ICE BofA 3-5y Corporate Bond Index Option Adjusted Spread (bp)

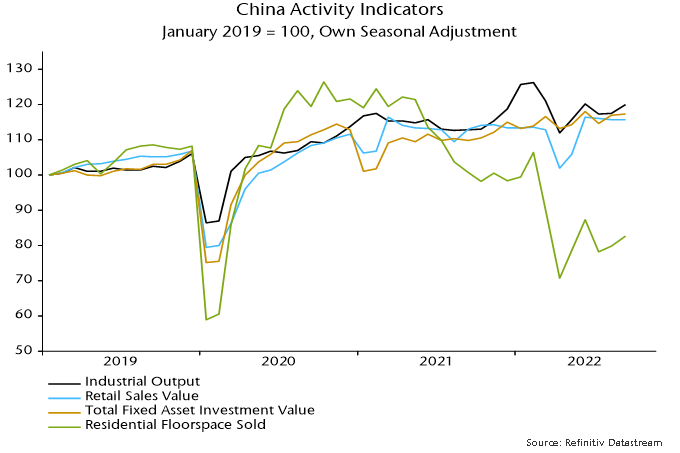
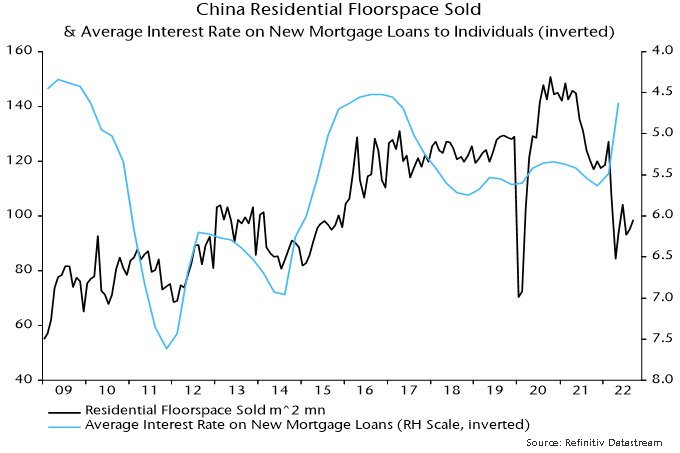
The economy, nevertheless, has been less weak than many feared, as confirmed by the Q3 GDP number and September monthly activity data, showing a pick-up in industrial output and a stabilisation of new home sales – chart 4. A H1 fall in the interest rate on new mortgages and other easing measures are supporting housing market activity, with secondary sales reportedly growing strongly – chart 5. 

Chart 4

Chart 4 showing China Activity Indicators January 2019 = 100, Own Seasonal Adjustment

Chart 5

Chart 5 showing China Residential Floorspace Sold & Average Interest Rate on New Mortgage Loans to Individuals (inverted)

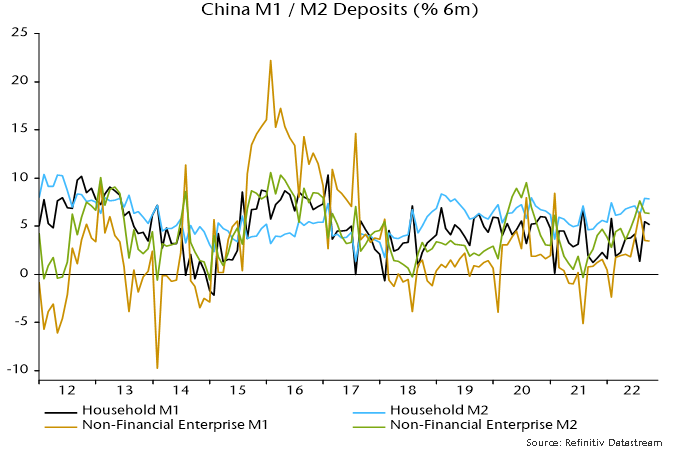
Retail sales remain weak but household money holdings are growing solidly, suggesting fire-power to lift spending if / when covid disruption eases – chart 6. 

Chart 6

Chart 6 showing China M1 / M2 Deposits (% 6m)

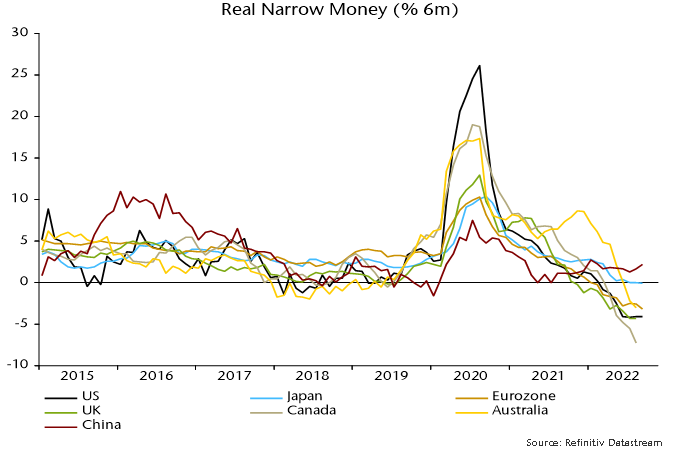
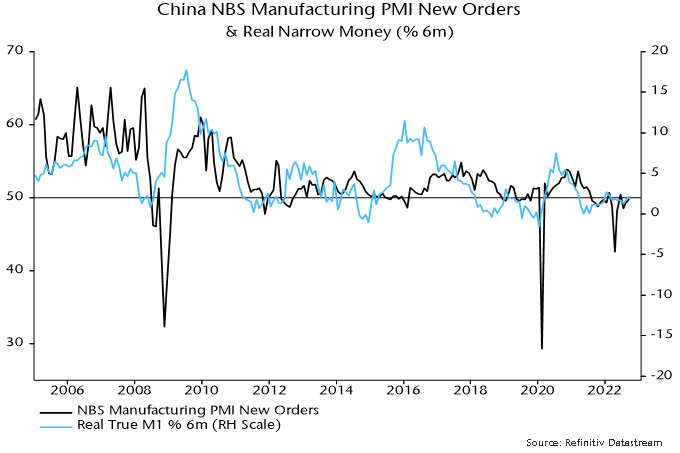
Six-month growth of Chinese real narrow money contrasts with contractions in most major economies – chart 7. The level of growth, however, is modest by historical standards, suggesting moderate economic expansion at best: current growth, for example, has been consistent with a manufacturing PMI new orders index of about 50 – chart 8. 

Chart 7

Chart 7 showing Real Narrow Money (% 6m)

Chart 8

Chart 8 showing China NBS Manufacturing PMI New Orders & Real Narrow Money (% 6m)

Export weakness due to global recession could drag the PMI lower, as occurred during the GFC. The Chinese reading, however, would be expected to hold up relative to global PMI new orders, which may be heading to 40. 

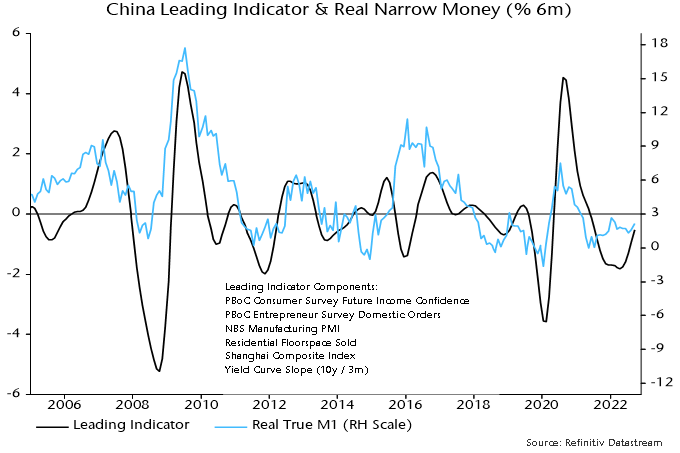
The moderately positive message for economic prospects from real money trends is supported by a recent recovery in a composite leading indicator calculated here, which attempts to mirror the components of the OECD’s US leading indicator – chart 9. 

Chart 9

Chart 9 showing China Leading Indicator & Real Narrow Money (% 6m)
Close-up of a pile of copper rods.

Recently, we have seen a pullback in commodity prices after the rally they experienced earlier in the summer. As many global economies are forecasted to enter recessionary environments, the demand trajectory for commodities remains uncertain. Over the longer time horizon, we believe some commodities will outperform others due to resilient demand, despite short term volatility. This week, we would like to highlight one metal that we are closely monitoring.

Following the general direction of metal prices this year, copper is down a little under 20% year to date, according to Bloomberg. The recent down trend in copper prices has mainly been attributed to the slowdown in Chinese demand. Economic doubts in the region and many other factors have been attributed to the disruption in the Chinese economy.

The troubles started this summer when the country suffered its worst heatwave in years. Being one of the regions most vulnerable to physical stress, the heatwave in China resulted in many energy generation sources going offline, causing widespread power shortages. Additionally, the country continues to keep tight COVID controls in place, with no end in sight for their zero-COVID policy. As cases spike in certain regions, they have not shied away from locking down affected areas. Finally, Xi Jinping’s political agenda to push greater state control at the expense of the private sector growth cast questions on what rate of GDP growth the country can actually achieve. 

With the rapid acceleration of the Chinese economy in the last decade, their demand for copper followed suit. The outsourcing trend accelerated in the 2000s further bolstered demand in the region. China currently accounts for 53% of the global copper demand, an increase from 38% in 2010. So, it is no surprise that downgrades in the speed of their economic development have caused a nervous sell off in the copper markets.

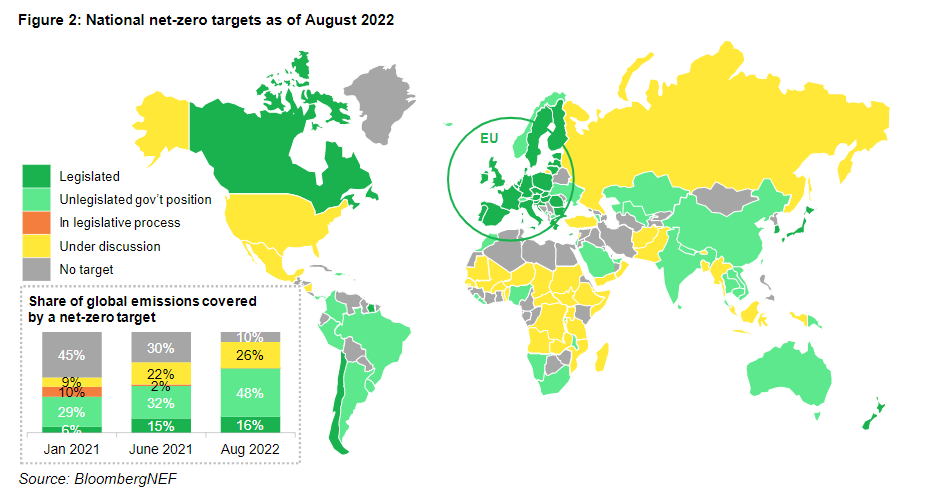
Traditionally, copper has been highly correlated to economic growth as it is an important material for construction, consumer durables, industrial equipment and ventilation and air conditioning. This type of demand for copper is called traditional demand. We are now seeing a more prominent demand driver for copper emerge, and it stems from the energy transition. Countries committing to net zero goals and setting strategies to achieve these ambitious targets will give copper demand an additional boost. Over 50% of countries around the world have net zero targets. Most are not yet legislated, but momentum is increasing as many feel the firsthand effects of climate change.

Map showing national net-zero targets as of August 2022.

Energy transition enabling technologies are highly reliant on copper. For instance, electric vehicles require three times as much copper as internal combustion engine cars. Additionally, with wind and solar becoming more widely adopted energy generation sources, transmission and distribution lines require an increasing amount of the metal as well. These transport and infrastructure needs will experience a 3.9% compounded annual growth rate between now and 2040, contributing to an overall copper demand growth of 53%.

The supply side, however, is expected to experience a squeeze. Mines have been seeing declining copper grades. Additionally, new mine commissioning takes up to ten years from initial phase to operation as environmental permits, financing and operations are all lengthy processes. Other sources of copper supply will be critical to meet the roughly 14 million tons shortage (BNEF). Solutions such as copper recycling and yield improvement technologies will play a key role.

Aurubis (NDA GR) 

We currently hold Aurubis in our portfolio, a world leading copper smelter and refiner. The company is also one of the largest copper recyclers in the world. As was the case with many European companies, they experienced rising energy costs as a result of the war in Ukraine, weighing on their performance. However, we strongly believe in the positive long-term trend for the industry. Aurubis is extremely well positioned to benefit from the energy transition. Their main smelter is one of the most efficient in the world and the company outperforms its peer group in terms of GHG emission intensity. Suppliers with better performance should benefit as more and more emphasis is put on managing Scope 3 emissions. Additionally, their recycling division is bound to thrive as regulations impose higher recycling rates and natural copper deposits continue to decline. 

We believe that given the strong demand, copper prices should find a floor and stabilize, experiencing a more favorable pricing environment than other metals.

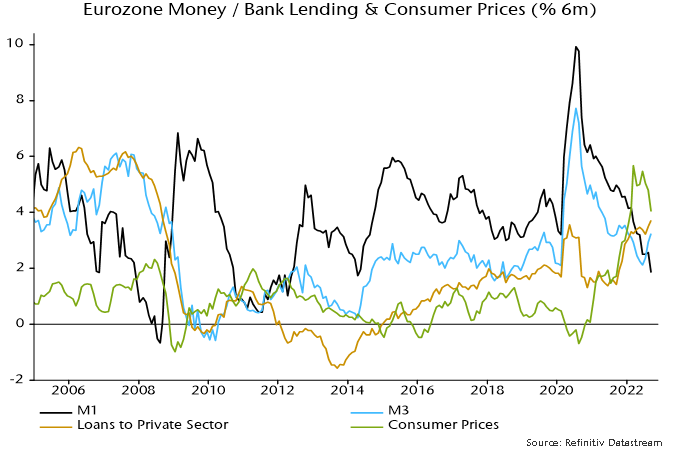
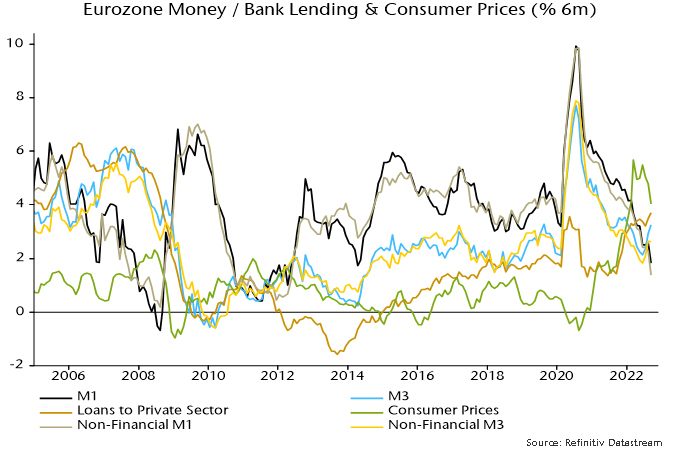
Eurozone money measures are giving mixed signals. Headline broad money M3 rose by a strong 0.7% in September, pushing six-month growth up to 3.3% (6.6% annualised), the highest since December. Narrow money M1, by contrast, contracted on the month, with six-month growth falling further to 1.8% (3.7% annualised) – see chart 1. 

Chart 1

Chart 1 showing Eurozone Money / Bank Lending & Consumer Prices (% 6m)

Broad money reacceleration, on the face of it, suggests an economic recovery towards mid-2023 after a sharp winter recession. The judgement here, however, is that broad money numbers have been boosted by technical / temporary factors and intensifying narrow money weakness is a better representation of current monetary conditions and economic prospects. 

The six-month rate of change of real M3, it should be emphasised, remains negative, with consumer prices (ECB seasonally adjusted series) rising by an annualised 8.2% between March and September. 

The sectoral breakdown of the headline M3 / M1 numbers, moreover, shows a significant recent contribution from rising money holdings of financial institutions. This probably reflects cash-raising related to weak markets and is not an expansionary / inflationary signal for the economy. 

The forecasting approach here focuses on non-financial money measures where available, i.e. encompassing holdings of households and non-financial firms only. Six-month growth of non-financial M3 was 2.6% in September versus 3.3% for M3 and has shown a smaller recent recovery – chart 2. 

Chart 2

Chart 2 showing Eurozone Money / Bank Lending & Consumer Prices (% 6m)

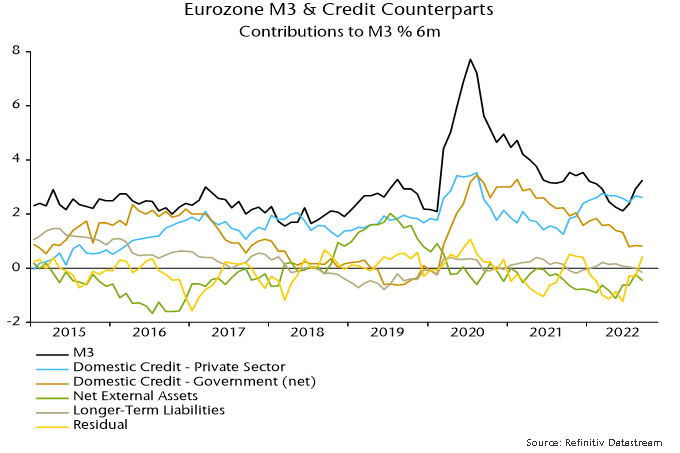
A further reason for playing down the broad money pick-up is that it is not explained by any of the conventional “credit counterparts” – credit to the private sector and government, net external assets and longer-term liabilities. The counterparts analysis shows a positive contribution from unspecified residual items, which behave erratically, suggesting a future reversal – chart 3. 

Chart 3

Chart 3 showing Eurozone M3 & Credit Counterparts Contributions to M3 % 6m

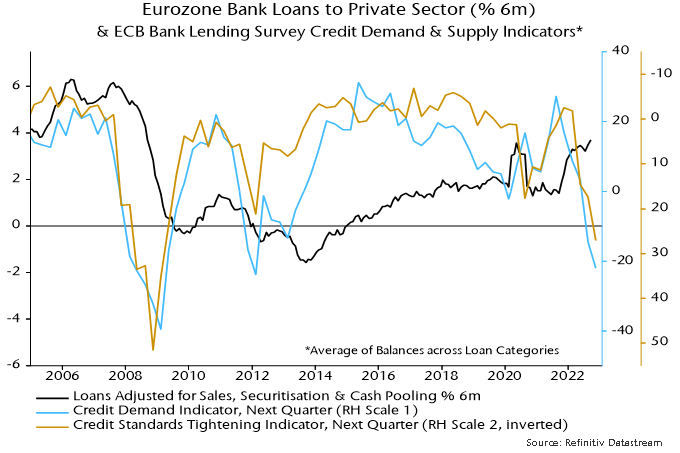
Solid growth of lending to the private sector has been the key driver of recent M3 expansion. The October bank lending survey, however, showed a further plunge in credit demand and supply balances, signalling a future lending slowdown or even contraction – chart 4. 

Chart 4

Chart 4 showing Eurozone Bank Loans to Private Sector (% 6m) & ECB Bank Lending Survey Credit Demand & Supply Indicators* *Average of Balances across Loan Categories

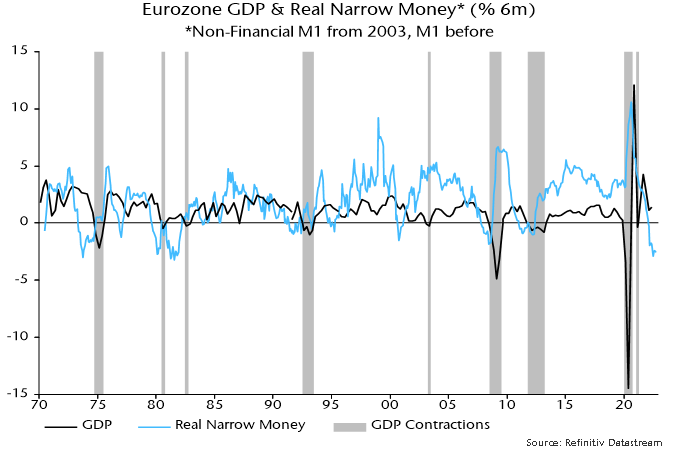
Statistical studies show that real non-financial M1 has the strongest leading indicator properties of the various money and lending measures. Its six-month rate of change remains at the bottom of the historical range, suggesting no economic recovery before H2 2023 – chart 5. 

Chart 5

Chart 5 showing Eurozone GDP & Real Narrow Money* (% 6m) *Non-Financial M1 from 2003, M1 before