One of the sustainability themes that we will be closely paying attention to in 2023 is company alignment to green CAPEX. In other words, capital expenditures (i.e., investments in physical assets such as buildings, equipment, and infrastructure) made with the intention of improving the environmental impact of a company’s operations. We believe this will be an important theme to watch on the back of the many positive regulatory changes in 2022, and those expected in 2023. In August 2022, for instance, the United States passed its Inflation Reduction Act (IRA), injecting close to $370 billion to support energy security and climate change programs. Many believe that Europe will follow suit in the coming months to help stave off a migration of Europe-based firms seeking to benefit from the American program. Ursula von der Leyen, President of the EU Commission, recently indicated that such plans are indeed in the works. Speaking last month at the World Economic Forum in Davos, she said the EU is looking at drafting a law similar to the IRA to support clean and green technologies across various value chains in Europe. This new law is said to be called the Net-Zero Industry Act. We will closely monitor these developments.
Green CAPEX
Green CAPEX can include investments in renewable energy sources, electrification, and other technologies or practices that help to reduce greenhouse gas emissions and improve resource efficiency. Green CAPEX is an important part of the energy transition as it enables organizations to invest in the infrastructure and technology needed to support the shift to cleaner and more resource-efficient operations. This also helps investors monitor the scale at which a company is committed to making these changes. Green CAPEX acts as a positive signal, as it shows that a company is ready to inject real capital and make the necessary financial moves to reach its goals beyond statements and empty claims.
There are many reasons and benefits why companies would want to make investments of this kind. These benefits are explored in more detail below:
Cost savings: Green CAPEX investments can help companies reduce costs associated with energy consumption, water usage, and waste management. For example, investments in energy efficiency can help reduce energy consumption, leading to lower energy costs.
Risk reduction: Green CAPEX investments can help companies mitigate risks associated with environmental regulations and carbon pricing. For example, investments in renewable energy can help companies avoid potential penalties for emissions violations.
Reputation enhancement: Companies making green CAPEX investments can improve their reputation with customers, investors, and other stakeholders. This can be particularly important for companies that operate in sectors that are highly dependent on public opinion, such as consumer goods and services.
Increased competitiveness: Green CAPEX investments can help firms gain a competitive advantage over companies that do not invest in environmentally friendly assets or technology and stay ahead of competitors as environmental regulations accelerate around the world. For example, the EU reached a provisional agreement on their carbon border adjustment mechanism which will be “taxing” all imports based on their carbon footprints. Companies working to reduce their carbon footprint will benefit from lower financial pressures compared to higher emitting peers.
Long-term benefits: Green CAPEX investments can help companies adapt to future environmental challenges, such as climate change and dwindling natural resources, by providing long-term solutions and avoiding stranded assets. It also increases their resilience to unforeseen circumstances.
Green CAPEX is relevant for most companies, but some will require more commitments than others. This is particularly true for the harder to abate sectors such as energy, transportation and materials. Firms in these sectors leverage green CAPEX investments to find less carbon-intensive ways to produce the same goods. They could also use new materials, or design products which are more resource efficient. In in other words, making more with less. They can then transition to decarbonization through technologies such as carbon capture and storage (CCS) or use alternative fuels such as hydrogen or ammonia. Finally, these firms can invest in breakthrough technologies that may not yet be at the commercial scale, thereby giving themselves – and those early-stage technologies – a boost.
From an investment perspective, we look at this theme through two lenses:
The first is by identifying companies that have aligned their CAPEX plans with their environmental goals.
Evaluating the extent to which they have capital committed can signal their level of potential improvement. Such a measure is still a fairly new concept and may not be reflected in the company’s valuation or appreciated by the market. However, finding traces of this kind of alignment can present interesting investment opportunities.
Secondly, we look for companies that enable others to embrace green CAPEX.
Finding companies that have those breakthrough technologies required to reach environmental goals will benefit. They will not only see an accelerated rate of investment, but they will also receive policy support as we saw in the U.S. As other countries and regions step up their own energy transition plans, we expect this theme to gain even more relevance going forward.
Sustainability Theme
One of the sustainability themes that we will be closely paying attention to in 2023 is company alignment to green CAPEX. In other words, capital expenditures (i.e., investments in physical assets such as buildings, equipment, and infrastructure) made with the intention of improving the environmental impact of a company’s operations. We believe this will be an important theme to watch on the back of the many positive regulatory changes in 2022, and those expected in 2023. In August 2022, for instance, the United States passed its Inflation Reduction Act (IRA), injecting close to $370 billion to support energy security and climate change programs. Many believe that Europe will follow suit in the coming months to help stave off a migration of Europe-based firms seeking to benefit from the American program. Ursula von der Leyen, President of the EU Commission, recently indicated that such plans are indeed in the works. Speaking last month at the World Economic Forum in Davos, she said the EU is looking at drafting a law similar to the IRA to support clean and green technologies across various value chains in Europe. This new law is said to be called the Net-Zero Industry Act. We will closely monitor these developments.
Green CAPEX
Green CAPEX can include investments in renewable energy sources, electrification, and other technologies or practices that help to reduce greenhouse gas emissions and improve resource efficiency. Green CAPEX is an important part of the energy transition as it enables organizations to invest in the infrastructure and technology needed to support the shift to cleaner and more resource-efficient operations. This also helps investors monitor the scale at which a company is committed to making these changes. Green CAPEX acts as a positive signal, as it shows that a company is ready to inject real capital and make the necessary financial moves to reach its goals beyond statements and empty claims.
There are many reasons and benefits why companies would want to make investments of this kind. These benefits are explored in more detail below:
Cost savings: Green CAPEX investments can help companies reduce costs associated with energy consumption, water usage, and waste management. For example, investments in energy efficiency can help reduce energy consumption, leading to lower energy costs.
Risk reduction: Green CAPEX investments can help companies mitigate risks associated with environmental regulations and carbon pricing. For example, investments in renewable energy can help companies avoid potential penalties for emissions violations.
Reputation enhancement: Companies making green CAPEX investments can improve their reputation with customers, investors, and other stakeholders. This can be particularly important for companies that operate in sectors that are highly dependent on public opinion, such as consumer goods and services.
Increased competitiveness: Green CAPEX investments can help firms gain a competitive advantage over companies that do not invest in environmentally friendly assets or technology and stay ahead of competitors as environmental regulations accelerate around the world. For example, the EU reached a provisional agreement on their carbon border adjustment mechanism which will be “taxing” all imports based on their carbon footprints. Companies working to reduce their carbon footprint will benefit from lower financial pressures compared to higher emitting peers.
Long-term benefits: Green CAPEX investments can help companies adapt to future environmental challenges, such as climate change and dwindling natural resources, by providing long-term solutions and avoiding stranded assets. It also increases their resilience to unforeseen circumstances.
Green CAPEX is relevant for most companies, but some will require more commitments than others. This is particularly true for the harder to abate sectors such as energy, transportation and materials. Firms in these sectors leverage green CAPEX investments to find less carbon-intensive ways to produce the same goods. They could also use new materials, or design products which are more resource efficient. In in other words, making more with less. They can then transition to decarbonization through technologies such as carbon capture and storage (CCS) or use alternative fuels such as hydrogen or ammonia. Finally, these firms can invest in breakthrough technologies that may not yet be at the commercial scale, thereby giving themselves – and those early-stage technologies – a boost.
From an investment perspective, we look at this theme through two lenses:
The first is by identifying companies that have aligned their CAPEX plans with their environmental goals.
Evaluating the extent to which they have capital committed can signal their level of potential improvement. Such a measure is still a fairly new concept and may not be reflected in the company’s valuation or appreciated by the market. However, finding traces of this kind of alignment can present interesting investment opportunities.
Secondly, we look for companies that enable others to embrace green CAPEX.
Finding companies that have those breakthrough technologies required to reach environmental goals will benefit. They will not only see an accelerated rate of investment, but they will also receive policy support as we saw in the U.S. As other countries and regions step up their own energy transition plans, we expect this theme to gain even more relevance going forward.
The consensus is gloomy about UK economic prospects but is it gloomy enough?
The current debate has echoes of mid-2008. Q2 2008 was the first quarter of the most severe post-war recession. The consensus that summer was that the economy would eke out growth with a limited rise in unemployment and no need for significant policy easing.
A recession is widely acknowledged / expected now but the majority view is that it will be shallow and short-lived, partly reflecting recent energy price relief. Labour market damage is projected to be modest and there is general approval of recent MPC policy tightening.
Monetary trends warned of worse-than-expected outcomes in 2008 and are giving an equally negative message now.
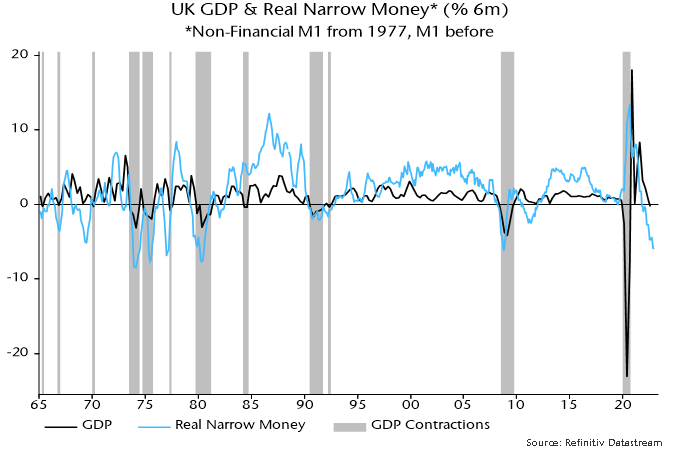
The six-month rate of contraction of real narrow money (i.e. non-financial M1 deflated by consumer prices) was unchanged at 5.9% (not annualised) in December, close to a 6.1% peak reached in October 2008 – see chart 1.
Chart 1
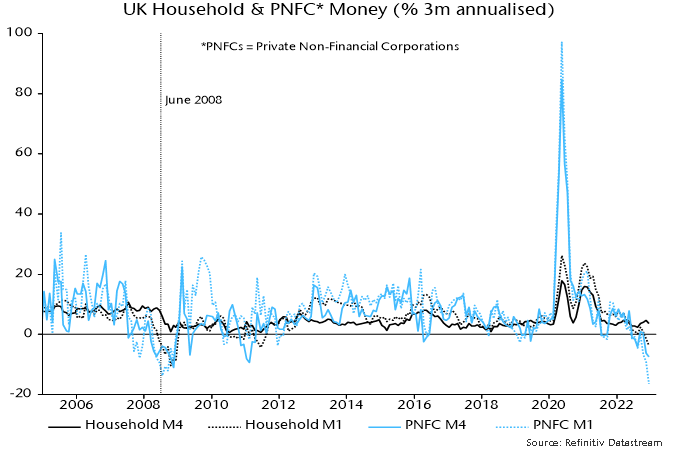
As in 2008, the real money squeeze reflects both high inflation and nominal money weakness. Sectoral nominal money trends are uncannily similar to mid-2008. Corporate M1 and M4 are contracting rapidly, consistent with a sharp fall in profits and suggesting cuts in employment and investment – chart 2.
Chart 2
Household M4 is still growing modestly but there has been a large-scale switch out of sight into time deposits in response to rising rates – a classic signal of a shift in consumer behaviour from spending to saving.
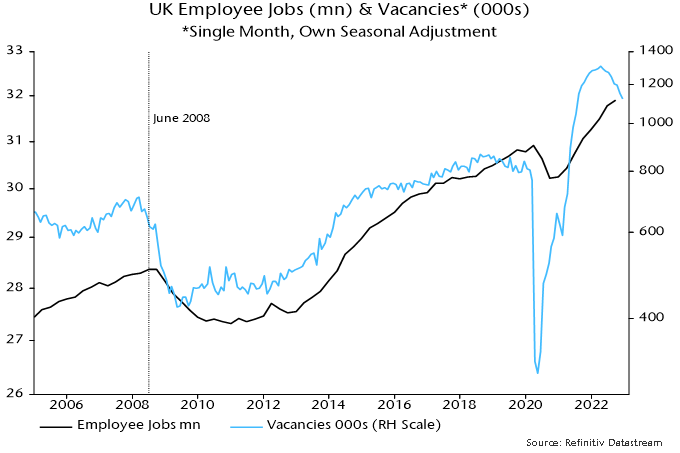
A continued rise in employee numbers in recent months has fed a narrative of labour market “resilience” that is expected to persist. Data and complacency were similar in mid-2008. The quarterly employee jobs series rose into Q3 2008 but the stock of vacancies in June was already down by 9% from its peak, warning of trouble ahead – chart 3. The level of vacancies is higher now but the fall from the peak has been larger, at 14%.
Chart 3
Eurozone flash PMIs this week were less bad than expected, bolstering a growing consensus that economic prospects are improving. Monetary trends continue to argue the opposite.
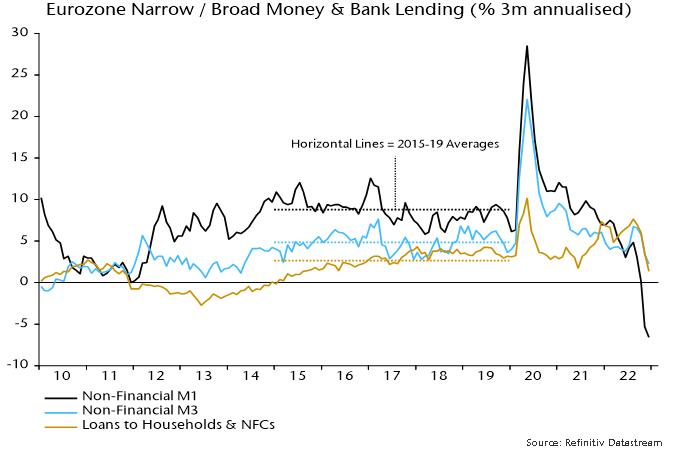
The preferred narrow money measure here – non-financial M1 – fell for a fourth consecutive month in December in nominal terms. Bank lending also contracted on the month, while the broad non-financial M3 measure grew by just 0.1%.
The three-month rate of contraction in narrow money is a record in data back to 1970. Three-month growth of non-financial M3 is down to 2.3% annualised, less than half its 2015-19 average. Bank loan growth is also now below its corresponding average – see chart 1.
Chart 1
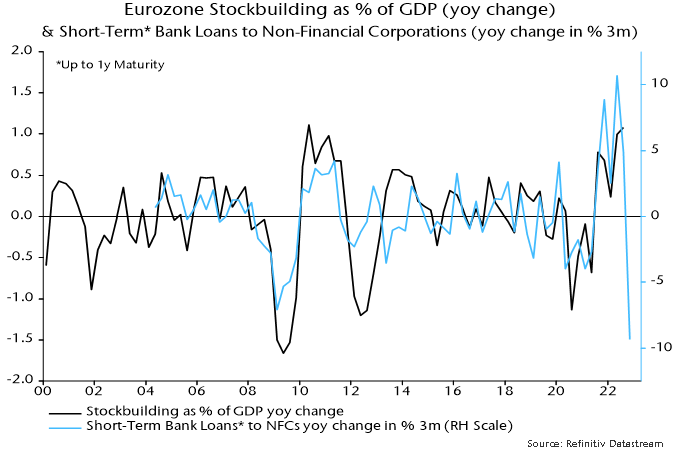
Bank lending weakness is being driven by repayment of short-term corporate loans, consistent with a violent downswing in the stockbuilding cycle – chart 2.
Chart 2
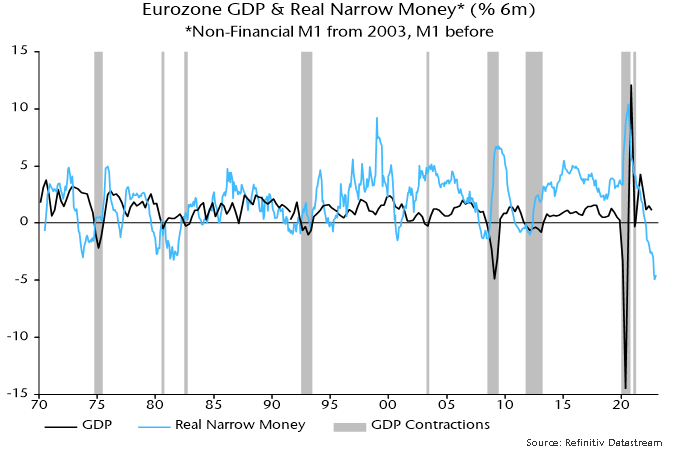
The six-month rate of decline of real narrow money was little changed from November’s record despite a sharp drop in six-month CPI momentum – chart 3.
Chart 3
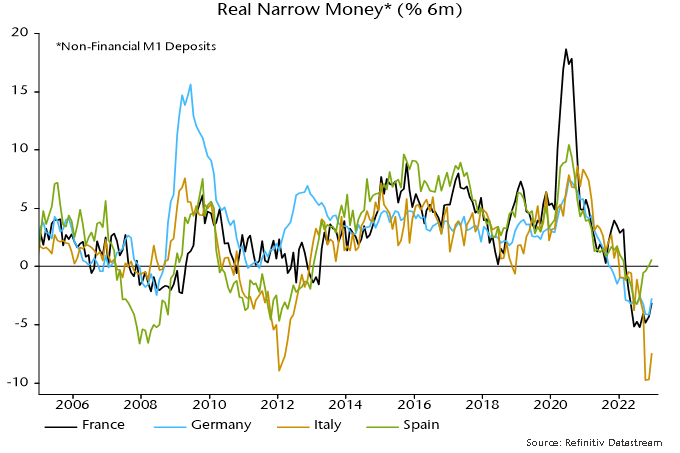
The rate of contraction of real M1 deposits remains fastest in Italy, reflecting both weaker nominal money trends and higher inflation. Spanish positive divergence is mainly due to a much sharper recent CPI slowdown.
Chart 4
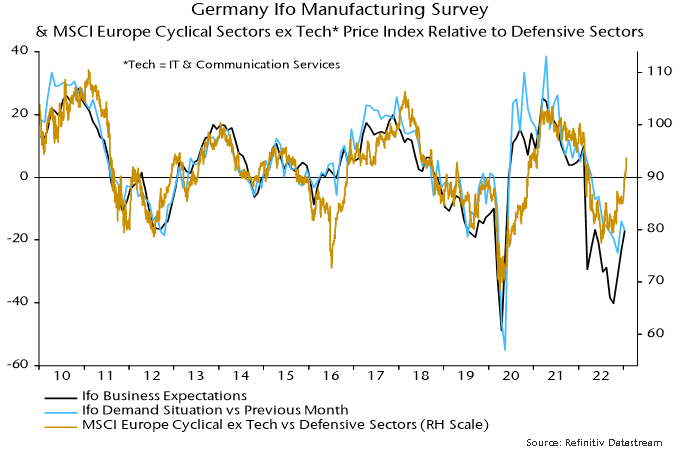
Echoing the better PMI news, German Ifo manufacturing expectations rose for a third month in January. The new demand index, however, has recovered by less and fell back this month – chart 5. European cyclical equity market sectors have outperformed on soft landing hopes and are vulnerable if business surveys now stall, as suggested by monetary trends.
Chart 5
A post in October gave a hopeful view of Chinese prospects, noting that “excess” money had accumulated and could flow into equities and the economy if policy-makers signalled a commitment to expansion.
The consensus is now optimistic, believing that property market support measures and the removal of pandemic control restrictions will result in strong economic acceleration through 2023. Yet the latest money / credit data signal caution.
Globally, Chinese reopening is expected to be reflationary. Reopening, however, will release supply as well as demand. The former effect could dominate, resulting in additional downward pressure on Chinese export prices.
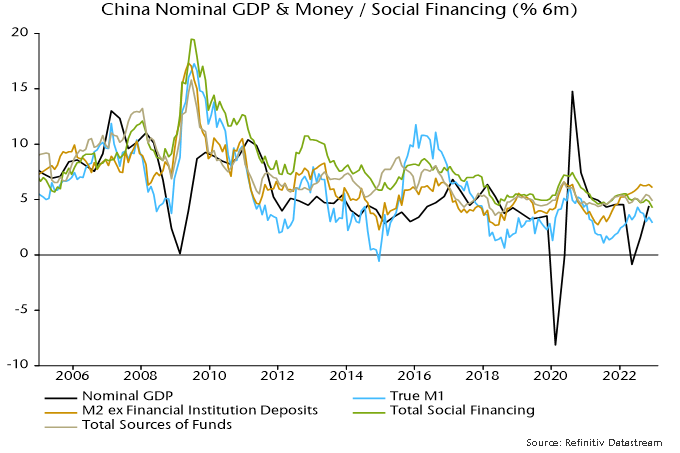
Six-month growth of true M1 peaked in July 2022, falling back to its March level in December – see chart 1. This suggests a slowing of underlying nominal GDP momentum from Q2. The levels of nominal and real narrow money growth are modest by historical standards.
Chart 1
Broad money trends are stronger, with six-month growth of the favoured measure here – M2 excluding deposits of non-bank financial institutions – ending 2022 near the top of its range in recent years. Money, however, needs to shift from time deposits into M1 to signal rising confidence and spending intentions.
Broad money growth may have been inflated by a switch out of wealth management products and other bank liabilities into deposits. The total stock of bank funding has been growing less strongly, with minimal acceleration since 2021 – chart 1.
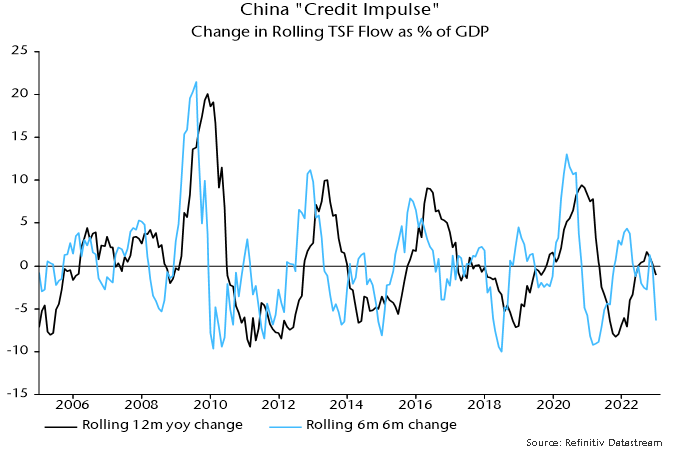
Many analysts follow the “credit impulse” – the rate of change of credit growth, usually expressed relative to GDP. This often gives the same message as narrow money trends (but is judged here to be less reliable) and also suggests a loss of economic momentum – chart 2.
Chart 2
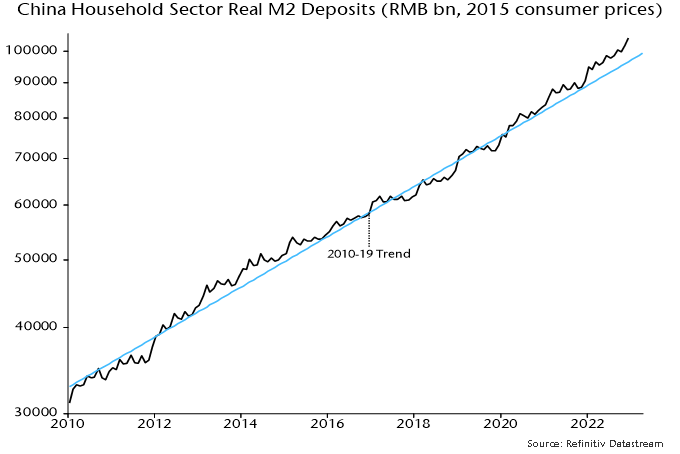
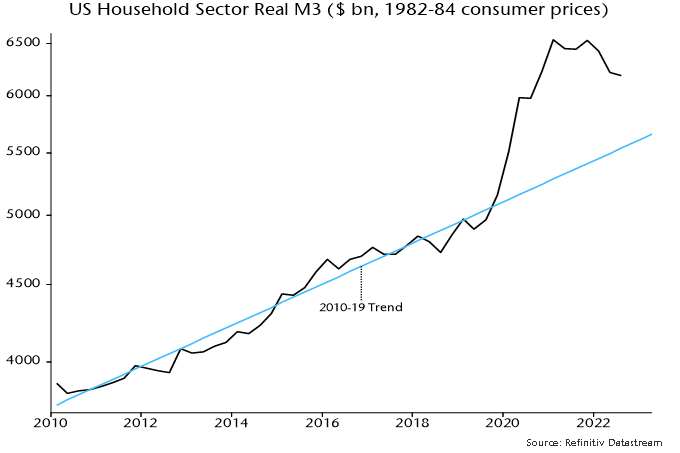
Bulls argue that excess household savings will fuel a consumption boom, drawing parallels with G7 experience following reopenings. Chinese households did not receive stimulus checks or direct wage support and the excess is likely to be considerably smaller, implying less pent-up demand.
Supporting this view, household real M2 deposits in December were 8% above their pre-pandemic trend (and may have been inflated by the early timing of the Chinese New Year) – chart 3. US household real M3 holdings reached a peak 24% overshoot of the comparable trend in March 2021 – chart 4.
Chart 3
Chart 4
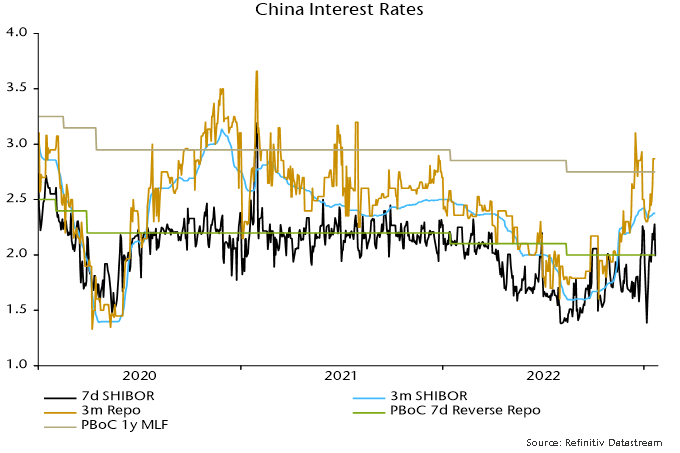
Fed policy remained expansionary as pandemic drags faded. The PBoC, by contrast, appears concerned about inflationary risks from rapid reopening and has engineered or at least tolerated a significant rise in term money rates. The increase in late 2022 was universally dismissed by China specialists as a year-end phenomenon unrelated to any policy shift but a minor fall in early January has since given way to another rise – chart 5.
Chart 5
The view here is that the reopening boost to domestic demand will be modest and biased towards services. For goods, supply expansion due to reduced disruption may outweigh the lift to demand.
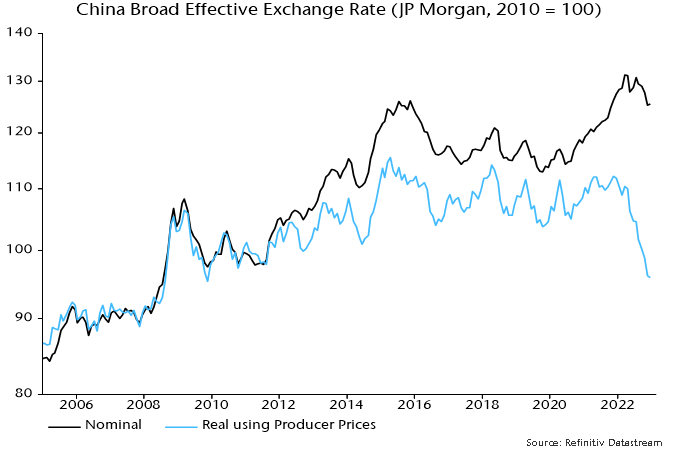
Global trade moved into contraction in late 2022, partly reflecting an accelerating downswing in the global stockbuilding cycle. With supply constraints easing, Chinese exporters are likely to cut prices to increase market share, especially given the super-competitive level of the RMB – chart 6.
Chart 6
The story of Little Red Riding Hood is perhaps the most implausible of all the pre-17th century European folk tales. Just how – a rational mind may presume – does a little girl mistake a ravenous wolf for her own grandmother? Like many such fables, the beauty in the Grimm brothers’ work lies in the extraction of rich metaphorical meaning from absurdity. Timeless lessons that have a habit, for those paying attention, of occasionally popping up in unexpected areas of our lives like a sagacious Whac-a-Mole. While Little Red Riding Hood is hardly a fulsome guide to investing, her ill-fated demise due to a case of mis-identity may still offer a lesson for investors.
As fundamental equity investors, it is critical that our decisions stem from objective reasoning. Spending each day striving to achieve the clarity of thought that comes with truly unbiased, matter-of-fact thinking, honed by experience and devoid of prejudice, is key not only to our long-term success but also in upholding the fiduciary duty to our clients.
It is why our philosophy centres on two simple ideas: invest with conviction and act with humility. The guiding principles behind each of our decisions that help us uncover wolves concealed amongst even our highest conviction ideas, and prevents deception from the seemingly familiar becoming – ironically – all too familiar.
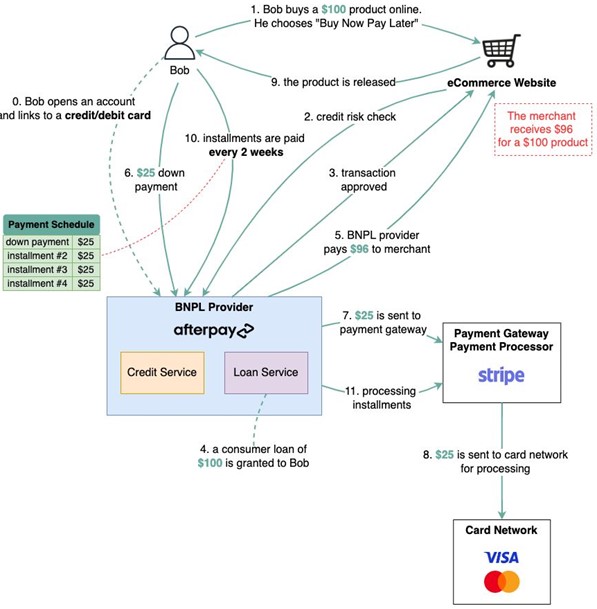
Buy-now-pay-later (BNPL) is one concept that we believe can be particularly deceptive. To the unassuming consumer, BNPL is wonderfully ingenious. Credit risk for your transaction is shouldered by the merchant from whom you purchase. It looks, smells and tastes like free money. Only alas! On closer inspection we find that BNPL is in fact just a craftily marketed, dolled up version of the same age-old credit process. Soft pastel colours and smiling millennials may have replaced images of burly debt collectors demanding pounds of flesh, but the core underlying credit agreement between consumer and lender remains unchanged. Missed payments will still result in the same letters in the post, demanding the same penalizing late fees. And opening them will still provoke the same sense of incredulity as you jump up and shout, “Oh my! I didn’t realise what big teeth you have!”
Contextualising BNPL as a branch of consumer credit is a prerequisite to appreciating its value. The ongoing arms race between technology giants Grab, GoTo and Sea Ltd over Southeast Asia’s 120 million Indonesian labour force participants who do not own a credit card is the archetype of the modern fintech battle that we see across many of our markets. There are millions of people in Egypt, Vietnam, Philippines, Nigeria, Kenya and Bangladesh without access to consumer credit, but poor pre-existing infrastructure makes it difficult for highly focused credit products such as BNPL to gain traction.[1] Here, the spoils of war will not be won on credit alone. Funding gaps of such depth and complexity must instead be addressed by a broad arsenal of fintech services including digital banking, cashless payments, credit reporting and cross-border transactions.
Alibaba’s Alipay is arguably the best example to-date, and its success in China has created a blueprint for many platform businesses within our markets. A collection of fledgling financial Megazords working to refine the configuration of their autonomous product constructs. For many it remains a work-in-progress. However, there are exceptional cases that indicate some may have found a winning formula.
Nestled away in a market of just 19 million people, Kaspi.kz has built a formidable application that boasts a user base comprising over 95% of the adult population of Kazakhstan. What originated as a humble Tier 2 bank has emerged over the last decade as the largest payment network, e-commerce platform and consumer finance business in the country.[2] Today, Kaspi.kz processes more transactions in Kazakhstan – where over two thirds of all transactions are cashless – than Visa and MasterCard combined.[3] Online purchases through the 260,000 active merchants on the platform account for over 70% of the entire e-commerce market.[4] And in 2021 they distributed over twice the amount of consumer loans compared to the largest and most systemically important bank in the country. In short, Kaspi.kz is not just a part of the fintech revolution in Kazakhstan. It is the revolution.
Figure 2: Kaspi.kz has multiple payments, e-commerce and credit products within a single application
Source: Kaspi.kz
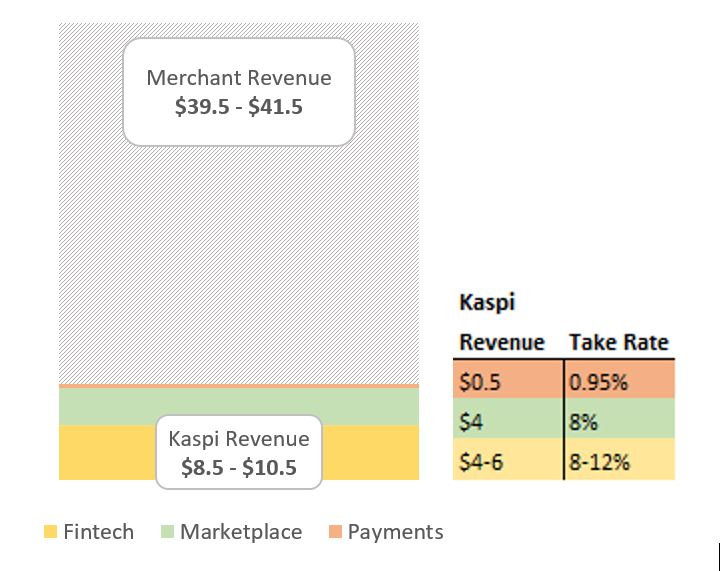
Indeed, outside of China, one would be hard pressed to find a company that has a firmer grip on the consumer spending journey than Kaspi.kz enjoys in Kazakhstan. In providing a place to purchase, a method to purchase and the means to fund that purchase, Kaspi.kz owns every commercial touchpoint of the transactions through its platform, thereby gaining access to the maximum profit pool of each consumer. Consider someone making a US$50 online purchase, funded through a three-month, 0% interest BNPL product. That single transaction has three revenue channels for Kaspi.kz, equating to between US$8.5 and US$10.5 in revenue. That is a whopping 17-21% of the overall transaction value.[5]
Figure 3: Revenue distribution for $50 e-commerce transaction funded through 3month BNPL
Sources: Kaspi.kz; Vergent Asset Management
The roots of success are often multifaceted, and Kaspi.kz is no exception. No doubt there are traces of the Matthew Effect, but equally we see attempts to deploy the same payments-marketplace-consumer finance trifecta in other markets as far inferior.[6] In our view, the triumph of Kaspi.kz in Kazakhstan is not as much in the business mix as it is in how those businesses are woven together. And in this case all yarns lead back to BNPL.
Figure 4: Kaspi.kz’s three businesses benefit from a strong network effect
Source: Kaspi.kz
Contrary to the traditional BNPL model of maximising standalone yields, Kaspi.kz utilizes BNPL as the engine room to drive the average transaction value (ATV) and volume of its users high enough to maximise the revenue of the entire platform. Incremental transactions generate proprietary data points on each user that pollinate other revenue generating areas of the business, whilst simultaneously diluting cost centres such as product development, sales and marketing, and risk management. That arms Kaspi.kz with new products and data to support more informed lending decisions, and thus the cycle repeats. Such is the potency of this lending model that through 2021— a period when the three global BNPL giants collectively burnt over US$1 billion of cash— Kaspi.kz’s standalone lending business generated a return on equity of over 45%.[7]
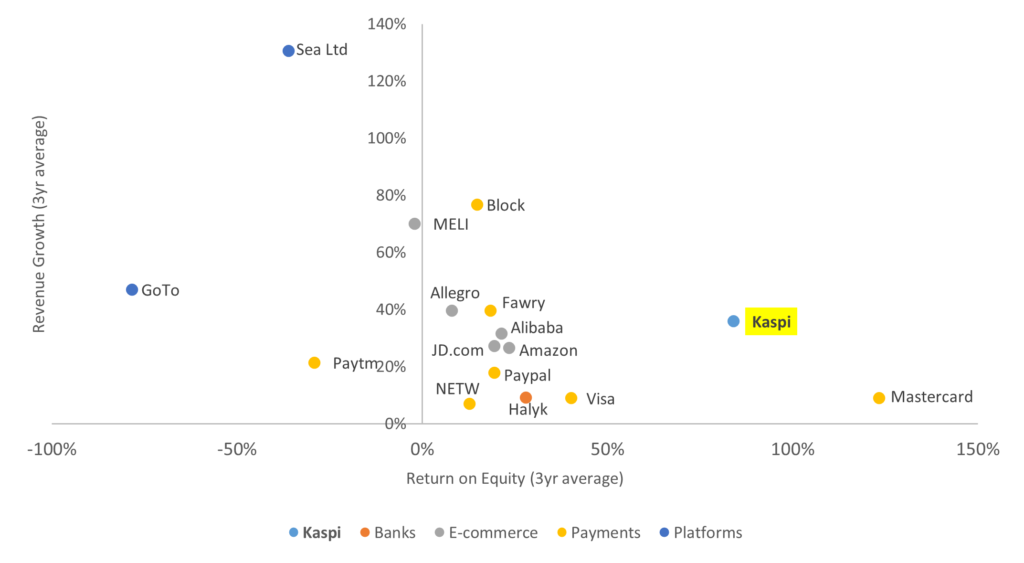
One of the most compelling upshots from this model is the impact on growth. Revenues magnified by intertwined, self-perpetuating products have a diluting effect on the cost base, sending operating leverage into overdrive. As a result, Kaspi.kz has managed to grow revenues at a 34% CAGR since 2019, despite spending on average just 4% of revenue on sales and marketing.[8] Even more astounding is that this growth was delivered at an average net margin of over 40%, for a combined growth and return profile that is best-in-class on an industry, regional and even global basis.
Figure 5: Revenue growth (three-year average) vs. return on equity (three-year average) for comparable peers
Sources: Bloomberg; Company Filings; Vergent Asset Management
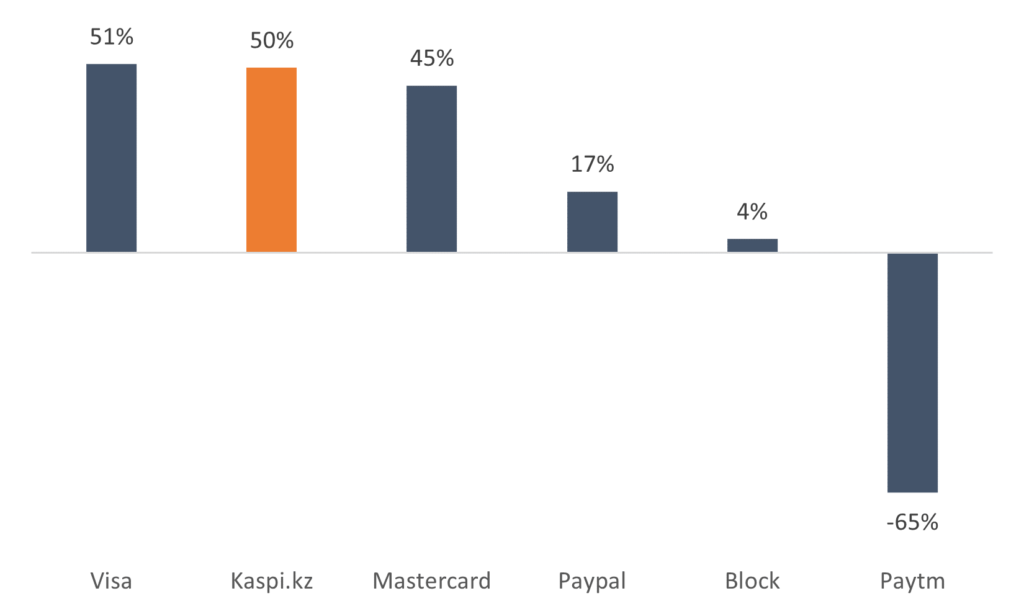
Consequently, Kaspi.kz enjoys the luxury of being able to subsidise strategic products profitably. In the marketplace business that means providing 95% of deliveries free of charge whilst still operating at over 60% net margin. Within payments, it means monetizing less than 10% of the peer-to-peer (P2P) transactions that constitute over 75% of total payments volume, thereby forgoing the lucrative interchange fee that typically represents the largest revenue line for digital banks, including Monzo and Revolut, as the cost of customer acquisition. That Kaspi.kz’s standalone payments business can still deliver net margins comparable to the largest and most successful global payments companies, despite surrendering these fees and operating in a market a fraction of the size, speaks to the harmony of its consolidated platform.
Figure 6: Net income margins of payments peers (three-year average to last reported period)
Source: Bloomberg; Kaspi.kz Data shown for Kaspi.kz is the standalone payments business
The term super-app is overused and, in our view, frequently misunderstood. Sifting through investment decks of the not-so-super, the moderately-super or even the one-day-we-are-sure-to-be-super apps that flood our markets can at times feel like dragging a philistine through a modern art exhibition. No matter how fervent the arguments may be that the blue square in front of you is a masterpiece – a unique perspective on modernism – to the untrained eye it all looks rather the same. When we suggest that Kaspi.kz is emerging as one of the few genuine super-apps it is not because the platform tells the same exhausted story of having multiple products under one roof. Strength here is not in numbers: It is in the intricate design of each product such that the sum of all products is greater than the parts.
Critically, the platform must have ‘plug and play’ compatibility with new products. Acting as a magnet for new services that yearn for an adrenaline shot of growth is vital for keeping the platform sharp, competition blunt, and deepening the competitive moat of any aspiring super-app.
Take for example, Santufei, a negligible rail and airline ticketing vendor that comprised just a handful of people and a few basic aggregator relationships when Kaspi.kz acquired it in August 2020 for a paltry US$5 million. Today, that business (rebranded ‘Kaspi Travel’) sells over 70,000 tickets per month through what is now the largest rail and ticketing platform in the country. And travel tickets are just the start. There is a not-so-distant future where we foresee an office worker in Almaty ordering a taxi after a long day, getting home to receive promotions for their favourite takeaway, placing an order and then tipping the delivery driver all through Kaspi.kz. In this world, it is 3rd party developers that must bow as Kaspi.kz ascends to the gilded heights of consolidator. The gatekeeper to an ecosystem so rich that 3rd parties are forced to cede a slice of the economics, despite assuming all the business risk.
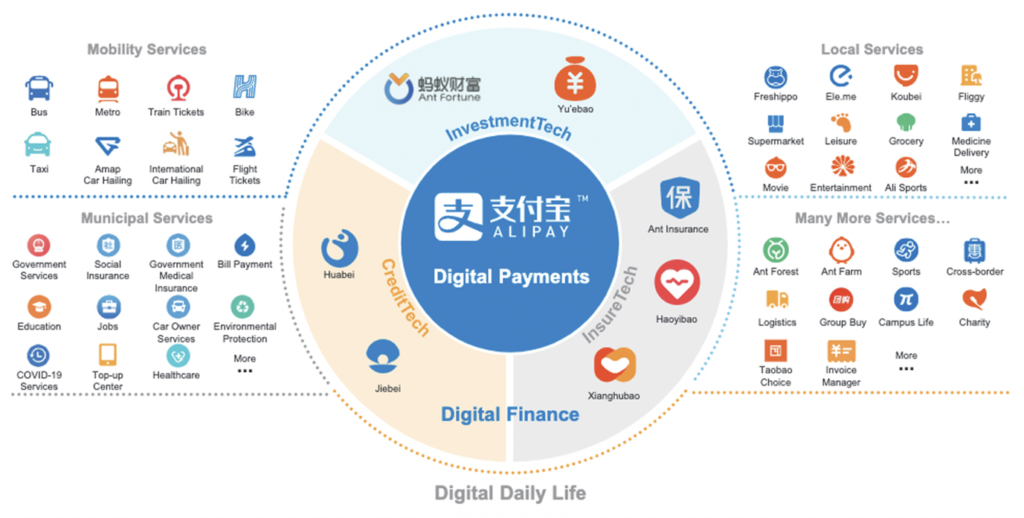
Platform compatibility is also relevant for the merchant base. Many services unbeknownst to consumers such as B2B payments, supply chain management solutions and merchant credit services offer equally attractive economic prospects, if not a means to entrench the platform deeper into the Kazakhstan economy than their consumer product counterparts. One only needs to look at the breadth of services offered through Alipay today to get a sense of how much more room there is for Kaspi.kz’s platform to grow.
Figure 7: Alipay offers insight into what the future Kaspi.kz platform may look like
Source: Alibaba; Vergent Asset Management
Although the example of Alipay offers a glimpse as to the end state for every aspiring super-app, we must remember that by no means does it reflect the sole operating model. Platforms with origins in payments will differ to those grown out of e-commerce, financial services, or one of the countless other services that can support the initial acquisition of customers. In our view, it is the understanding of this centrality that becomes essential in helping us see beyond a familiar and otherwise undifferentiated countenance.
So while Kaspi.kz will march on, continuing to forge new products against the idiosyncrasies of Kazakhstan, the near-term focus for us will remain firmly on BNPL. For today, that is the beating heart of the company’s ecosystem. The consumer credit juggernaut that in equal measures poses the greatest risks and opportunities to sustainable growth.[9] That we maintain our diligence, stay grounded in our approach and appreciate the consumer credit business for what it really is, will give us the best chance – we hope – of seeing Kaspi.kz write its own fairy tale ending.
[1] Based on ~139 million labour force and ~17 million credit cards in circulation. Sources: World Bank; Bank of Indonesia.
[2] Grossly simplified, Kaspi.kz is probably best thought of as a combination of Revolut, Paypal and Taobao. A somewhat fitting unity of East and West.
[3] Source: Analysis of the payment market in the Republic of Kazakhstan, PWC (March 2022).
[4] Source: Analysis of the retail e-commerce market in the Republic of Kazakhstan, PWC (October 2022).
[5] Moreover, this example is conservative. BNPL products that exceed three-months draw interest from the consumer and higher take rates from merchants, while certain e-commerce categories also command higher take rates.
[6] Taken from the Gospel of Matthew and popularized as the Power Law, the Matthew Effect is based on the idea that market leaders will attain a disproportionate amount of value over time. For companies with large network effects, that typically means being first to market.
[7] The three global BNPL giants referenced here are Klarna, Affirm and Afterpay, which reported US$631 million, US$431 million and US$159 million FY21 net losses respectively.
[8] Calculated as three years to June 2022.
[9] Macroeconomic risks associated with Kazakhstan are also at large, and the exclusion here for simplicity should not be confused with insignificance.
For fans of Seinfeld, the line “What’s the deal with…” reminds us of a particular brand of observational comedy from the 90’s. Well, turns out 90’s humor is still a big deal, as Netflix paid half a billion dollars in 2021 for the streaming rights of Seinfeld. Not bad for a show about nothing. As we kick off a brand-new year, we thought it’s the perfect time to ask ourselves “What’s the deal with EM small cap…?”
For most investors, emerging markets (EM) as an asset class is high on the risk spectrum. They could be forgiven for thinking of small caps within EM to be a step too far. The EM small cap universe (EM SC) for the most part is ignored or misunderstood. We hope to change a few perceptions along the way by shining a light on EM SC as potential ground for adding alpha.
Added value
Before we begin to answer “What’s the deal with EM small caps…” let’s look at how MSCI EM SC has performed compared to its all-cap counterpart, MSCI EM. As seen below, whether on a three year, five year, 10 year or 20 year period, the MSCI EM SC index adds value compared to its all-cap counterpart. At the start of 2023, as we possibly enter a prolonged period of higher inflation and interest rates, we expect small caps to outperform by leveraging the flexibility and nimbleness that comes with smaller size and lower bureaucracy.
% Annualized USD Returns
3 yr
5 yr
10 yr
20 yr
MSCI EM SC
5.38%
1.32%
3.45%
9.60%
MSCI EM
-2.42%
-1.10%
1.77%
9.04%
Source – Bloomberg. As on 30 Dec 2022.
A big stage
The reasons for its relative outperformance are many. Let’s start off with the fact that the EM SC universe is vast, with plenty of space to find the next big compounder among 11,000 companies, 24 countries and 11 sectors. The benchmark index – MSCI EM SC (MXEFSC) – is constructed with no index weight bias. Also, except for Taiwan, there is no sector bias among the big countries that constitute the index. This size and diversity mean that the EM SC universe offers plenty of scope for portfolio diversification and alpha generation.
Low to no coverage
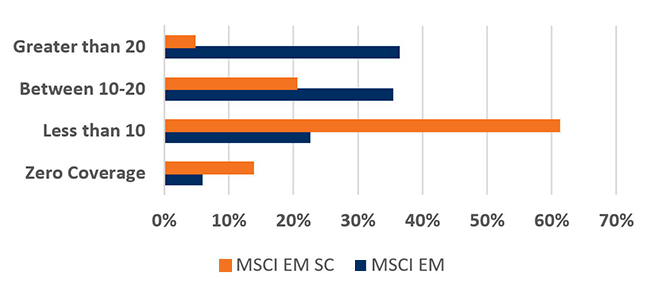
With big size comes lack of proper coverage. This universe’s vastness, combined with liquidity constraints, means this asset class doesn’t get extensive coverage, despite the value it has added historically. We see under coverage from both the buy side and sell side. This lends perfectly to our process at Global Alpha where we put in the hard yards to travel, meet management in person, and understand local business customs to stay on top of the story.
Analyst Coverage Comparison
Source – Bloomberg. As on 30 Dec 2022
Less sino-centric
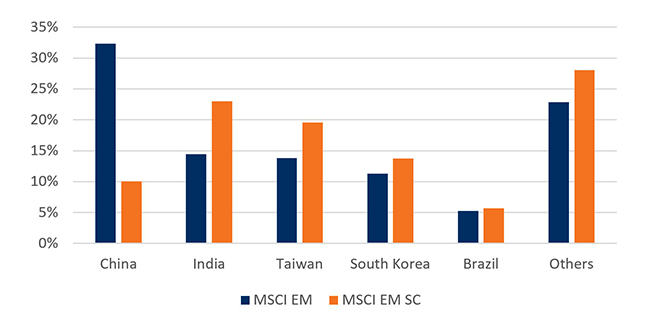
China dominates the large cap index – making up over 30% of the benchmark – while making up just around 10% of the small cap index,as seen in the graph below. The more balanced construction of the EM SC index helps investors avoid the policy and geopolitical risk that comes with concentrated exposure to a single market. At the same time, this differentiated exposure is a good complement in terms of total portfolio diversification.
EM Index Composition
Source – Bloomberg. As on 30 Dec 2022
Tailwinds
After decades of globalization, the pandemic exposed the fragility of the global supply chain system. De- globalization, near shoring and a greater reliance on domestic consumption as an engine of growth could come to define the next decade. EM small caps have greater exposure to consumer-facing sectors like healthcare, industrials, and discretionary and lesser exposure to global cyclicals like IT and energy compared to its all-cap peer.
MSCI EM
Source – Bloomberg. As on 30 Dec 2022
MSCI EM SC
Source – Bloomberg. As on 30 Dec 2022
SOE’s are minor actors
The EM SC benchmark has a lower allocation to State-Owned Enterprises (SOEs) than its large cap counterpart. Our experience informs us that SOEs are the same regardless of the country in which they are domiciled. They suffer from:
poor capital allocation,
lack of alignment of incentives,
slow pace of decision making, and
a track record of poor shareholder returns.
On the flip side, many of our small cap names need to be nimble and innovative to survive. Experience has shown that first generation entrepreneurs with skin in the game and properly aligned incentives tend to create shareholder value in the long run.
Being active
Emerging markets is a space where portfolios can look different from benchmarks. Research confirms that the average active share in this space has historically been close to 70%* and that there is a positive and significant relationship between active share and fund performance. Further, being consistently active is a strong predictor of fund performance. In other words, managers who back themselves on their ability to outperform by maintaining a high level of active share do well in the long run.
As we travel around the world, we are also seeing a generational shift in thinking among many of our family-owned companies. There is an openness among them to hire professional management. We also see a willingness to enhance corporate governance standards, and a better appreciation of what constitutes good capital allocation. While we don’t underestimate the challenge of finding the next HDFC Bank or TSMC, we feel the EM SC space offers the best playing field to generate value for our clients in the long run. And in our mind, that’s a big deal.
*Based on 67 emerging market funds that use MSCI Emerging Market Index as their benchmark. Active share is defined as percentage of holdings in a portfolio that differs from its benchmark.
High inflation resulted in poor equity market performance in 2022 despite economic / earnings growth. Inflation relief in 2023 may limit further market weakness despite a global recession.
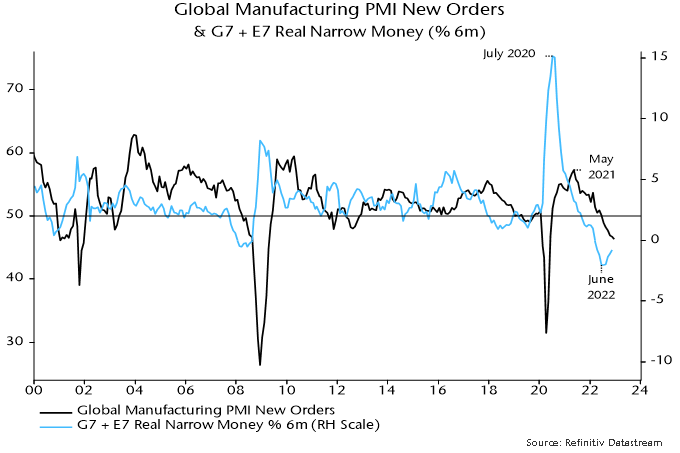
Absent shocks, economic momentum usually reflects real money trends six to 12 months earlier. Global six-month real narrow money momentum turned negative in March 2022, reaching a low in June before recovering slightly into November – see chart 1. This suggests that economic weakness will intensify in early 2023, with no monetary signal yet of a subsequent meaningful rebound.
Chart 1
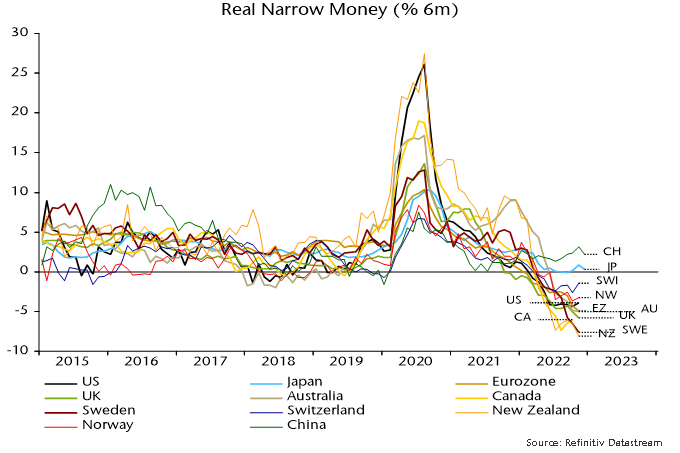
Real money contraction is fastest in the housing bubble / bust economies of New Zealand, Sweden and Canada, although the UK, Eurozone and US are only slightly behind – chart 2. China and Japan are positive outliers, suggesting less unfavourable prospects.
Chart 2
Hopes are high that China’s covid policy U-turn will lead to a V-shaped economic recovery, as occurred in G7 economies post reopenings. Strong G7 rebounds, however, followed a surge in money growth. Chinese real narrow money expansion is still modest by historical standards and a rise in money rates in late 2002 may indicate less expansionary PBoC policy, possibly reflecting concern about inflationary effects of rapid reopening.
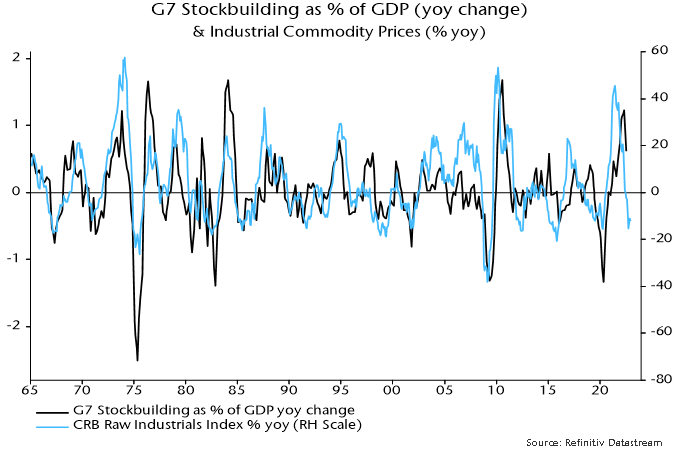
Still-negative global real narrow money momentum indicates that a Chinese economic pick-up won’t offset recessions elsewhere. Forecasts of China-driven strength in commodity prices, therefore, are suspect. Additional weakness is more likely, based on an accelerating downswing in the global stockbuilding cycle, a key driver of commodity prices historically – chart 3.
Chart 3
The 2021-22 inflation surge was a consequence of central banks applying record monetary stimulus in 2020 as the stockbuilding cycle was tracing out an extreme low. Monetary fuel supercharged the usual cyclical rise in commodity prices.
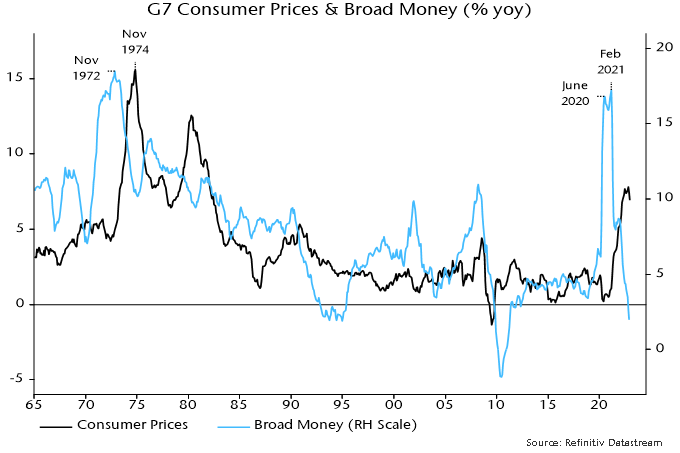
The monetary backdrop, like the status of the stockbuilding cycle, is now the opposite of 2020. G7 annual broad money growth crashed to 2.0% in November, below a pre-pandemic (i.e. 2015-19) average of 4.5% and down from a February 2021 peak of 17.3% – chart 4. The monetarist understanding of a roughly two-year lead implies an inflation crash from early 2023.
Chart 4
The latest trends, indeed, suggest rising medium-term deflation risk. G7 broad money contracted marginally in the three months to November. Bank loan growth to the private sector had been providing support but is now slowing as higher rates curb mortgage demand and corporate borrowing needs moderate with the stockbuilding downswing.
The weak economic outlook is, according to the monetarist view, of limited relevance for assessing equity market prospects, which will hinge instead on “excess” money developments.
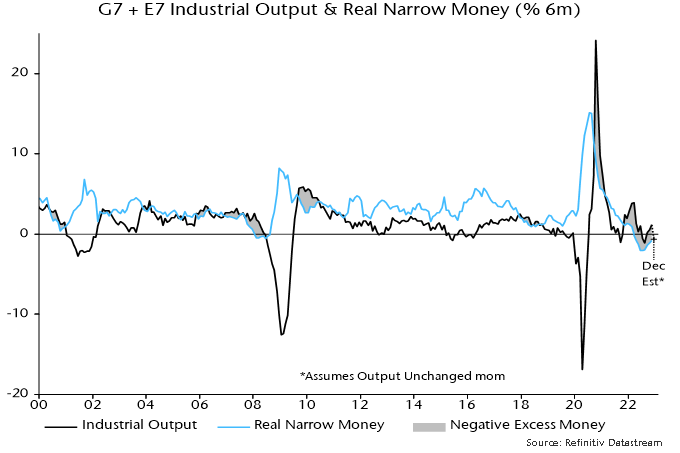
Two global excess money proxies are followed here: the gap between six-month real narrow money and industrial output momentum; and the deviation of 12-month real money momentum from a long-term moving average. The first indicator turned negative in December 2021 (allowing for data reporting lags), with the second following in February 2022. Historically (i.e. over 1970-2021), global equities underperformed cash by 8.9% pa on average when both were negative. The underperformance between end-February and end-December 2022 was larger, at 14.9% pa.
As noted earlier, six-month real narrow money momentum has recovered slightly from a June low. Industrial output momentum, meanwhile, is estimated to have turned negative at end-2022, with further weakness likely. A cross-over, therefore, appears imminent and may even have occurred in December – chart 5. Allowing for the data reporting lag, a December cross-over would imply a shift in sign of the first indicator from positive to negative from end-February.
Chart 5
The second indicator – the deviation of 12-month real money momentum from a moving average – is heavily negative and unlikely to turn positive before mid-2023 at the earliest.
The expected combination of positive and negative readings of the first and second indicators respectively was historically associated with equities underperforming cash by an average 4.5% pa, suggesting retaining a cautious investment stance.
The combination could result in significant sector / style rotation: tech, quality and growth outperformed on average with value and energy underperforming. Non-energy defensive sectors would be expected to continue to outperform non-tech cyclicals. EM equities outperformed developed markets on average.
The suggestion of a reversal of growth underperformance in 2022 is consistent with indications that Treasury yields will decline during 2023 – surging yields contributed to the derating of growth stocks last year.
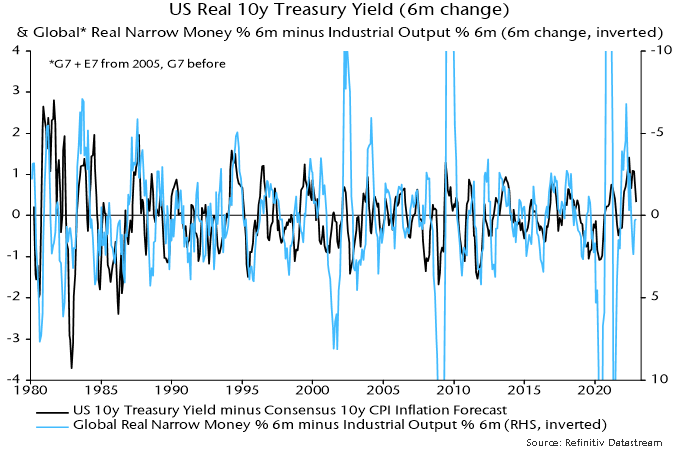
Equity markets are bullish or bearish depending on whether excess money is positive or negative. Bond markets, by contrast, are sensitive to the rate of change of excess money, rather than its sign. Changes in US real Treasury yields have been inversely correlated with changes in the first excess money measure historically, i.e. yields have fallen when the measure has risen, even while still negative – chart 6. The current / expected improvement in the measure, therefore, suggests an extension of the recent yield decline.
Chart 6
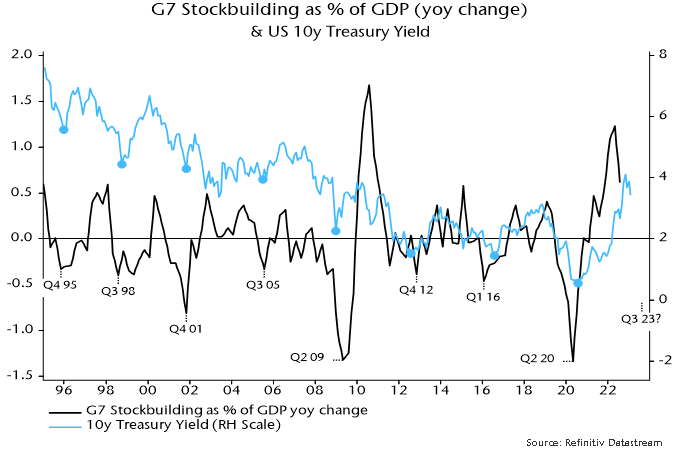
Treasury yields, in addition, usually move down into a low around the same time as the stockbuilding cycle trough – chart 7. Based on the average cycle length of 3 1/3 years, the next low could occur in Q3 or Q4.
Chart 7
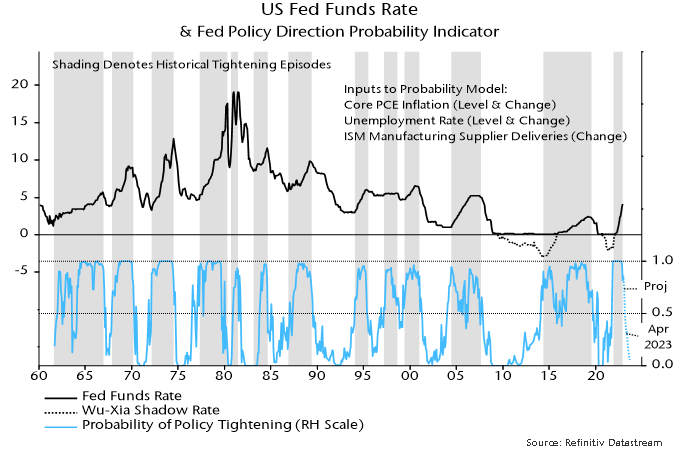
A fall in Treasury yields requires a Fed policy “pivot” but this could be imminent. Chart 8 shows the estimated probability of the Fed tightening policy in a particular month based on the latest data on core inflation, unemployment and supply bottlenecks. The probability estimate fell from 100% in October to 80% in December and currently stands at 75% for the FOMC meeting on 31 January / 1 February, consistent with market speculation of a step down from a 50 to 25 bp hike.
Chart 8
Based on the FOMC’s December median projections, the probability of tightening is forecast to fall below 50% in Q2 and below 10% in Q3. This outlook is consistent with the Fed shifting to an easing bias in Q2 and starting to cut rates in Q3.
Les turbulences du marché au cours des dernières années ont culminé avec un important repli des actions cotées et des titres à revenu fixe en 2022. Cependant, le chemin parcouru a permis de tirer des enseignements et des leçons utiles, notamment des expériences vécues au plus fort de la pandémie en 2020. Cet article examine dans quelle mesure les investisseurs ont tenu compte des signaux d’alarme ou s’ils ont été désensibilisés aux risques qui en découlaient.
David Hillson, consultant international en gestion du risque, définit le risque comme des « incertitudes importantes ». Autrement dit, lorsqu’on examine les diverses incertitudes liées aux placements, l’essentiel est de comprendre à quel point les conséquences pourraient être importantes si les choses ne se déroulent pas comme prévu. L’évaluation et l’acceptation du risque varient d’un investisseur à l’autre. Cela s’explique par le fait que différents investisseurs ont différents niveaux d’appétit pour le risque et de tolérance au risque.
Selon la définition d’Hillson, les conséquences pratiques pour les investisseurs consistent à hiérarchiser les risques au moment de décider comment y réagir. Par exemple, si un risque donné a une faible incidence et une faible probabilité, vous pouvez choisir de l’accepter. Toutefois, pour les risques importants et dont la probabilité est plus élevée, vous voudrez agir. Cela peut comprendre le contrôle de l’exposition au risque au moyen d’une meilleure diversification du portefeuille ou l’élimination complète du risque, si possible.
Enseignements tirés de la pandémie
Dans le contexte récent des marchés, la pandémie a fait ressortir des enseignements et des signaux d’alarme, dont les suivants :
Une concentration accrue des marchés boursiers, en particulier des sociétés technologiques;
Un risque accru de hausse des taux d’intérêt et un potentiel de rendements négatifs des titres à revenu fixe;
Des gouvernements du monde entier travaillant ensemble pour gérer des enjeux mondiaux importants.
Concentration des marchés boursiers
Il n’y a eu aucune surprise lorsque les marchés boursiers ont reculé en réaction à la propagation de la pandémie au premier trimestre de 2020, car les investisseurs ont réagi aux répercussions sur l’économie et au sort de certaines sociétés, en particulier celles du secteur des voyages et du tourisme, alors que le monde amorçait diverses étapes du confinement. Toutefois, la rapidité de la reprise a surpris la plupart des investisseurs.
Soutenus par des mesures d’assouplissement quantitatif exhaustives, les marchés boursiers se sont fortement redressés et plusieurs ont enregistré des rendements positifs importants pour l’année civile 2020. Parmi les actions les plus performantes à l’échelle mondiale en 2020, mentionnons celles des sociétés technologiques, qui ont profité de la dépendance accrue au commerce électronique durant la pandémie. Toutefois, cette solide performance a également entraîné une concentration accrue des principaux indices boursiers. Par exemple, Apple, Microsoft, Amazon, Facebook et Alphabet Inc. ont représenté plus de 20 % de l’indice S&P 500 à la fin de 2020. Ce rendement impressionnant a également désensibilisé les investisseurs au risque de concentration.
Les actions américaines sont généralement la composante la plus importante des portefeuilles de la plupart des investisseurs, de sorte que la concentration accrue a suggéré qu’une révision de la construction globale du portefeuille d’actions était appropriée. Pour ceux qui privilégient les marchés boursiers développés mondiaux à grande capitalisation, où les États-Unis dominent la capitalisation boursière globale, les considérations potentielles comprennent l’ajout de placements dans les actions mondiales à petite capitalisation et les actions des marchés émergents.
Toutefois, la diversification de la répartition globale des actions pour réduire le risque propre aux actions américaines n’a pas réglé le problème de la préférence pour les technologies de l’information, car les titres technologiques à l’échelle mondiale ont grandement profité de la dépendance au commerce électronique durant la pandémie. Par conséquent, une évaluation de la préférence générale pour le style de gestion des actions était également de mise. Par exemple, les gestionnaires axés sur la valeur sont moins enclins à investir dans des titres technologiques, ce qui offre une source de diversification sectorielle.
La réduction de toute préférence pour les titres technologiques et de croissance en général aurait été un avantage en 2022, puisque ceux-ci ont été les plus touchés au cours de l’année civile. Les hauts et les bas de certains titres et secteurs soulignent l’importance de disposer d’un processus formel d’évaluation du risque pour discuter des incertitudes qui se présentent et les traiter, comme le risque de concentration.
Risque lié à la hausse des taux d’intérêt
Les taux des titres à revenu fixe sont en baisse depuis des décennies, période au cours de laquelle les gouvernements et les sociétés ont profité de l’occasion pour prolonger considérablement l’échéance de leurs obligations lorsqu’ils effectuaient de nouvelles émissions. Ce faisant, ils ont contribué à une sensibilité accrue aux variations des taux d’intérêt (durée) pour les indices de titres à revenu fixe, comme l’indice des obligations universelles FTSE Canada, et au risque associé de faibles taux de rendement combiné à une durée élevée dans un contexte de hausse des taux. Pendant des années, les « experts » ont prédit une hausse des taux d’intérêt qui n’a pas eu lieu, ce qui a incité les investisseurs à baisser la garde à l’égard du risque qui en a découlé.
De plus, l’expérience du marché des titres à revenu fixe durant la pandémie a simplement alimenté la désensibilisation des investisseurs. En période de tensions sur les marchés boursiers, un portefeuille de titres à revenu fixe de qualité assorti d’une durée élevée peut constituer une importante source de diversification en raison de la demande accrue d’actifs « refuges » et de la baisse des taux. Ceci a d’ailleurs permis aux marchés des titres à revenu fixe de dégager des rendements positifs lorsque les marchés boursiers subissaient d’importants replis. La nature défensive des titres à revenu fixe s’est concrétisée en 2020, car l’indice des obligations universelles FTSE Canada a inscrit un rendement de 8,7 % pour l’année, malgré le faible taux de rendement en vigueur.
Toutefois, le risque associé à la faiblesse des taux et à une durée élevée dans un contexte de hausse des taux d’intérêt s’est manifesté avec force en 2022, car l’indice obligataire universel FTSE Canada a reculé de plus de 11 % et l’indice obligataire global à long terme FTSE Canada, de plus de 21 % pour l’année civile.
Les mesures prises par les investisseurs qui ont un objectif de rendement absolu et qui ont tenu compte des signaux d’alarme relatifs aux faibles rendements et à la durée élevée comprennent les suivantes :
Adopter des stratégies de titres à revenu fixe axées sur la préservation du capital et moins sensibles aux taux d’intérêt;
Assouplir les contraintes imposées aux gestionnaires de titres à revenu fixe dans le but de générer une plus grande valeur ajoutée par rapport à celle des stratégies de titres à revenu fixe traditionnelles;
Augmenter le taux de rendement au moyen d’autres actifs à revenu fixe, comme les prêts hypothécaires commerciaux;
Investir dans des actifs à revenu non fixe à rendement plus élevé, comme les infrastructures directes et les biens immobiliers commerciaux.
La situation est différente pour les investisseurs qui ont des objectifs liés au passif, comme les régimes de retraite à prestations déterminées, où, dans de nombreux cas, malgré les rendements négatifs des actifs des régimes de retraite en 2022, la diminution du passif a été plus importante, ce qui a amélioré la capitalisation. Or, pour les régimes qui ont recours à l’effet de levier dans leur portefeuille de titres à revenu fixe pour accroître la couverture du passif, l’expérience du marché en 2022 peut avoir détérioré la capitalisation.
En raison de la dynamique de l’actif et du passif des régimes de retraite à prestations déterminées, les prochaines évaluations du risque et les discussions connexes porteront probablement sur la question de savoir si l’expérience de 2022 a créé une occasion de tirer parti d’une amélioration de la capitalisation. Par exemple, lorsque l’objectif est de gérer la volatilité associée à la capitalisation, l’augmentation de la pondération des titres à revenu fixe pourrait constituer un facteur de gestion du risque.
Des gouvernements qui travaillent ensemble
La pandémie a montré que les gouvernements du monde entier peuvent travailler ensemble pour s’attaquer à d’importants enjeux mondiaux et a créé des attentes à l’égard d’une meilleure coordination de l’investissement responsable en général, et plus particulièrement du risque climatique.
La guerre actuelle en Ukraine et son incidence sur l’offre et les prix de l’énergie ont fait en sorte que les marchés fortement axés sur les ressources, comme le Canada, ont profité de la hausse de la pondération du secteur de l’énergie, ce qui a contribué à limiter l’ampleur des replis des marchés en 2022 par rapport aux marchés moins exposés aux ressources. La situation a également mis en évidence les défis que représente l’adoption d’une position sans placement dans les combustibles fossiles au sein d’un portefeuille au cours d’une période où l’énergie était le secteur boursier le plus performant.
Néanmoins, il est essentiel que les gouvernements et les propriétaires d’actifs ne soient pas insensibles à l’importance et à l’urgence d’une transition vers des énergies renouvelables et plus propres, simplement en raison de la récente expérience de rendement des placements. Même si le monde reste fortement tributaire des sources d’énergie traditionnelles et qu’il y a encore beaucoup de chemin à faire pour réduire notre empreinte carbone, une transition continue et ordonnée vers des énergies plus propres est essentielle pour gérer l’impact du risque climatique.
Perspectives
Les turbulences des dernières années ont contribué à désensibiliser les investisseurs aux risques qui en découlent. La gestion du risque ne doit pas seulement reposer sur une modélisation complexe; elle peut prendre différentes formes, y compris une discussion simple entre les fiduciaires ou les membres du comité, en s’appuyant sur les points de vue des gestionnaires de placement et des consultants, et en peaufinant la stratégie d’actif et la diversification du portefeuille. Au début de 2023, prenez le temps d’examiner soigneusement votre portefeuille afin de déterminer toute incertitude susceptible d’accroître le risque de ne pas atteindre vos objectifs.
Anyone who’s kept an eye on the markets is aware that the energy sector had a blowout performance in 2022. It started with the war between Russia and Ukraine in February that spiked oil and gas prices, the discussion then shifted to European LNG supply for the following winter, including which countries would be able to absorb Russia’s excess oil supply. Clearly, the energy resurgence in 2022 was a European-driven one.
With that in mind, what is the situation going into 2023? It appears that the worst-case scenario for this European winter has been avoided. Natural gas prices are now back at the pre-Ukraine invasion level, EU gas storage is sitting a comfortable 5% above its five-year trend, and winter weather has been lenient so far.
European Union gas storage levels, 2017 – November 2022
Governments are now focusing on planning for next winter, and the data points are more mixed. In 2022, Europe benefitted strongly from having Russian LNG flow for most of the summer and from lower LNG demand from China. Both things are unlikely to repeat in 2023. Indeed, a worst-case scenario, where Russian pipelines stop flowing completely for 2023, would represent a gap of nearly 50% of total gas storage requirements for the winter of 2023/24. And there are not many options for Europe to fill this gap elsewhere. Indeed, China’s 2023 LNG imports are expected to reach 2021 levels, which would capture over 85% of the estimated increase in 2023 LNG global supply, with much of that increase already contracted by China.
The market however does not appear to be discounting this. December 2023 futures contract for LNG is sitting around €70 per MWh, three times pre-2021 levels but well below the peak of €345 seen in August. There are certainly some indicators that support this optimism. Between August and November 2022, EU natural gas consumption dropped 20.1%, well above the government self-imposed target of 15% for the period between August 2022 and March 2023. Finland reduced its consumption by as much as 52%. Many countries capped the price for consumers and businesses. These lower prices should help alleviate the size of deficits generated from these programs, allowing those countries to face next winter with a healthier balance sheet. Furthermore, the weather for the rest of the winter will be a key driver of the requirements for next year, as estimates for gas storage levels at the end of the heating season vary between 5 and 35% of full capacity. Clearly it is too soon to predict a worst-case scenario, and Global Alpha does not expect a worst-case scenario to materialize. But the pain is likely to be felt more than markets currently discount.
At Global Alpha we have historically underweighted energy in our portfolios, not because of any macro views, but instead because the team consistently found better stock picking opportunities elsewhere. Indeed, pure oil and gas stocks are often at odds with Global Alpha’s investment philosophy: the quality of their balance sheet is volatile, they depend on macroeconomic factors to outperform, and as such tend to be more momentum based.
So how does Global Alpha get its energy exposure? An example of a name we have owned for many years is Schoeller Bleckmann Oilfield Equipment AG (SBO VIE). The company is the global market leader for high precision drilling components, providing nonmagnetic drill string components to directional drilling oil field service companies. Headquartered in Austria, more than 80% of its business is done in the U.S. and Europe, with high profile clients such as Schlumberger, Halliburton, and Baker Hughes.
With a healthy balance sheet and key market positioning backed by proprietary technologies, Schoeller-Bleckmann provides an attractive exposure to energy prices without being dependent on a few oil and gas projects. Indeed, its stock price has benefited from the pick-up in rig counts since mid-2021, with the firm boasting a book-to-bill ratio consistently above 1x, while at the same time showing its ability to pass on cost inflation to clients. There have also been discussions of green energy diversification, though the strategy remains unclear for now.
SWOT analysis
Strengths
+50% market share in most of its products
Strong balance sheet supported by low net debt
Weaknesses
Dependence on the big three oil services companies
Opportunities
Increased geographical diversification
Opportunistic M&A
Threats
Technological competition in their key plug market
Loss of market share in the U.S.
Schoeller-Bleckmann is a perfect example of the type of quality names Global Alpha is looking for in its portfolios: a niche, market leader with global exposure and a clean balance sheet that allows for sustained growth.