A welder working on steel plates.

Summary

Emerging market equities fell in February (the MSCI EM Index was down 6% in USD terms) as investors took profits in China, and with strong wage, consumption and services data in the U.S. fuelling fears of persistent inflation and risks that the US Federal Reserve would press on with monetary tightening for longer than anticipated. This supported a modest bounce back in the dollar after a sharp decline through Q4 last year, which was an added headwind for EM.

The reopening trade was the catalyst for the biggest rebound for Chinese equities outside of the Global Financial Crisis. Higher beta H-share names were beneficiaries of extreme flows buying into laggards. These stocks were softer through February, with Alibaba and China Education Group leading portfolio detractors.

We wrote last month that A-shares across a number of sectors were attractive given their underperformance relative to H-shares since November. Despite posting slightly negative returns in February, it was pleasing to see A-share names like heavy equipment maker Sany Heavy, industrial automation leader Shanghai Baosight, and Spring Airlines post positive relative performance at the country level.

Investors are now looking to the two sessions in March, namely the National People’s Congress and the Chinese People’s Political Consultative Conference, for major announcements and key government appointments to gauge policy direction. Brazil and Saudi Arabia continued to underperform with South Africa joining them, reflecting our view that poor global liquidity data signals a deteriorating economy that is set to drag on more cyclical markets. Reopening in China will not match the boom we saw in the West as monetary and fiscal policy remains conservative. Weak global demand will also weigh on China’s export markets. Therefore, while we are encouraged by the recovery in China’s economic activity, we are not playing derivatives of the reopening through commodities.

Modi silent on Adani

Last month we flagged that the fallout from allegations of fraud and stock manipulation levelled against the Adani Group would test India’s ascent up the development ladder. Prime Minister Narendra Modi has been the driving force for a number of crucial reform initiatives, including the electrification of poor villages, providing better sanitation in rural areas, the introduction of a bankruptcy code, a nationwide goods and services tax, and establishing digital land records and biometric identification which together underpin a virtuous circle of development. With general elections approaching in 2024, it was hard to see how Modi would lose, particularly given weak and fragmented opposition.

The fallout from Hindenburg’s short report on the Adani Group presents a key test for PM Modi, as his rise, along with that of Adani and India itself are in many ways intertwined. Modi forged his reputation as a pro-business Chief Minister of the Gujarat province in the early 2000s, with rapid economic modernisation and growth propelling rising industrialists such as Adani to the forefront of India’s growth story. As Modi rose to the office of PM, Adani was a key supporter and beneficiary of the government’s nation-building plans, enabling him to build an industrial empire across ports, power plants, resources, renewable energy and airports. India’s opposition parties, who have accused Modi of crony capitalism through helping Adani secure lucrative projects across a host of sectors, have seized on the report as evidence of corruption. Modi on the other hand has kept quiet while his spokespeople characterise the accusations as an attack by elites in Congress and the media on the BJP’s pro-growth agenda. Our view at this early stage is that the risks appear unlikely to be systemic. Hindenburg’s report outlines what looks to be a stock “ramp,” with shell entities buying up stock to lock up free float while hiding this from index providers. Ostensibly meeting liquidity and market-capitalisation requirements enabled index inclusion with a disproportionately large weighting for thinly traded Adani stocks, which was in turn fuel for a massive rally across the Adani Group. While high debt levels are a concern, the collateral tied to many of the loans are high-quality infrastructure assets, with state banks and foreign lenders bearing much of the counterparty risk. Should fallout be contained, the controversy could present a buying opportunity in some of our favoured names while encouraging better corporate governance in India.

Globalisation is not over

While globalisation is clearly changing, we can’t see it reversing. China’s export machine continues to power ahead, while developed countries wisely diversify supply chains to the benefit of other rising export players such as Vietnam, Indonesia and India. Indeed, the combination of incredibly tight labour markets in the West (the U.S. in particular) and extremely cheap real effective exchange rates across a number of emerging markets make these countries incredibly attractive investment destinations in our view. Real effective exchange rates incorporate relative levels of inflation and “trade weights” to account for a country’s largest trading counterparties. As per the following chart, some EMs are more competitive than they have been for a decade or more.

Real Effective Exchange Rate
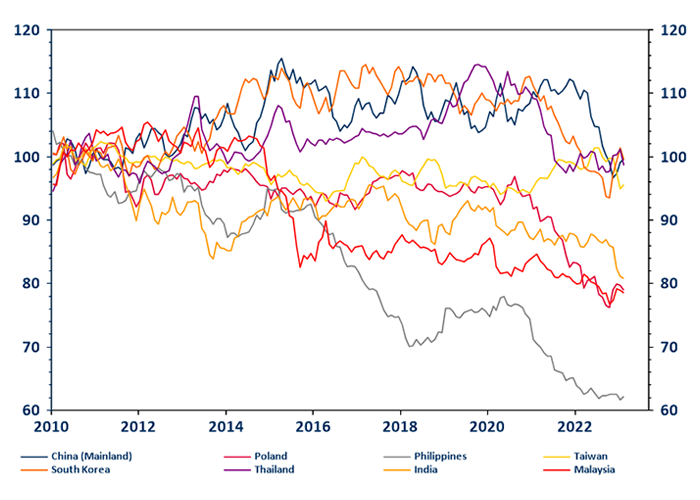
Chart showing the real effective exchange rate of emerging markets from 2010 to 2022.

Source: Refinitiv Datastream

Chinese EVs are beginning to go global

Leading Chinese electric vehicle (EV) stocks have been sold heavily over the past 12 months, with the pandemic disrupting supply chains and sapping consumer demand. Premium EV manufacturers were hit particularly hard as sentiment soured on reports of missed delivery targets in late 2022, along with a soft outlook for the next quarter or so. Despite the setbacks, the industry’s long-term prospects remain bright. The core investment case revolves around the following factors:

  • EVs are approaching purchase-cost parity with internal combustion vehicles (ICEs); 
  • a long runway for EVs to take share from ICEs;
  • increasing battery density and longer-range;
  • build out of charging infrastructure; and
  • domestic EV players successfully positioning themselves as leading premium brands in China.

What makes this a particularly attractive opportunity is the potential for Chinese EV companies to scale up in a continental-sized market. As this plays out, industry leaders will emerge within China that possess the scale and technology to go global and potentially dominate foreign markets. This is starting to play out now from a low base, with China becoming a net exporter of autos for the first time in 2022, led by EV manufacturers (HSBC Research, February 2023).

Share of NEVs as a % of China passenger vehicle exports

Source: CAAMM, QIANHAI Securities

2022 global EV volume mix

Source: EV-Volumes, HSBC Qianhai Securities

China exported 2.5 million EVs in 2022, up 57% year-on-year. Chinese brands are in the early stages of establishing themselves in foreign markets (particularly in Europe), which are less competitive than China. While a compelling story, investors need to keep expectations in check. It is likely to take years for Chinese EV players to build meaningful traction through increased brand familiarity, localising some production and distribution as well as navigate growing protectionism. If brands like NIO and BYD can manage these risks, they will be set to challenge foreign rivals by drawing on the largest EV production market in China and the strongest battery supply chain globally.
Markets are moving towards the view that the Fed will be forced to suspend or reverse interest rate hikes in response to the SVB crisis but a cessation of QT is a more important requirement for restoring banking system stability. 

QT also caused the 2019 repo rate crisis, which ended only after the Fed restarted securities purchases (Treasury bills) – portrayed, of course, as a “purely technical” measure rather than a return to QE. 

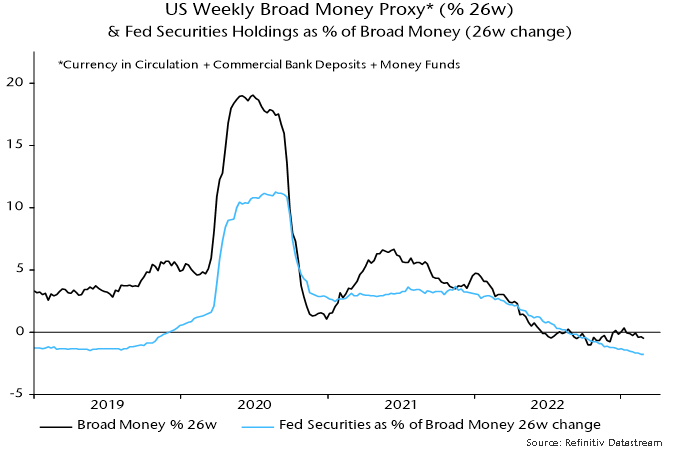
The US weekly broad money proxy calculated here has contracted since April 2022. Weakness initially reflected the US Treasury “overfunding” the federal deficit to rebuild its cash balance at the Fed. QT has been the driver more recently – see chart 1. 

Chart 1

Chart 1 showing US Weekly Broad Money Proxy* (% 26w) & Fed Securities Holdings as % of Broad Money (26w change) *Currency in Circulation + Commercial Bank Deposits + Money Funds

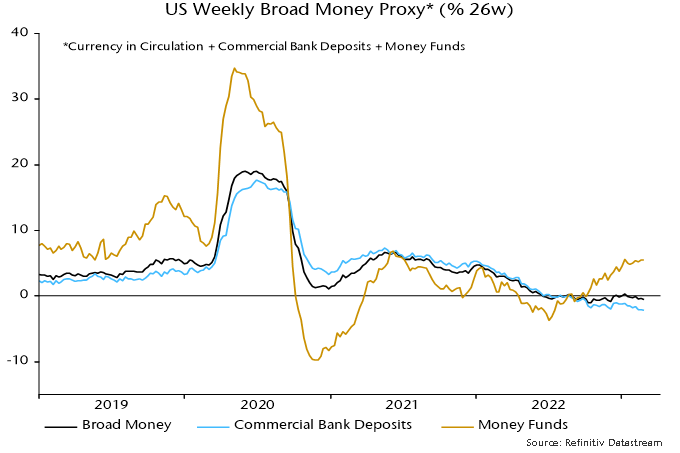
The drain of deposits from commercial banks has been magnified by competition from money market funds, which are able to place overnight funds with the Fed at an interest rate (currently 4.55%) within the Fed’s target range for the Fed funds rate (4.5-4.75%). 

Balances in retail and institutional money funds grew by 5.5% (11.3% at an annualised rate) in the latest 26 weeks, while commercial bank deposits contracted by 2.2% (4.4% annualised) – chart 2. 

Chart 2

Chart 2 showing US Weekly Broad Money Proxy* (% 26w) *Currency in Circulation + Commercial Bank Deposits + Money Funds

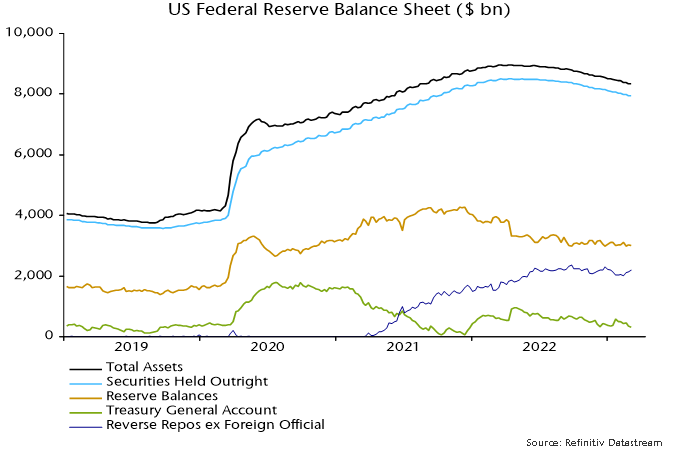
In combination, Treasury overfunding, QT and outflows to money funds have resulted in a 30% decline in banks’ reserve balances at the Fed from a peak in December 2021 – chart 3. 

Chart 3

Chart 3 showing US Federal Reserve Balance Sheet ($ bn)

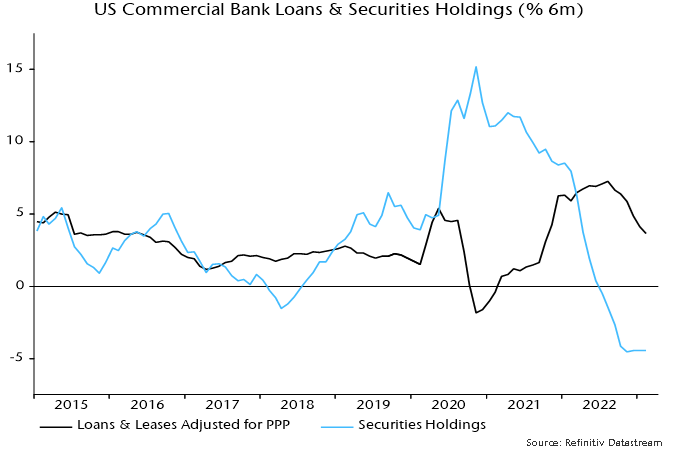
The deposits / reserves drain has caused banks to sell securities and, more recently, restrict loan supply – chart 4. 

Chart 4

Chart 4 showing US Commercial Bank Loans & Securities Holdings (% 6m)

The new Bank Term Funding Program will allow banks to avoid selling securities at a loss but fails to address the system-wide loss of deposits due to QT. The Fed facility, moreover, is more expensive than the deposits it may replace. 

Fortuitously, downward pressure on broad money has recently been relieved by a run-down of the Treasury’s cash balance at the Fed, reflecting the debt ceiling impasse. The decline, indeed, may have been accelerated to inject liquidity into the banking system – the balance fell from $345 bn to $247 bn between Wednesday and Friday last week. 

Such relief, however, is temporary. The authorities’ actions to date may be sufficient to avert another bank collapse but the banking system will remain under pressure, with negative economic implications via rising deposit / lending rates, until QT-driven monetary contraction ends.

Aerial view of hotels on the waterfront in Hollywood, Florida, USA.

With COVID-19 restrictions behind us, our team has been hitting the road, meeting over 300 companies in the past two months at conferences and onsite, from India to Chile, from Florida to Whistler. One of the conferences we attended was the 32nd BMO Global Mining & Critical Minerals Conference that took place in Florida from February 26 to March 1.

The largest conference of its kind, it brings together over 350 companies including all the majors: Rio Tinto, BHP, Vale and Freeport-McMoRan. We met over 30 companies and attended various panels.

New this year was inviting critical minerals companies that explore and produce lithium, cobalt, graphite, and other metals. These will be key on the journey to decarbonization, either via battery-electric vehicles or renewable power.

It is always interesting to attend a mining conference. The optimistic nature of management teams, the promotional aspect of companies trying to raise billions to find metal in a pile of rock in a remote area and then building the mines, roads and infrastructure to bring it to production. There are many interesting characters to say the least.

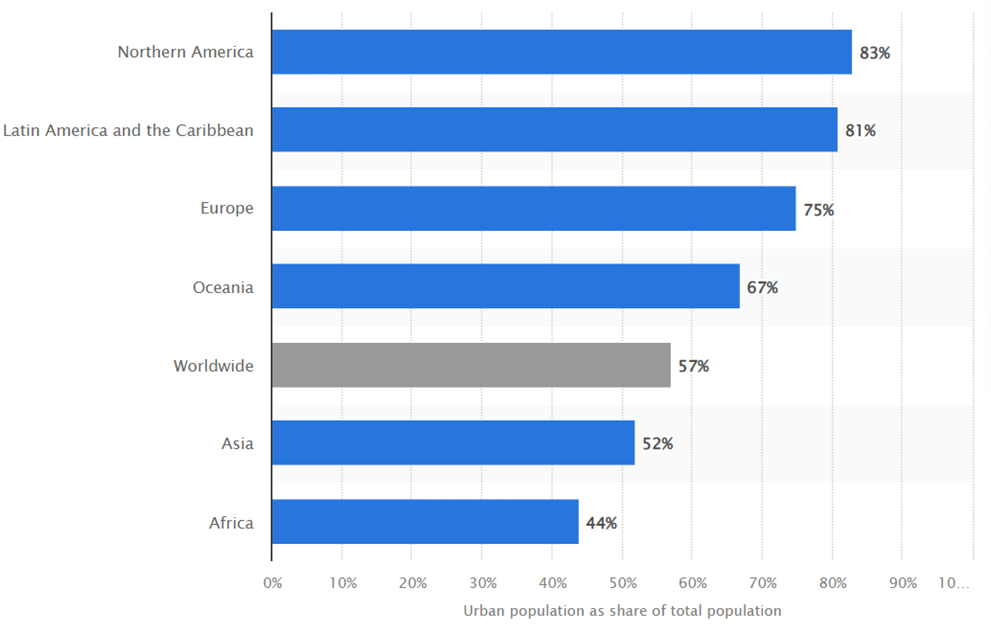
What were some observations and how does it relate to our commentary this week about the battle against inflation? One main takeaway is that the two megatrends of urbanization and the need to reduce carbon emissions to limit the temperature rise are very much intact. China at 64% is probably two-thirds of the way in terms of people moving to cities. As a comparison, the U.S. is at 83% whereas countries like India are only at 36%.

Share of urban population worldwide in 2022, by Continent

Northern America: 83%. Latin America and the Caribbean: 81%. Europe: 75%. Oceania: 67%. Worldwide: 57%. Asia: 52%. Africa: 44%.
Source: United Nations

Urbanization comes with the need to build new infrastructure as well as replace aging infrastructure, some dating as far back as the 19th Century.

An interesting fact is that since the beginning of the Copper Age around 4500 BC, almost 7,000 years ago, 700 million tons of copper has been mined until today. In the next 25 years alone, the world will need another 700 million tons.

Where will we find it? How much will it cost to bring it into production? We can assume it will be a lot more, in other word, inflationary.

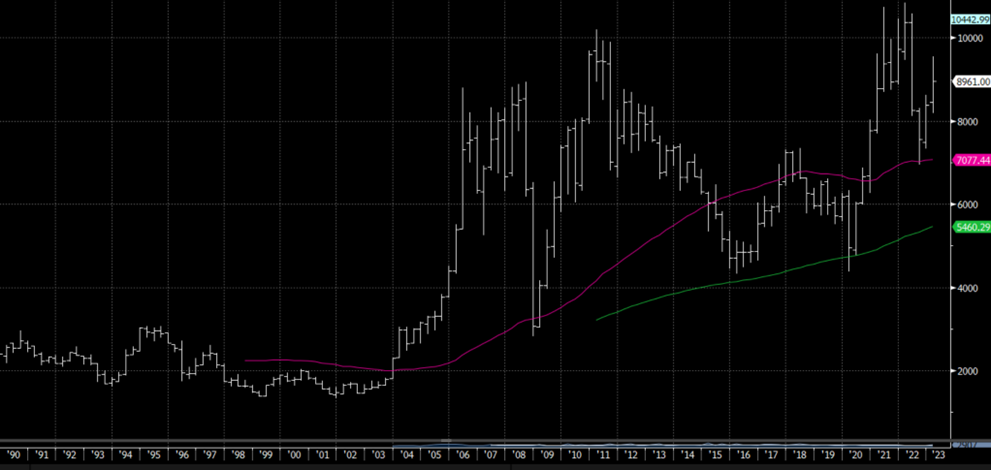
Copper price 1989 to today

Graph showing the dramatic increase of the price of copper from 1989 to 2023.
Source: LME and CRU

This is a long introduction to this week’s commentary. Are the central banks winning the war on inflation?

Earlier this year, market participants thought we had made good progress as we started to see inflation numbers come down from their peaks. We started assuming interest rates had peaked and would even start to decline in the second half of 2023.

Since then, economic data out of the US, Canada, Europe and China has shown:

  • a resilient economy,
  • a confident consumer,
  • strong job creation. And surprise!
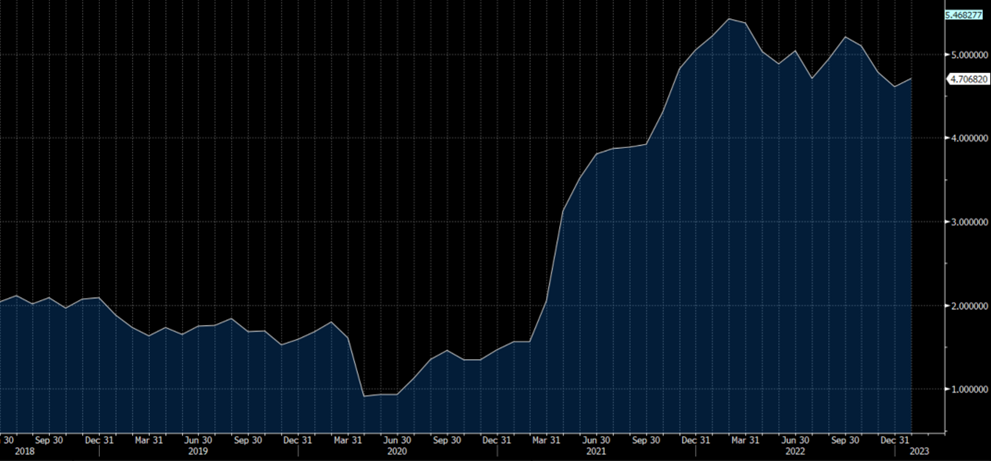
  • an increase in inflation from December to January.

US Personal Consumption Expenditure Core Price Index YoY

Graph showing the increase of US Personal consumption expenditure core price index year over year from 2018 to 2023.
Source: Bureau of Economic Analysis

Obviously, bond and stock markets have retraced much of their positive returns.

Where is inflation headed now?

Let’s focus on the US.

Components and weight in CPI calculation (source Bureau of Labor Statistics)

Food and beverages 14.40%
Housing 44.4% of which owner equivalent rent of residence is 25.4%
Apparel 2.50%
Transportation 16.7% of which 8.1% is new and used vehicle
Medical Care 8.10%
Recreation 5.40%
Education and Communication 5.80%
Other good and service 2.80%

In aggregate, commodities including food and beverage is approximately 41% and services is 59% (includes rent).

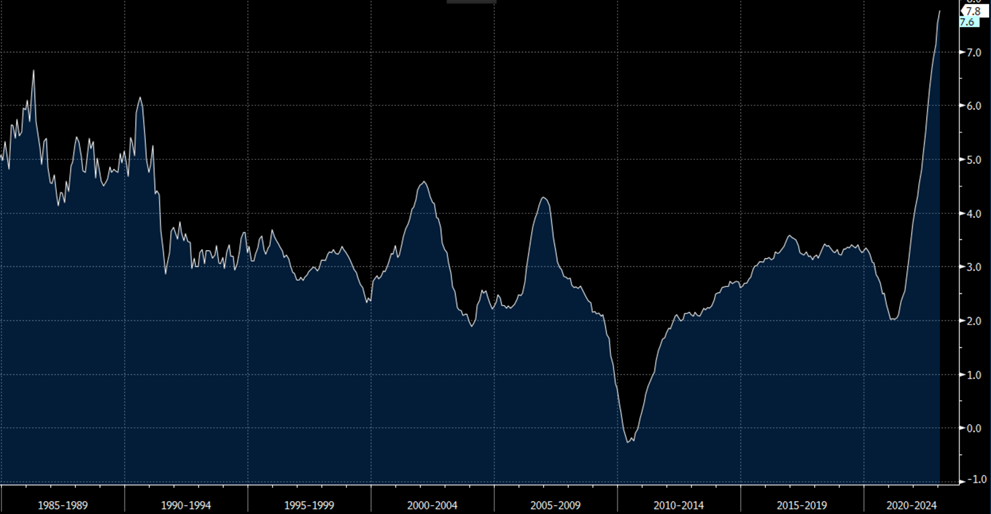
Graph of US CPI Owner Equivalent Rent YOY

Graph of US CPI owner equivalent rent year over year from 1985 to 2023.
Source: Bureau of Labor Statistics

So, as can be seen from the weight of the various components and the chart above, rent will go a long way in terms of determining the direction of inflation. Although we have recently heard of rent peaking, we are still looking at high single-digit increases on a year-over-year basis. Since this data normally lags about six months, we do not expect a large decrease in this measure to bring down inflation. Furthermore, looking at the graph above, it has mostly been above 3%, except the period following the global financial crisis of 2008.

Last December, we were of the view that inflation would still be above 5% at the end of 2023, a view that was not widely shared. Now in March, the data seems to validate our view.

The Fed needs to continue raising rates. How high will they go?

The market now expects a terminal rate at around 5.5% and many funds are buying options where rates may reach 6%.

We still believe the only way to break inflation expectations — which is what the Fed is focused on — is to see slack in the labour market.

That probably means an unemployment rate above 6% and we are far from that level.

With Delta Airlines announcing this week there will be an increase of 34% for its pilots for the period 2023-2026, we are far from seeing wage increases at 2%.

We also need to see home prices decline by 20% or more. Prices are still going up year-on-year and should register their first modest decline by April of this year.

As we wrote last week, the recent rally has been of poor quality. Like in the summer of 2020, unprofitable companies with weak balance sheets have been the best performers.

Our portfolio is well positioned for a more difficult environment in 2023, i.e., much lower economic activity and even a recession combined with higher interest rates.

Toward the end of the first quarter of 2023, we expect a rotation to higher quality companies with little or no debt and the ability to gain market share. We are already seeing green shoots with small cap and international markets outperforming this year.

Luminated office buildings at Canary Wharf, London at night.

Fonds Connor, Clark & Lunn inc. (Fonds CC&L) est heureux d’annoncer le récent lancement d’une version admissible au prospectus du portefeuille concentré d’actions internationales NS Partners, qui est maintenant offert aux investisseurs canadiens. Le Fonds concentré d’actions internationales NS Partners est fondé sur un portefeuille semblable, auparavant offert uniquement aux investisseurs institutionnels et internes.

Le Fonds cherche à procurer aux investisseurs une plus-value du capital à long terme en investissant dans un portefeuille composé principalement d’actions autres que nord-américaines, dont jusqu’à 20 % dans les marchés émergents.

Pour gérer le fonds, Fonds CC&L a retenu les services de NS Partners Ltd (NS Partners), un gestionnaire établi à Londres, au Royaume-Uni, qui compte plus de 30 ans d’expérience dans la gestion de portefeuilles d’actions internationales, y compris des marchés développés et émergents. NS Partners combine un cadre ascendant de qualité et de croissance pour examiner les sociétés au moyen d’une analyse descendante unique de la liquidité à l’échelle mondiale afin de repérer les régions, les pays et les secteurs qui devraient enregistrer des rendements supérieurs ou inférieurs, ainsi que pour déterminer s’il y a lieu de positionner le portefeuille en fonction d’un appétit ou d’une aversion pour le risque.

« Pour les investisseurs dans des portefeuilles d’actions mondiales à grande capitalisation, il existe des arguments convaincants en faveur d’une pondération distincte des actions internationales, compte tenu des problèmes de valorisation et de concentration sur le marché des actions américaines à grande capitalisation et des difficultés liées à la vigueur du dollar américain. En présentant notre portefeuille concentré d’actions internationales de NS Partners sous forme de fonds, nous pouvons offrir une solution attrayante aux investisseurs individuels, gérée par une équipe de placement de calibre institutionnel qui a fait ses preuves et qui adopte une approche différenciée », a déclaré Tim Elliott, président et chef de la direction de Fonds CC&L.

« Nous sommes ravis que notre portefeuille concentré d’actions internationales soit accessible à un plus grand nombre d’investisseurs canadiens. Grâce à notre processus éprouvé, à notre solide feuille de route en matière de placements institutionnels et à notre équipe de placement talentueuse et dévouée, nous croyons que ce portefeuille offrira une solution intéressante aux personnes qui cherchent une croissance à long terme sur les marchés boursiers internationaux. » a déclaré Tim Bray, président et chef des placements de NS Partners.

Fonds CC&L et NS Partners sont des sociétés affiliées du Groupe financier Connor, Clark and Lunn (« CC&L »), dont la structure à multiples sociétés affiliées réunit les talents d’équipes de placement diversifiées qui offrent une vaste gamme de solutions de placement traditionnelles et non traditionnelles. CC&L est l’un des plus importants gestionnaires de placements indépendants au Canada; il gère plus de 104 milliards de dollars d’actifs pour le compte d’investisseurs institutionnels et particuliers.

À propos du fonds

Offert en parts de série A et de série F, le fonds est conforme au cadre réglementaire des fonds communs de placement conventionnels offerts par prospectus simplifié. Les parts du fonds seront vendues par l’intermédiaire de courtiers en placement titulaires d’un permis; leur prix est évalué quotidiennement et elles pourront être rachetées quotidiennement. Le fonds est offert au moyen de FundServ.

À propos de Fonds Connor, Clark & Lunn Inc.

Fonds Connor, Clark & Lunn Inc. (les Fonds CC&L) noue des partenariats avec des institutions financières canadiennes de premier plan et leurs conseillers en placement afin d’offrir des stratégies de placements institutionnelles uniques à des investisseurs particuliers, grâce à une gamme de fonds, de placements alternatifs liquides et de comptes en gestion distincte choisis avec soin.

En limitant sa gamme à un groupe de solutions de placement en particulier, Fonds CC&L est en mesure d’offrir des stratégies uniques conçues pour améliorer les portefeuilles traditionnels des investisseurs. Pour de plus amples renseignements, consultez le site www.cclfundsinc.com.

À propos de NS Partners Ltd

NS Partners Ltd est une société de gestion de placements indépendante qui se spécialise dans la gestion active de portefeuilles d’actions mondiales pour le compte de grandes entreprises, de caisses de retraite, de fondations, de fonds de dotation et de fonds souverains. NS Partners Ltd est membre du Groupe financier Connor, Clark & Lunn, une société de gestion de placements dotée d’une structure multientreprise. Pour obtenir de plus amples renseignements, consultez le site www.ns-partners.co.uk.

À propos du Groupe financier Connor, Clark & Lunn Ltée.

Le Groupe financier Connor, Clark & Lunn Ltée (Groupe financier CC&L) est une société de gestion d’actifs indépendante à multiples sociétés affiliées qui offre une vaste gamme de solutions de gestion de placements traditionnelles et non traditionnelles aux investisseurs institutionnels et individuels. Le Groupe financier CC&L procure une envergure et une expertise considérables qui permettent d’assumer des fonctions administratives qui ne sont pas liées aux placements tout en laissant les gestionnaires de placement se concentrer sur ce qu’ils font le mieux grâce à la centralisation des activités liées aux opérations et à la distribution. Les sociétés affiliées du Groupe financier CC&L gèrent un actif de plus de 104 milliards de dollars. Pour obtenir de plus amples renseignements, consultez le site www.cclgroup.com.

Personne-ressource

Lisa Wilson
Directrice, Produits et service à la clientèle
Fonds Connor, Clark & Lunn Inc.
416-864-3120
[email protected]

View of Abu Dhabi Skyline at sunset, United Arab Emirates

 Gulf equity markets rolled over in the fourth quarter and materially underperformed emerging markets. This marks a stark but predictable (as we wrote in our last Q3 letter) reversal in fortunes, with tailwinds of the outperformance in the last 18 months turning to headwinds. We summarize the key drivers of the weakness in Gulf equity markets in the fourth quarter below:

  1. Lower oil price and a different transmission mechanism – Gulf economies are highly levered to oil prices. While a Brent oil price of $80 is healthy for most Gulf economies, surpluses will naturally be lower as prices come down and barrels produced and sold remain static. Moreover, and focusing on Saudi Arabia, the share of oil revenue proceeds going into the banking system has come down considerably as the government allocates an increasing proportion of oil revenue to its sovereign wealth fund where the trickle down to economic activity is seemingly less visible (for now).
  1. Higher interest rates – Gulf currencies are effectively pegged to the U.S. dollar and central banks have had to adjust to the Fed’s four rate hikes of 75 basis points in 2022. The relative attraction of owning equities with three months SIBOR rates reported at 5.59% is understandably low. Gulf investors have more alternatives than ever before to invest their money, with the recent Al Rajhi Bank Sukuk proving to be particularly popular among retail investors. Higher rates are also putting pressure on the net interest margins of banks as they compete to attract deposits. This phenomenon is likely to be especially acute in Saudi Arabia, where the liquidity environment has tightened n the fourth quarter of 2022. Saudi banks represent ~23% of most MENA indices and so the aforementioned profit margin compression has a material impact on the market’s aggregate EPS growth expectations for 2023. In other Gulf markets like the UAE and Qatar, state and quasi-state companies have been pre-paying debt at a rapid pace to avoid higher interest rates, leading to anemic corporate loan growth and further pressure on profitability.
  1. Weaker USD – Gulf equities are effectively US dollar-denominated assets and are generally more attractive for global investors when the U.S. dollar is appreciating. This relationship has become stronger since Gulf equity markets became a large component of emerging market indices. Active Global Emerging Market (GEM) investors are not incremental buyers of Gulf equities in a weaker USD environment and their current underweight exposure to the region suggests they prefer to own assets denominated in non-pegged currencies.
  1. Valuations – Gulf equity markets are coming off excessive valuation levels that reflected over-optimism on the degree and timing of the impact of reform program announcements, and robust foreign inflows following the deletion of Russia from the emerging market universe in March 2022, which we discussed in our second quarter letter.
  1. A wall of offerings – 2022 was a record year for capital raised through primary and secondary transactions and the number of deals closed in the region with 47 listings raising a total of $26.5 billion. A large number of deals and the prospect of share sales by government and quasi-government shareholders took the air out of the market. We think it is wise for government funds to reduce or float their stakes in strategically listed companies given the level of ownership is far above what is required to retain control. However, this is likely to weigh on the share prices of many of the large-cap companies in the market where those entities are key shareholders. On a lighter note, overexcited bankers salivating at the prospect of fees from investment banking deals continue to be a reliable indicator of negative future market performance.

 As for the strategy, we managed – to a large extent— to avoid the significant drawdown that the region experienced in the fourth quarter. Three factors helped us achieve this outperformance:

  1. Sticking to high conviction portfolio companies like Saudi Dairy and Food Co. (SADAFCO) where management execution and weaker competition are leading to significant earnings growth that the market has been behind on for a few quarters now. 
  1. Adding to high conviction portfolio conviction companies that we believe are likely to experience an improvement in an operating environment like the National Company for Learning & Education (NCLE). NCLE’s eleven K-12 schools are experiencing a noticeable increase in utilization as students return to in-person learning in Saudi Arabia and management’s various initiatives (which focus primarily on quality of education in existing schools, M&A and greenfield for new schools) bear fruit.
  1. Reducing or exiting portfolio companies we believe have reached valuation levels that are no longer attractive. A good example of this is Saudi Tadawul Group (STG), the country’s stock exchange which we exited at nearly peak average daily traded value. Over 60% of STG’s revenue is linked to traded values on the stock exchange and our exit decision reflected an understanding that traded values cannot just continue to go up, a view that the market is only getting around now as traded values have dropped 50% y-o-y in recent months.

 We continue to see a strong opportunity for the strategy as the market begins to reflect the “bad news” in the price of assets we like, and as investments in companies we’ve made in the last 6-12 months or earlier continue to deliver. 

 While we acknowledge that the environment has been favourable for the strategy, and decisions we made have on the whole been good ones, we are not resting on our laurels and will endeavor to continue delivering differentiated value-added returns for our clients looking to access the growing investable opportunity in the MENA region. 

Vergent Asset Management LLP

Early evening shot of Makati skyline. Makati, Metro Manila, Philippines.

As this quarter marks the final letter for the year 2022, we thought it will be helpful to reflect on the key events that shaped the performance of the strategy in the year.

Economics 

The war in Ukraine, and the resulting spillover into higher energy and food prices, exposed structural imbalances that resulted in spiraling inflation and currency depreciation across most markets. Our focus on African and Asian companies and through-the-cycle underwriting process put us at a disadvantage as food and oil prices experienced sharp and sustained inflation.

The consumer basket in our markets is over-indexed to those basic commodities, and the fiscal and balance of payment dynamics of most developing countries (where we exclusively invest) are inversely correlated to commodity prices. In response, we identified the most vulnerable countries in the portfolio and made decisions to exit two companies in Egypt and one in Pakistan, and selectively reduce exposure to Kenya. We highlighted in our third quarter letter that our portfolio companies experience a net positive carry in a higher rate environment, as most hold more cash than debt. Where there is debt, it is mostly in local currency or otherwise matched with foreign currency income. Of the top ten companies in the portfolio, seven enjoy a net cash position.

Despite active portfolio management that reduced exposure to the most vulnerable countries, and defensive portfolio attributes, returns were still dramatically overwhelmed by the impact of currency moves. Around 47% of the strategy’s returns in the year can be explained by foreign currency depreciation against the US dollar, with notable currency devaluation in the Egyptian pound, Pakistani rupee, and the Ghanaian cedi.

Politics

The strategy experienced volatility from the onset as political unrest in Kazakhstan in January led to a meaningful drawdown in the share price of Kaspi.Kz, a fairly sizable position for the strategy. Since then, Kazakhstan’s political outlook has materially improved. On the domestic front, Kassym-Jomart Tokayev secured a second term in a snap election held in November, cementing his position against political rivals from the previous regime. On the foreign policy front, Tokayev seems to have navigated the Russian-Ukraine crisis as well as anyone expected, striking a neutral position that preserved his country’s deep-rooted ties to Russia, while constructively increasing diplomatic and economic engagement with the West and China. Our team visited Kazakhstan in May where we visited with Kaspi.Kz management, their main bank competitor, and other relevant stakeholders. Our visit was instrumental in reinforcing our constructive thesis on Kaspi.Kz, which we then translated into opportunistic buying of the shares at what we deemed to be deeply discounted valuations. Fortunately, this helped turn a 38% drop in the share price of Kaspi.KZ in 2022 to a flat performance contribution to the strategy in the same year. 

Kenya and the Philippines, key markets for the strategy, also held presidential elections this year. In Kenya, a peaceful election held in September saw power seamlessly transition to President-elect William Ruto, a testament to the democratic process, and the strength of institutions, in the East African country. President Ruto’s policy priority to reduce debt and improve Kenya’s fiscal position is negative for near-term growth but essential for sustainable long-term economic growth. His pro-trade stance, and his visit to neighbouring Addis Ababa for the national launch of Safaricom’s operations in Ethiopia, signal a commitment to preserving and expanding Kenya’s role as an economic and diplomatic hub for the region. It is worth noting that this political progress has not had the hoped-for effect on Kenyan equities, where weak macroeconomic conditions and dwindling stock market liquidity are prevailing. In the Philippines, Ferdinand Marcos Jr., the namesake son of the late dictator, was elected President in an election held in May. While many Filipinos are skeptical of Macros Jr.’s abilities and are understandably wary of his family’s history, his appointment of well-regarded technocrats in key economic roles has been a bright spot. While policy under Marcos, just like his predecessor Rodrigo Duterte, is probably going to remain uninspiring, it is fair to conclude that a Marcos presidency is, on the whole, positive for Filipino equities. 

Earnings vs. Valuations

Reassuringly, earnings from key portfolio companies remained resilient in the year, reflecting elements of quality we expected when we underwrote those investments. We calculate that the strategy’s top 10 holdings experienced an average of 17% growth in revenue and earnings per share in the first nine months of 2022, compared to the same period in 2021. Even when there were setbacks in earnings, operating metrics were exceptionally strong for certain portfolio companies. Take Safaricom as an example; while EBITDA and EBIT were down 4% and 11% year-on-year respectively, the company’s M-Pesa ecosystem continued to grow from strength to strength, producing 32% growth in transaction volumes and signalling continued adoption by Kenyan consumers of M-Pesa in their daily lives. More importantly, most portfolio companies are guiding for a better year ahead, which bodes well for earnings visibility in the next six to twelve months. 

With earnings being resilient and share prices coming down, multiples on the portfolio have come down to the level of ~10x Price to Cash Flow (P/CF). This multiple should be put in the context of a Return on Equity (ROE) that is well above 30% for the overall portfolio. This undervaluation has not gone unnoticed by the insiders of some portfolio companies; insider buying in the shares of Integrated Diagnostics Holdings in the third quarter, share buybacks from Kaspi.Kz in the last nine months, and a tender offer from Diageo for the minorities in East African Breweries in October (at a 30% premium) are all evidence of value recognition by the ultimate insiders.

Outlook

We are optimistic on the strategy’s performance in 2023. We highlight four key factors we believe can shape the outlook for performance:

With the U.S. dollar appreciation cycle potentially peaking, the pressure on currencies in most of our markets has abated, and we think it is unlikely we will see any meaningful negative contributions from currencies like the Indonesian rupiah, the Filipino peso, and the Moroccan dirham. In vulnerable countries like Egypt and Pakistan – where the strategy does not have much exposure— central banks are doing away with unhealthy currency management and letting market forces be the primary driver of the FX rate. This is a positive move that will open investment opportunities for the strategy in 2023.

Inflationary pressures have abated on food and certain commodities. While prices remain high by historical standards, we believe consumers, businesses, and governments have taken the brunt of the pain in 2022. The normalization of supply chains from the reopening of China should result in lower supply-side inflation and release the pressure on some of our companies to hold larger than normal inventory levels, which will increase cash conversion.

The domestic political picture is fairly stable after a busy 2022. This bodes well for policy visibility in 2023 and beyond. We expect policy to generally be pro-business and positive for equities. Looking forward, we expect the Indonesian general elections in February 2024 to be a positive catalyst for the strategy’s Indonesian portfolio in the second half of 2023.

The starting point for valuations is considerably low relative to the earnings power and visibility of portfolio companies. In other words, there is a fair amount of downside that is priced in. We are seeing insiders act on those valuation levels and consider that to be a strong bullish signal.

Finally, it is worth reminding readers that our objective is to deliver differentiated returns that can be attributed to the skill of investing (alpha) over the directionality of markets (beta). We believe there is an abundant alpha opportunity in frontier and emerging markets, which we choose to express through a concentrated but geographically diverse portfolio of companies with idiosyncratic earnings drivers and share price catalysts. Naturally, this should result in significant deviations from global and emerging market indices in certain periods, but hopefully provide a superior risk-adjusted return profile to investors in the long term.

Vergent Asset Management LLP

Aerial view of oil refinery at sunset, Austria.

Europe’s economic outlook has seen a clear improvement in less than three months. The risk of a gas shortage in Germany has disappeared at least for 2023. Thanks to a decrease in energy usage and some industrial delocalization outside Germany, Europe’s energy consumption has decreased by 19% since last summer. According to the ZEW – Leibniz Centre for European Economic Research, economic sentiment indicators rose to 28.1 for a fifth consecutive month, 11.2 points above the level of the previous month. Service PMIs reading also beat all expectations and posted decent growth in both continental Europe and the UK.

As demand stays firm and China reopens, there will be growing pressure on central banks to hike rates further to contain demand. Inflation has just started to cool off in Europe, but levels are still elevated. Consequently, interest rates could stay higher than expected for some time.

Here are some observations following some earnings results that came out for Q4 (2022):

  • Q4 earnings and top-line growth declined sequentially but held up well, given the still solid demand and pricing.
  • Companies expressed more optimism for the global economy but were incrementally more cautious on margins levels, foreign exchange tailwinds and demand for 2023.
  • A lower proportion of companies mentioned having enough pricing power to pass on inflation in the short term.
  • Labour cost component is becoming the primary source of concern on the cost side, as supply chain and energy costs have come down considerably.

We believe that the old continent prospects look better than they appear. Some of the highlights and attractiveness of European companies include:

Forward price-to-earnings ratio

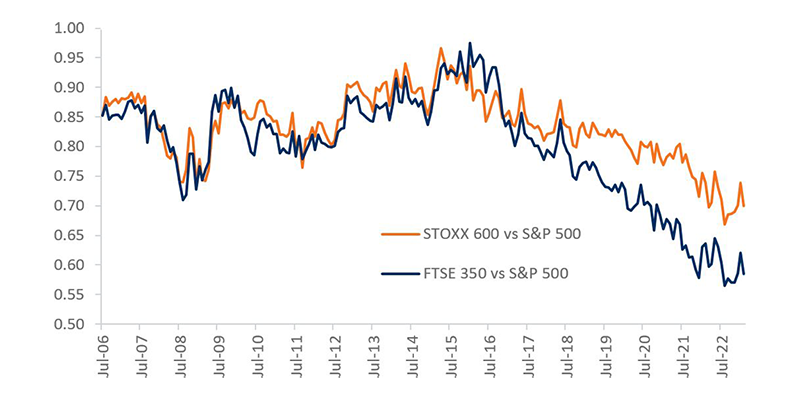
Forward price-to-earnings ratios for European companies have been attractive relative to the S&P 500. The discount has been even stronger for the UK FTSE 350 Index as shown below.

STOXX 600 and FTSE 350 12-month P/E forward relative to S&P 500

Forward price-to-earnings ratios chart for STOXX 600 and FTSE 350 relative to the S&P 500 over the month of July.
Source: Berenberg

Cash positions

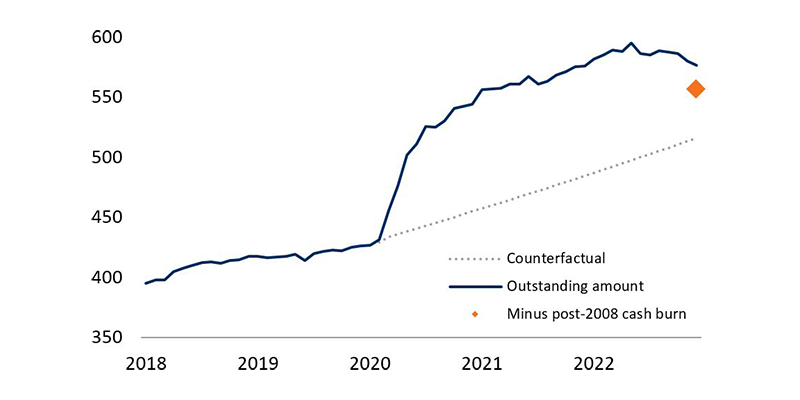
Cash piles have been quite considerable since the global financial crisis, and especially in the UK post-Brexit. Geopolitics and macroeconomics have pushed UK companies to increase their cash positions to more than £576 billion at the end of 2022. We believe that once confidence returns, capital spending should resume.

Deposit of UK non-financial institutions (£bn)

Cash deposits of UK non-financial institutions in billions of euros from 2018 to 2022.
Source: BoE, Berenberg

Debt levels

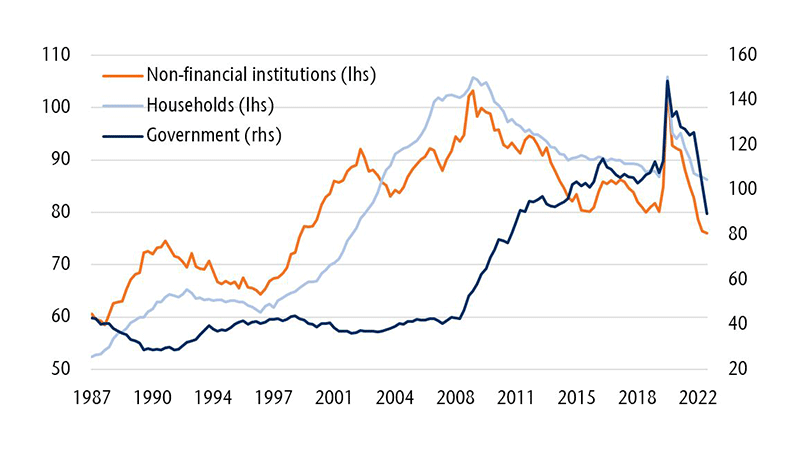
Balance sheets have improved across all segments in both the UK and continental Europe. Thanks to stronger GDP levels driven by inflation, debt levels as a percentage of GDP decreased to levels last seen in 2009. Corporate debt levels even returned to 2007 levels.

Outstanding debt in % of GDP

Outstanding debt in percentage of GDP from 1987 to 2022.
Source: ONS, Berenberg

A Eurozone recession can now be ruled out, according to the ECB and a PMI-hugging consensus. 

Someone forgot to tell the monetary data. 

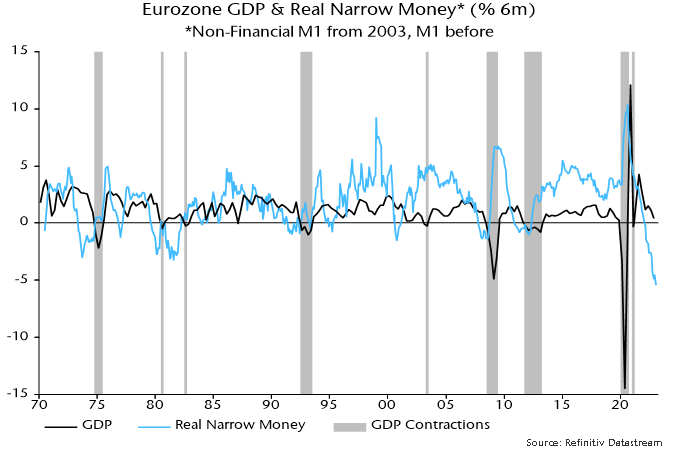
The favoured Eurozone narrow money measure here – non-financial M1 – fell for a fifth consecutive month in January, while broad money – non-financial M3 – was unchanged following marginal gains in November / December. 

With inflation data remaining hot, six-month contraction of real narrow money (i.e. deflated by consumer prices) reached a new record, of 5.4% or 10.5% annualised – see chart 1.

Chart 1

Chart 1 showing Eurozone GDP & Real Narrow Money* (% 6m) *Non-Financial M1 from 2003, M1 before

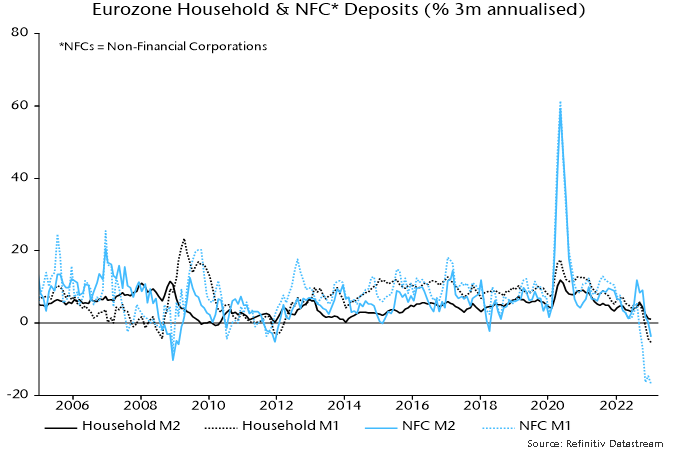
post last month noted that UK sectoral money trends were displaying a recessionary pattern: corporate broad and narrow money holdings were falling in nominal terms, suggesting a cash flow squeeze, while households were moving large sums out of time deposits into sight deposits, consistent with a shift in consumer behaviour from spending to saving. 

The same trends are now on show in the Eurozone: corporate M2 and M1 deposits fell in the three months to January, as did household M1 deposits – chart 2. 

Chart 2

Chart 2 showing Eurozone Household & NFC* Deposits (% 3m annualised) *NFCs = Non-Financial Corporations

The no-recession bandwagon gained momentum following Eurostat’s flash estimate that Eurozone GDP grew by 0.1% in Q4. Recently released national details paint an uglier picture. 

The Q4 fall in German GDP was revised from 0.2% to 0.4%, which will feed into an updated Eurozone number next week. 

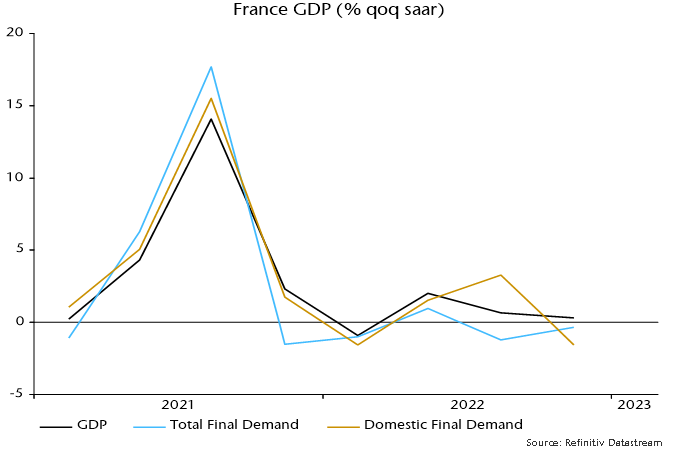
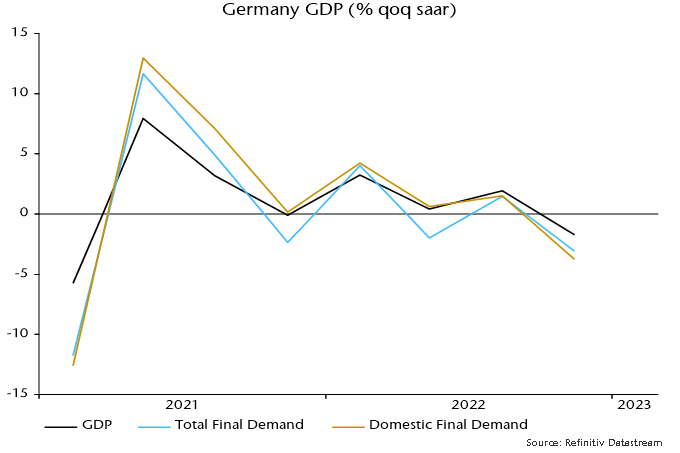
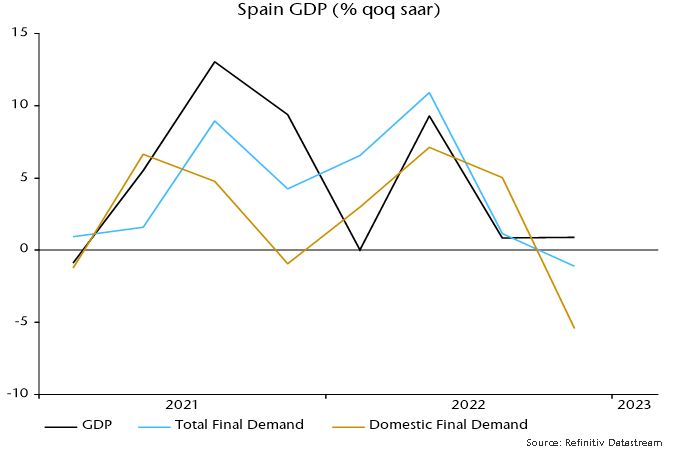
More significantly, expenditure breakdowns show that domestic final demand weakened sharply in Q4 in France, Germany and Spain – at annualised rates of 1.6%, 3.7% and 5.4% respectively. The GDP impact was cushioned by a rise in net exports driven by import weakness and a further increase in stockbuilding – charts 3-5. 

Chart 3

Chart 3 showing France GDP (% qoq saar)

Chart 4

Chart 4 showing Germany GDP (% qoq saar)

Chart 5

Chart 5 showing Spain GDP (% qoq saar)

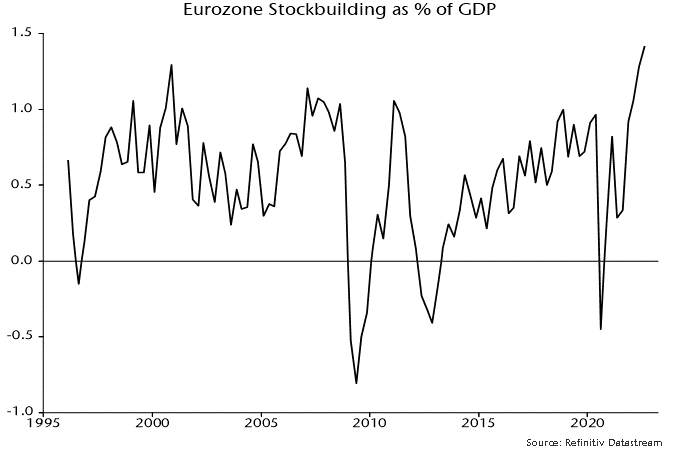
Eurozone stockbuilding, therefore, appears to have risen further from its record (in data since the mid 1990s) share of GDP in Q3 – chart 6. A violent reversal from lower peaks in 2007 and 2011 was a key driver of the 2008-09 and 2011-12 recessions. 

Chart 6

Chart 6 showing Eurozone Stockbuilding as % of GDP

The no-recession narrative was bolstered by February PMI results showing a pick-up in Eurozone services activity and new business. Manufacturing new orders, however, remained contractionary and are a better guide to the cyclical trend (since the key economic cycles – stockbuilding, business investment and housing – involve goods demand; there is no independent services cycle). 

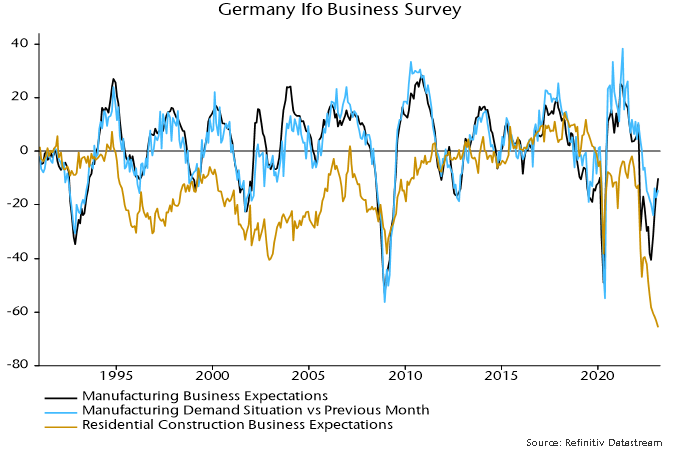
The move off the lows in manufacturing PMI results has been mirrored in the German Ifo manufacturing survey. Business expectations, however, remain weak by historical standards and an indicator of demand inflow has risen by less, stalling between December and February – chart 7. 

Chart 7

Chart 7 showing Germany Ifo Business Survey

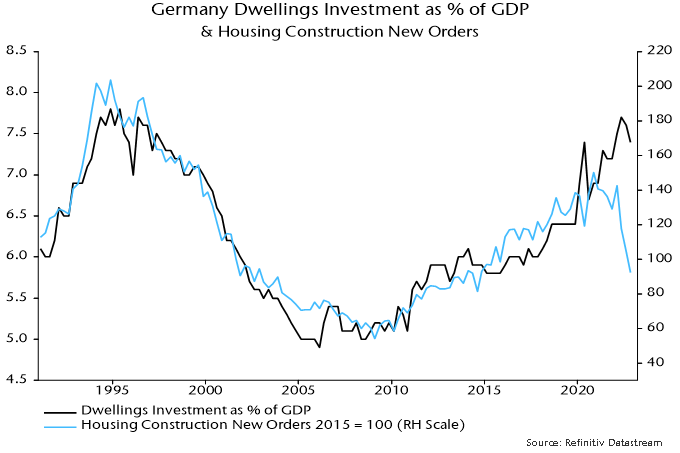
Residential construction expectations, meanwhile, plumbed another record low in February. Survey weakness has been reflected in hard data: housing construction new orders in Q4 were down 35% from Q1 and the lowest since 2014. Dwellings investment was a drag on GDP during H2 2022 but the orders plunge suggests a further big negative impact to come – chart 8.

Chart 8

Chart 8 showing Germany Dwellings Investment as % of GDP & Housing Construction New Orders
Empty theatre seats with 2 bags of popcorn in the two front seats.

January was a strong start to the year for equity markets. In fact, the Nasdaq is off to its best start since 1991. Given that lenders (banks) are building reserves to prepare for a recession, and the money printers (central banks) are trying to cool the economy, the strength of equity markets seems to defy logic. It’s as if financial markets are completely ignoring the recession nipping at our heels. What’s driving this?

You guessed it: much of the January returns were powered by a trash rally. We’re talking about low-quality, high volatility stocks driven up by retail investors and internet frenzy.

Source: Sain Godil’s phone

What defines a trash rally?

Remember the GameStop phenomenon of January 2021? This is a textbook example of a trash rally. A near-bankrupt company saw its stock skyrocket thanks to a bizarre retail trading frenzy and a rash of internet jokes and memes. This resulted in a significant and illogical increase in stock price (trash rally) and the origins of the term “meme stock.”

Meme stocks are defined by several key characteristics:

  • low ROE
  • negative earnings
  • high leverage
  • low market cap
  • high short interest
  • weak leadership

The current trash rally is being fueled by a resurgent risk appetite among some investors. We’re seeing explosive growth in a variety of meme stocks this month after a crushing year for equities, although many analysts are skeptical the most recent moves will last.

A closer look at the data

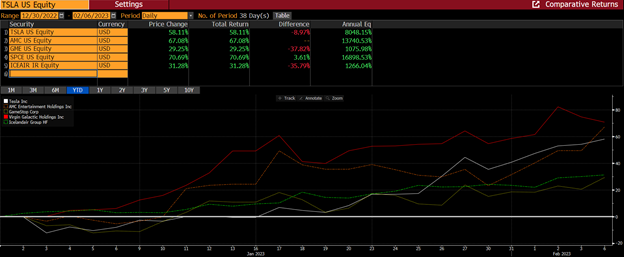
According to JP Morgan, retail market orders reached 23% on Jan 23, 2023. To put things in perspective, when the original GameStop saga began, retail trading peaked at 22%. The result of this euphoria can be seen below with the year-to-date performance of these high beta stocks including some indexes that replicate low-quality stocks.

How has the performance been since January 2022

Source: Global Alpha Capital Management and Bloomberg

How are those meme stocks doing since January 2022?

Two years ago, we were all stuck at home, feeling bored, and getting a false sense of financial security from stimulus checks. With sports events and gambling closed, retail investors made the stock market their casino. While some retail investors made a fortune, unfortunately, many lost a lot. The above charts (blue bars) show how most of the names have been cut in half, if not more.

Management teams of many meme stocks took advantage of the inflated stock prices to issue more equity and improve their finances. According to the Financial Times, meme stocks have raised over $4.7 billion from the hype.

AMC, a poster child for meme stocks, raised $2.8 billion from sales of equity and new debt. Fundamentally their business has not improved with current sales below 2018 revenue, and EBITDA is expected to be half of what they did in 2018. This is despite the fact that Avatar: The Way of Water is close to collecting $2 billion in global box office ($623.5 million in the U.S.).

Here we go again

All signs point to another meme stock rally. Take troubled retailer Bed Bath & Beyond, for example. They missed interest payments on bonds on Jan 29, which may lead to bankruptcy, and yet the stock price appreciated by 129% in just over a week. Carvana, the debt-strapped online used-car retailer is up 143% year-to-date. A meme stock favourite, Carvana was trading at $11.55 at the point of writing, way below its peak of $370 set in August 2021. Despite being down almost 98% from its peak, more than 266,000 call contracts changed hands on January 30, 2023 according to Bloomberg.

Is this just a U.S. Phenomenon?

The Bonusetu (a Finnish Casino) research team combed through Google trends for each European country to find the most Googled stock for each country. Tesla took the top spot in a whopping 28 countries and AMC is most popular in five countries. Below is a screenshot or performance of some other names in the group.

While we understand Google trend data does not necessarily mean Europeans participated in the trades, it’s difficult to imagine an alternative explanation. Was everybody in the UK, Germany, Ireland, and Croatia just purchasing tickets to watch Avatar at an AMC theatre? Or booking their next vacation on Icelandic Air or Virgin Galactic? It seems far more likely they were getting seduced by meme stocks.

Will history repeat itself?

Once again euphoria has set in and everyone is having a good time, gleefully ignoring the well-documented consequences of excessive indulgence. We’ve seen this story play out several times over the last few decades. Think back to 2001. That year, Nasdaq was up 12% in January but fell over 30% in the following 11 months when the dot-com bubble burst. In our February 11, 2021, weekly called The Canary in the Coal Mine we compared the meme stock situation to the tech bubble as well as the 2008 financial crisis.

Portfolio Impact

Popular media is once again helping stir up the meme stock frenzy. As we see a repeat of the same movie (no pun intended, AMC) this may have an unfortunate impact on higher-quality names that could get mispriced lower. The good news? For long-term investors in quality companies, this provides an amazing opportunity to buy quality companies at attractive valuations.

Our ability to be highly selective and nimble in our portfolio holdings leaves us well-positioned to enter a period of great opportunity for fundamental stock pickers. Our focus on high-quality companies with defensible business models and strong balance sheets should help outperform our small-cap benchmark. As we reflect on the state of markets and the fundamentals of our target companies, we are excited about the current environment and future growth opportunities.

The two measures of global “excess” money tracked here remain negative, arguing for a cautious view of equity market prospects. 

Excess (or deficient) money refers to the difference between the actual money stock and the demand for money to support economic transactions. According to “monetarist” theory, a surplus is associated with increased demand for financial / real assets and upward pressure on their prices, assuming no change in supply. 

Excess money is unobservable so two proxies are followed here: the difference between six-month rates of change of global (i.e. G7 plus E7) real narrow money and industrial output; and the deviation of 12-month real narrow money growth from a slow moving average. 

Historically (i.e. over 1970-2021), global equities outperformed US dollar cash on average only when both measures were positive. Unsurprisingly, average performance was worst when both were negative (underperformance of 8.9% pa). These results allow for reporting lags in monetary / economic data. 

The second measure turned negative in October 2021, which was known by end-November. The first measure followed in November, which was known by end-January 2022 (a longer lag because industrial output numbers are released after monetary / CPI data). 

Previous posts noted a recovery in global six-month real narrow money momentum during H2 2022*. With industrial output expected to weaken, it was suggested that the first measure would turn positive, possibly by December. 

The second measure – based on 12- rather than six-month real money momentum – was deeply negative in late 2022, with a switch to positive deemed unlikely before mid-2023. 

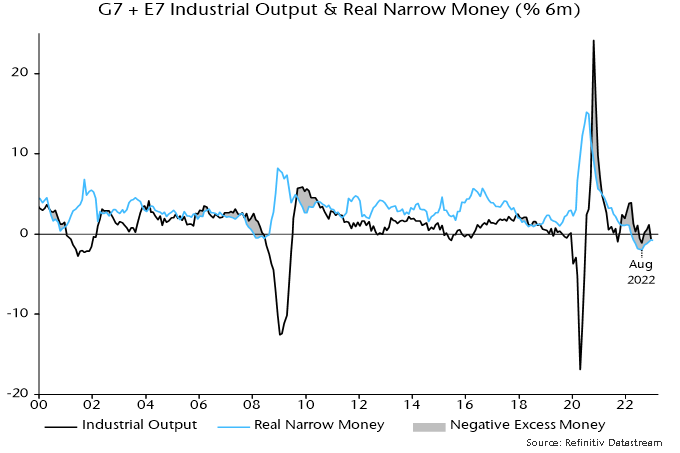
The suggested switch positive in the first measure has yet to occur. The six-month rate of change of industrial output crossed below zero in December but remained just above real narrow money momentum – see chart 1. 

Chart 1

Chart 1 showing G7 + E7 Industrial Output & Real Narrow Money (% 6m) highlighting August 2022

Will a cross-over have occurred in January? Partial data suggest that the recovery in real money momentum stalled last month. A reliable January estimate of industrial output won’t be available until mid-March. A reopening bounce in China could offset weakness elsewhere. 

A further point is that the recovery in global real narrow money momentum since mid-2022 partly reflected a strong pick-up in Russia, which may be of limited global relevance given the country’s enforced economic and financial isolation. 

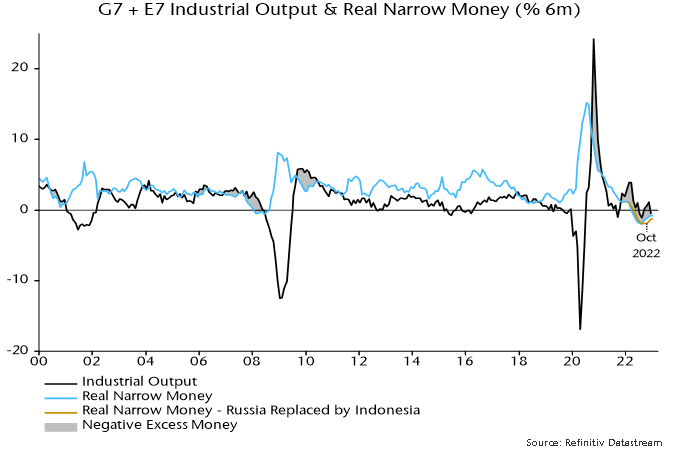
Chart 2 shows the result of replacing Russia with Indonesia in the G7 plus E7 real money calculation from January 2022, before the February invasion of Ukraine**. The trough in real money momentum is placed in October rather than August, with the subsequent recovery even more anaemic. 

Chart 2

Chart 2 showing G7 + E7 Industrial Output & Real Narrow Money (% 6m) highlighting October 2022

*The trough in real money momentum originally occurred in June but is now placed in August, partly reflecting revisions to US CPI seasonal adjustments.

**The other E7 countries (as defined here) are Brazil, China, India, Korea, Mexico and Taiwan.