Man looking ahead at the Shanghai skyline.

Summary

  • Emerging market equities notched a positive month despite the fears over cracks appearing in developed market banking systems with the failure of Signature Bank, Silicon Valley Bank and the UBS takeover of Credit Suisse.
  • Chinese equities steadied in March, slightly up as the two sessions (China’s equivalent of parliament) rubber stamped Xi’s unprecedented third term as leader, and Li Qiang’s ascent to the role of Premier. Li was keen to tout China’s business-friendly credentials in his first remarks as premier.
  • This was followed later in the month by Jack Ma’s return to Hangzhou, China, the home of Alibaba HQ. This was followed shortly after by an announcement by the company that it would be split into six units. According to Alibaba CEO Daniel Zhang, the units will be able to “pursue independent fundraising and IPOs when they are ready.”
  • This provided a major boost to large cap Chinese tech stocks, with investors interpreting the announcement as further confirmation that regulatory headwinds for the sector were easing.
  • Portfolio names Alibaba, Tencent and Netease all rallied sharply.
  • Stocks in Taiwan and South Korea were stronger, in part due to some optimism that the deep downcycle across the semiconductor industry is starting to bottom.
  • Brazil underperformed wider emerging markets. Despite falling inflation and scope for the central bank to consider rate cuts, political risks continue to curb investor enthusiasm. President Lula’s scepticism of central bank independence and a free spending fiscal agenda are key concerns which muddle a potentially compelling opportunity for investors.
  • Gulf markets were weak, as headwinds build for energy prices and other commodities given the deteriorating global economic outlook.

Navigating booms and busts in China

Given the wide dispersion of country returns in emerging market equities each year, we know that outperformance hinges on finding the right stock in the right country. As the below chart illustrates, great stock fundamentals can be wiped out by poor macro.

Dispersion of EM country returns
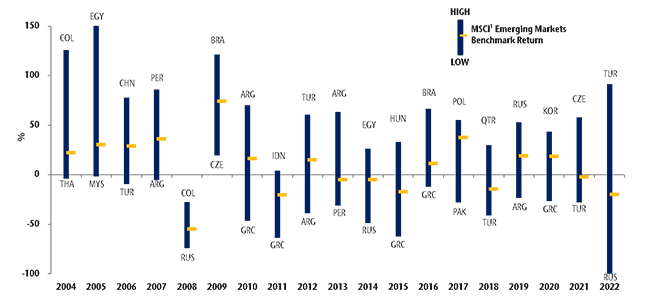
Chart 1: Emerging market returns by country from 2004 to 2022.
Source: Thomson Datastream.

The opportunity to gain exposure to high-quality companies operating in an economy delivering structural outperformance – such as India at present – is a key attraction of emerging market equities. However, experience teaches us that it is through avoiding big negative macro shocks in EM that we can sustainably tilt the odds in our favour.

Our approach to country analysis centres on two elements: 1) hard data inputs with monetary aggregates at the heart of this; and 2) qualitative macro analysis incorporating an assessment of shorter-term factors such as political risk and longer-term structural factors like institutional quality.

This piece will focus on the quantitative element, and specifically the role that the Liquidity Theory of Asset Prices plays in country selection.

Emerging markets and the Liquidity Theory of Asset Prices

Analysis of monetary (or liquidity) data is a key input in our process for determining country weightings. This is based on the insight that, while we know that monetary trends lead the economy, “excess” money – the difference between the growth of real money supply and industrial output – moves markets even earlier. Broadly speaking, when narrow money is growing above industrial production, you are probably in a bull market somewhere as money not put to use in the real economy finds its way into bonds, stocks, property and other assets. The reverse also applies, with current weakness in financial markets reflecting a deteriorating liquidity picture as hot inflation and tight monetary policy suck money out of markets.

G7 + E7 industrial output & real narrow money (% 6m)
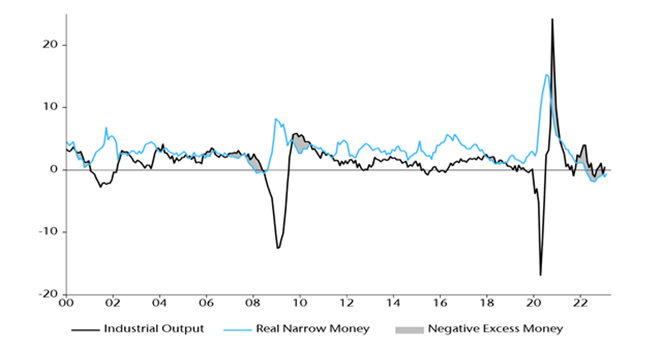
Chart 2: Graph showing G7 and E7 industrial output relative to real narrow money from 2000 to 2022.
Source: Thomson Datastream.

Applying Liquidity Theory in EM equities

We have found this to be a powerful leading indicator and tool for assessing the optimal country exposure through economic and market cycles. In emerging markets this works particularly well as we analyse liquidity country by country in a wide and diverse opportunity set.

Over the decades our team has compiled data on the sensitivity of individual countries in EM to varying liquidity environments. This helps us gauge whether the tide is coming out or in for a country’s financial markets. While this data provides signals for which markets might be winners over the medium term, we find that it adds the most value in providing warning signs of vulnerabilities that precipitate market shocks. You do not want to be around in a country like Argentina or Turkey when the liquidity tap shuts off.

Key input for managing China exposure

Liquidity analysis has been central to managing our portfolio exposure in China. As the chart illustrates below, observing the change in real narrow money growth is a key input for anticipating periods of out- or underperformance for the largest component of the EM benchmark. This is married up with qualitative macroeconomic research and in-depth economic value added stock analysis to determine exposure that aligns with our level of conviction.

MSCI China price index relative to MSCI EM & NS Partners’ active weight in China + Hong Kong
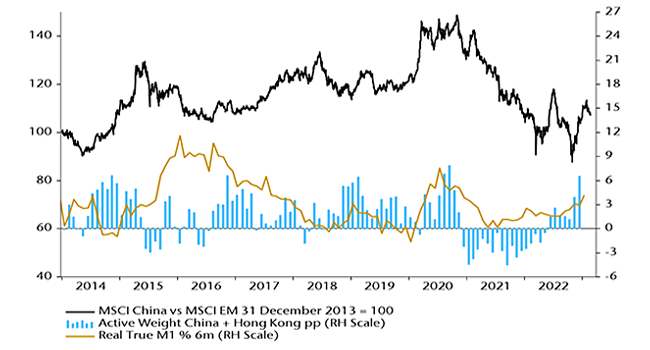
Chart 3: MSCI China Price Index relative to MSCI Emerging Markets Index and NS Partners’ active weight in China and Hong Kong from 2014 to 2022.
Source: Thomson Datastream.

Successfully navigating the violent boom and bust of Chinese equities from 2014 through to mid-2016 demonstrates the effectiveness of this approach. Improving narrow money through the beginning of 2014 preceded a lift in exposure to China as the market began to outperform. Conversely, money numbers deteriorated from mid-2014, a warning sign that the rally was on borrowed time. This formed part of our decision to begin cutting exposure ahead of the market peak in June 2015. Highly leveraged retail investors had fuelled the final euphoric stages of the rally. News of a softening economy saw sentiment for Chinese equities wane, with initial modest stock declines triggering a wave of margin calls that precipitated a frenzied sell-off.

CSI 300 index (rebased to 100)
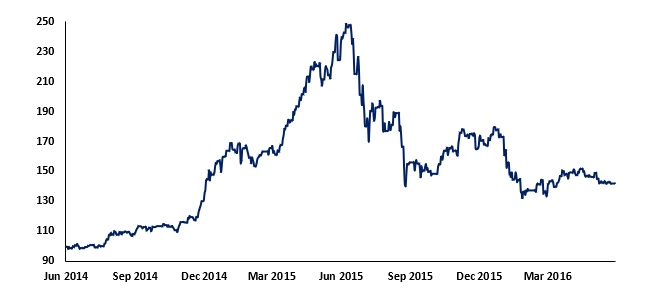
Chart 4: CSI 300 Index performance from 2014 to 2016.
Source: Bloomberg.

Fearing the slump would trigger a major financial crisis, Chinese authorities stepped in to introduce short selling bans and stock “circuit breakers”, while loosening margin requirements to allay fears of further defaults. Lock-up periods were enforced for owners of more than 5% of a company’s tradeable stock, and mutual funds and pension funds were compelled to support the market. Critically, the PBoC stepped in to slash rates, providing a significant boost to money numbers. Sentiment remained fragile through the beginning of 2016 with investors concerned about the ability of Beijing to rebalance a structurally slowing economy with bad debts without triggering capital flight. We were more constructive than consensus and gradually lifted exposure to overweight, encouraged by money numbers signalling a stronger economy ahead and judging that authorities had the tools to keep forex and balance of payments risks in check.

More recently, having been significantly underweight through the brutal selloff in Chinese equities in 2021, we began lifting exposure at the end of that year in response to improving liquidity data, reaching a neutral weight by the middle of 2022. This was subsequently raised to overweight later in the year as money numbers improved further, some political headwinds eased and Beijing’s COVID-zero approach to the pandemic was rapidly abandoned. The weighting shift provided a boost to portfolio performance as Chinese equities rallied hard on the “reopening trade”.

CSI 300 & HSI index (rebased to 100)
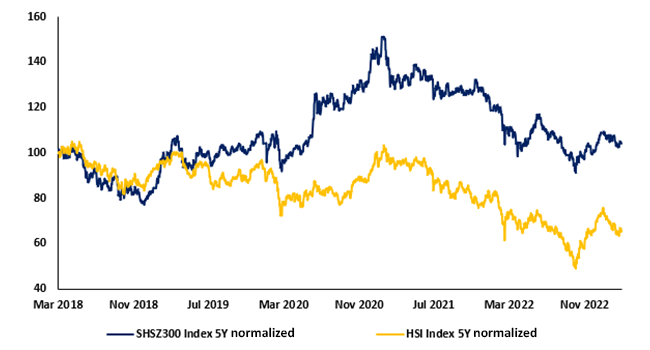
Chart 5: CSI 300 and HSI Index performance from 2018 to 2022.
Source: Bloomberg.

Looking ahead, we remain modestly bullish on Chinese equities but believe that current monetary trends signal that the authorities are determined to avoid overstimulating and sparking a Western-style inflation surge, which would risk social disruption. This should support a gradual but more sustainable economic recovery favouring quality names, as opposed to more cyclical parts of the market and derivative plays in materials and energy. 

As outlined above, in addition to quantitative inputs to our process, we also consider shorter term political risks along with longer term measures of institutional quality. China faces major challenges on both of these fronts as the Sino-U.S. dispute intensifies and as Xi Jinping consolidates power at the expense of the intra-party pluralism established under Deng Xiaoping. It means that while a monetary and economic recovery provides a supportive backdrop, our qualitative assessment of political and policy risks limits our conviction and consequent portfolio exposure to China.
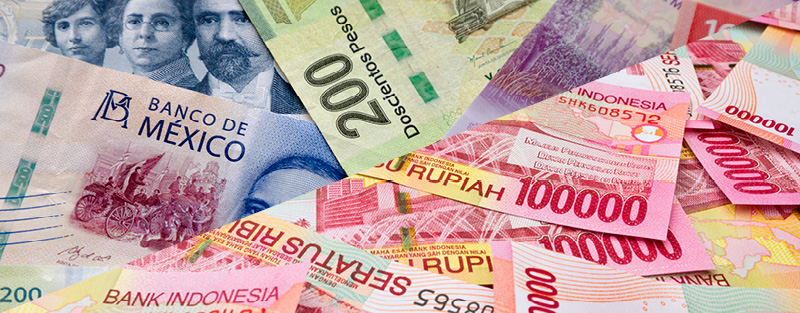
Several banknotes of Mexican & Indonesian currencies.

We are nearing our second year of our Emerging Markets Small Cap Fund and continuously monitoring various sectors across 24 countries. Almost 60% of the MSCI Emerging Markets Small Cap Index is represented by four countries: Taiwan, India, South Korea and China. In our view, these countries have advanced nicely in the emerging markets (EM) small-cap arena. Many of today’s technological developments are driven by companies that have been in the Index, including TSMC from Taiwan (circa 1994-95), Korea-based battery maker, LG Chem (circa 2001), India’s Apollo Hospitals (circa 2021) and consumer names from China.

These countries and companies have also been well represented in the MSCI Emerging Markets Small Cap Index having satisfied regulatory requirements, with some exceeding expectations by innovating such that they get “upgraded” in valuation or become classified as EM large caps. There are also ongoing discussions to elevate Korea from an EM to a developed market (DM).

We nevertheless feel that MSCI classifications can be inefficient. MSCI attempts to select promising EMs in advance using mostly backward-looking data, which can lead to mistakes. Argentina is an example. It was reclassified as an EM in 2018 and then cut in 2021. Vietnam should eventually be included in the Index despite foreign ownership limits, among other issues. It is more indicative of an EM than a FM classification. Saudi Arabia also has foreign ownership issues, yet is included in the EM Index.

Both Mexico and Indonesia make up close to 2% of the Index, but why? Considering their history, this is presumably due to a retrospective bias. From a forward-looking standpoint since 2020, our view is that their Index weightings are underestimated.

Mexico rising

Mexico comprises 2.1% of the MSCI EM SC Index (as of January 31, 2023). Although it has similar domestic issues as its peers, we believe it offers outstanding investment opportunities. Mexico is becoming increasingly relevant on the global stage considering its proximity to the U.S. and that many companies from Asia and beyond are setting up there. U.S.-based companies are following suit, including Tesla that will invest US$10 billion in a new plant in Nuevo Leon. Many of our Taiwan- and Korea-based companies are also expanding to Mexico. This nearshoring trend creates attractive investment opportunities across all sectors. According to the Inter-American Development Bank and Coldwell Banker Richard Ellis, nearshoring could represent a US$35.3 billion opportunity for Mexico, positioning the country as having the highest exports growth potential worldwide.[1] The share of Mexico’s nearshoring demand (based on % of net absorption) has increased from 10% in 2019 to 25% in Q2 2022.[2]

It’s worth mentioning that January 2023 was the strongest start of any year for Mexico’s stock exchange since 1996, despite the U.S. slowdown. We believe Mexico stands to benefit from the U.S. – Mexico – Canada Agreement for the next few years. The country’s fiscal accounts are well managed, it has low debt (50% of GDP) and its central bank will be one of the first globally to lower interest rates (currently at 11.25%). Moreover, the Mexican peso has outperformed other currencies, explained by more remittances and new foreign investments. As of Q3 2022, foreign direct investment already surpassed 2021 inflows, mostly concentrated in manufacturing and logistics.

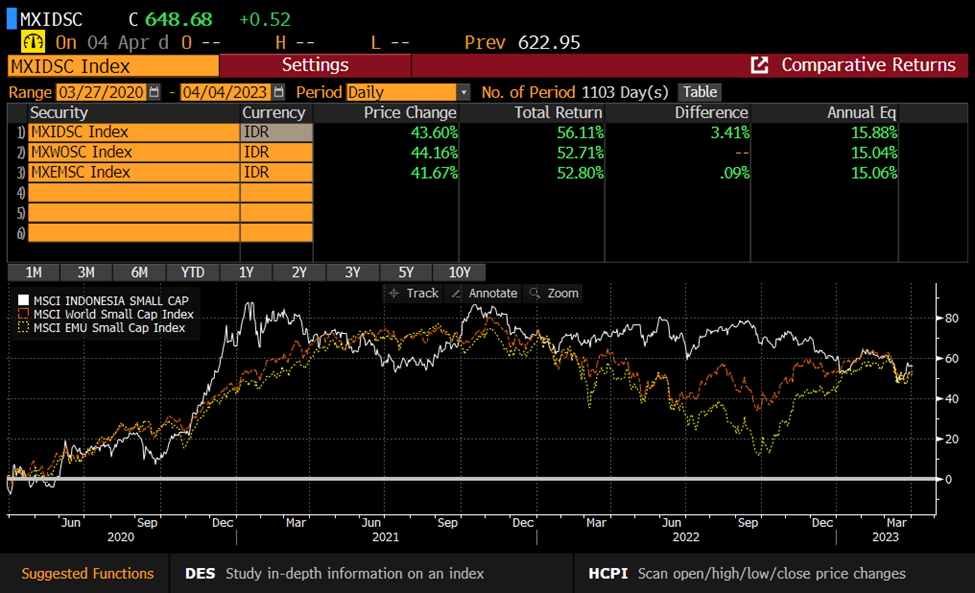
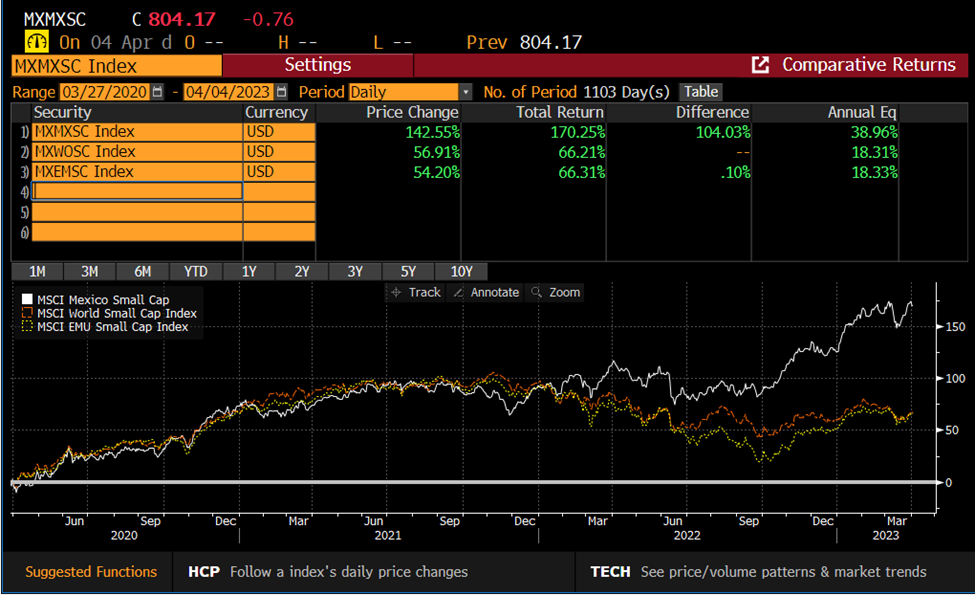
All sectors seem robust and are expanding nicely. For example, the banking sector is one of the best capitalized in Latin America (together with Chile’s), net interest margin securities (NIMS) and cost of funding are healthy and the system as a standalone has ample liquidity and capital. Mexico is not immune to global banking events, but the main point is that its system remains strong. Why then is Mexico such a low weight in the Index? Its economics are changing, trends are evolving and global conditions for Mexico are rapidly improving. The following chart compares the returns of the MSCI Mexico Small Cap Index to its EM and World small-cap counterparts, with Mexico outperforming since 2020. Besides the factors already mentioned and that Mexico is the U.S.’s second-largest trade partner, other positive tailwinds for the country include its pension reforms and the rising possibility of a favourable outcome in its presidential elections next year. It wouldn’t surprise us if the MSCI increased its Mexico weighting in the interim.

Graph showing Mexico outperforming both its emerging market and global peers between March 2020 and April 2023.
Source: Bloomberg.

Indonesia rising

We just attended Indonesia’s largest conference – its most important of the year – where President Joko Widodo made the opening speech. At how many private conferences (especially in EMs) would a country’s president be so involved in promoting the country as a viable and attractive environment for investment? This is uncommon and means a lot. The event was exceptionally investor-friendly, with the government keen to attract capital. We also enjoyed intimate dinners with top Indonesian officials including Luhut Binsar, Coordinating Minister of Maritime and Investment Affairs who shared knowledgeable insights on the future of the country with us.

Prior to 2020, Indonesia had many restrictions that made enticing foreign capital tedious, costly and time consuming. Then the government passed its Omnibus Law, simplifying many processes and clarifying regulations to help foreign investors better understand them.

Over 500 investors from around the world attended the conference. When asked to compare Indonesia’s current investment climate to five years ago, 94% of attendees said it had improved. Despite global turmoil, Indonesia’s macroeconomic indicators in 2022 were among the best in the G20. We remain confident in the country’s economic resilience in 2023.

As the world’s fourth-largest country with a population close to 300 million, Indonesia enjoys sound demographics and is commodity rich. Its government is focused on capitalizing on trends such as nickel downstreaming where the country can be a key player in the electric vehicle market and substantially increase its country exports. We believe the downstream industry has the potential to be a transformational pillar in Indonesia’s economy and contribute to strong growth and employment. The target pipeline investment for battery chain development according to government officials at the conference is US$31.9 billion. 

In terms of fiscal discipline, the country has carried a surplus trade balance for 32 consecutive months supported by the strong performance of its downstream exports. During her presentation at the conference, Finance Minister Dr. Sri Mulyani Indrawati highlighted that as of Q3 2020, Indonesia’s GDP growth has been 5.7% year over year, one of the best in the G20, while inflation has sat at 5.5% and gross debt to GDP has averaged 41%, which are some of the lowest figures in the G20.

Sector-wise, the country’s recovery has been relatively even with mining and manufacturing surpassing pre-pandemic levels by 2022. And structural tailwinds that we also favour include Indonesia’s emerging middle class and its increasing purchasing power. Consumption benefits the most from this trend, but so do other sectors.

So, why theses low Index weights? We understand that the MSCI follows certain criteria to arrive at this outcome; however, with a forward-looking perspective we believe there’s a high probability that both Indonesia’s and Mexico’s weights will be revised. Relative to the Index, we are overweight in both countries.

Graph showing Indonesia outperforming both its emerging market and global peers between March 2020 and April 2023.
Source: Bloomberg.

This is the result of our strong bottom-up ideas that we think we have identified correctly against Indonesia’s and Mexico’s favourable investment backdrop and disciplined fiscal policies that are especially important during uncertain times.

Our approach in action

The following holdings in our view are quality companies with the balance sheets, cash flows and management team to prove it.

In Mexico, we own Grupo Aeroportuario del Centro (OMA MM). The company has a 50-year monopoly on developing, operating and maintaining 13 airports across northern and central Mexico. OMA enjoys strong margins (63% EBITDA Margin 2023E[3]), generates plenty of cash and has improved profitability on an ongoing basis even with 80% of its costs being fixed. As it relates to nearshoring, OMA is developing airports near the U.S. border and close to 65% of its traffic is associated with manufacturing and exports.

We are also positive regarding the experience of its new shareholder, Vinci Group, which builds and operates airports worldwide (on July 31 2022, Fintech informed OMA that it had entered into a share purchase agreement with a subsidiary of VINCI Airports SAS to indirectly sell 29.9% of its capital stock). OMA has maintained strong year-over-year passenger growth of +30% as of Q1 2023 and we expect its business traffic to continue recovering, where the company has larger exposure than the other two listed Mexican airports and which also reflects positively on profitability.

In Indonesia, we own Sido Muncul (SIDO IJ), the country’s largest herbal medicine company with some 300 herbal and supplement, food and beverage and pharmaceutical products. Since its IPO in 2013, Sido has grown its revenue per share and operating profit (OP) per share at c5% and c12% CAGR, respectively. In most quarters it has delivered on expectations, supported by a strong balance sheet with superior OP margins and return on invested capital, high cash flow generation and low capital intensity. As people become more health conscious, they are adopting the “back to-nature” secular trend with herbal medicines, the fastest-growing category within consumer health. Sido’s leading product portfolio, proprietary formulations and strong brand equity (it’s a household name in traditional herbal products) allow it to maintain its dominant position despite its premium pricing model. The company has a strong distribution network and vertical integration and its new extraction facilities provide superior yields and raw materials efficiencies.

Sino products on store shelves, Jakarta, January 2023.


[1] Source: Actinver Institutional Research.

[2] Ibid.

[3] Source: Bloomberg Consensus.

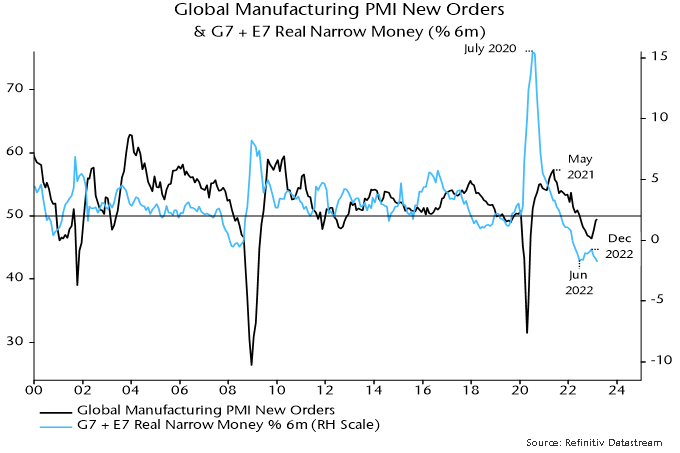
Partial information indicates that global (i.e. G7 plus E7) six-month real narrow money momentum fell for a third month in March, possibly breaching a low reached in June 2022. This increases confidence that a recent recovery in PMIs will reverse into H2. 

The June 2022 low in real narrow money momentum presaged a low in global manufacturing PMI new orders in December – see chart 1. Assuming the same six month lead, the roll-over in real money momentum since December 2022 implies a PMI decline from June. 

Chart 1

Chart 1 showing Global Manufacturing PMI New Orders & G7 + E7 Real Narrow Money (% 6m)

The fall could start earlier. The recovery in real money momentum between June and December 2022 was minor and driven entirely by a slowdown in six-month consumer price inflation. Momentum failed to break into positive territory. Credit tightening due to recent banking stresses may accelerate economic weakness. 

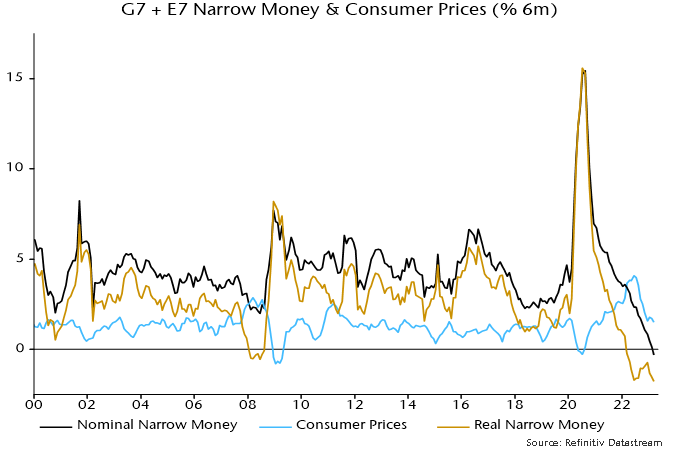
The renewed fall in global real money momentum since December reflects nominal money weakness rather than any inflation rebound: the six-month rate of change of nominal narrow money appears also now to be negative, a feat never achieved during the GFC – chart 2. 

Chart 2

Chart 2 showing G7 + E7 Narrow Money & Consumer Prices (% 6m)

Nominal money contraction is being driven the US and Europe, with momentum positive and stable in the E7 and Japan. 

Global real money momentum will be supported by a further inflation slowdown but a significant recovery is unlikely without a policy reversal that revives nominal money growth. As previously argued, recent reexpansion of the Fed’s balance sheet has no direct – or, probably, indirect – impact on money stock measures. 

The fall in global real money momentum has further delayed the expected cross-over above weakening industrial output momentum, suggesting fading the Q1 equity market rally and favouring defensive sectors, quality and yield.

Kevin Leon, CEO and President of Crestpoint.

From Lego towers to managing billions, meet Crestpoint’s founder, CEO and President, Kevin Leon.

À Gestion de placements CC&L, nous croyons que si nous réussissons à nous attaquer avec succès aux principales causes du déséquilibre entre les sexes en matière de leadership, nous pourrons considérablement élargir le bassin de talents d’où émergent les grands leaders et générer ainsi de meilleurs résultats.

Cette conviction a mené à la création de notre initiative Leadership au féminin  en 2021, qui met l’accent sur l’accroissement des talents en leadership en repérant et en réglant les problèmes qui ont contribué aux disparités entre les sexes au sein de notre organisation, de notre industrie et de la société en général.

Notre initiative collective nous a permis de formuler des recommandations pour de nouvelles priorités stratégiques qui ciblent directement les enjeux révélés par les discussions et les recherches. Une découverte importante – et inattendue – a été que les solutions trouvées pour éliminer le déséquilibre entre les sexes en matière de leadership règlent aussi des problèmes qui vont au-delà du genre. Autrement dit, même si nous avons commencé par nous concentrer sur les femmes, les résultats de nos recommandations profitent à tous.

Le présent document fournit un résumé général des conclusions de l’initiative Leadership au féminin et des solutions proposées. Toutefois, si vous souhaitez en savoir plus sur notre travail, nous serions ravis d’échanger avec vous. Veuillez communiquer avec nous au moyen de ce lien.

Collaborer pour libérer le potentiel

Dirigée par un comité avec l’engagement de la majorité des femmes de notre organisation, les principaux objectifs de l’initiative Leadership au féminin sont les suivants :

  1. Repérer les causes profondes et les principaux problèmes liés au déséquilibre entre les sexes, tant à l’intérieur qu’à l’extérieur de notre organisation.
  2. Proposer des solutions pour corriger de façon proactive ce déséquilibre.

Notre initiative repose sur un volume considérable de recherches universitaires, médiatiques et sectorielles sur l’(in)égalité entre les sexes en milieu de travail. Globalement, les résultats font majoritairement ressortir un thème systémique et persistant qui touche presque tous les secteurs : plus les emplois sont techniques, prestigieux et importants, plus la proportion de femmes à ces postes diminue.

Nous reconnaissons que de nombreux facteurs d’inégalité entre les sexes échappent au contrôle de notre organisation, mais nous savons également que notre interdépendance en tant qu’acteurs du secteur et membres de la société a des répercussions tangibles sur la capacité de CC&L à opérer des changements.

Notre approche à l’œuvre

Lorsque nous avons examiné ce problème multidimensionnel, nous avons adopté une approche ascendante pour expliquer pourquoi les femmes n’atteignaient pas leur plein potentiel au travail. Par exemple, nous avons mené des entrevues poussées à l’interne et à l’externe, ainsi que des séances de remue-méninges et des recherches approfondies. Dans le cadre de ce processus, nous avons repéré les principaux problèmes auxquels font face les femmes dans notre milieu de travail et nous les avons analysés plus précisément pour en déterminer les causes sous-jacentes. À partir de là, nous avons élaboré des solutions pour nous attaquer directement aux principales causes profondes. Pour ce faire, l’initiative Leadership au féminin a été divisée en quatre parties clés :

  1. Les normes sociétales
    • Ce que nous avons examiné : Les attentes liées au genre (p. ex., obligations familiales et responsabilités d’aidant naturel) et comment promouvoir l’égalité des chances pour nos employés, tant au travail qu’à la maison.
    • Nos recommandations : Elles visaient à atténuer les défis liés aux congés parentaux et à la division du travail dans les ménages, dans le but d’établir de meilleurs systèmes de soutien pour les employés.
  2. Compétences et qualités en matière de leadership
    • Ce que nous avons examiné : Repérer et éliminer les obstacles en matière d’égalité des sexes dans le développement du leadership, en permettant une occasion d’accès égale aux postes de niveau supérieur.
    • Nos recommandations : Rétroaction continue et à 360 degrés entre les gestionnaires et les employés, et vision clairement alignée aux fins d’avancement de la carrière.
  3. Environnement de travail
    • Ce que nous avons examiné : Repérer des améliorations dans la façon dont nous interagissons et qui pourraient éliminer les obstacles à l’avancement professionnel. Dans les domaines à prédominance masculine, les femmes peuvent avoir de la difficulté à établir des relations et à sentir qu’elles font partie de l’équipe. Leur confiance peut être ébranlée au point où elles hésitent à donner et recevoir de la rétroaction, ou à exprimer et poursuivre des objectifs ambitieux.
    • Nos recommandations : Favoriser un milieu de travail sécuritaire et inclusif qui encourage le perfectionnement professionnel.
  4. Embauche
    • Ce que nous avons examiné : Constituer un effectif plus équilibré entre les hommes et les femmes en s’appuyant sur des pratiques d’embauche qui tiennent compte des contraintes liées au sexe. Les domaines d’intérêt comprennent :
      • Le bassin de talents : Les femmes sont sous-représentées aux postes de direction.
        Nos recommandations : Chercher à améliorer l’équilibre entre les sexes dans l’ensemble du bassin de talents au fil du temps en mettant l’accent sur les candidates débutantes et le développement de carrière.
      • Bassin de candidatures de CC&L : Les déséquilibres entre les hommes et les femmes, tant au niveau des postes de direction qu’au niveau des débutants.
        Nos recommandations : Accent mis sur l’augmentation de la probabilité de recevoir des demandes de femmes expérimentées, ainsi que sur la sensibilisation à la façon dont les femmes peuvent réussir sur les marchés financiers.
      • Notre processus d’embauche : Un préjugé inconscient peut écarter les femmes qualifiées.
        Nos recommandations : Mettre en œuvre des pratiques d’embauche et des mesures du succès qui réduisent au minimum les préjugés inconscients.

Un avenir meilleur pour tous

Nous avons adopté une approche neutre en matière de genre dans la conception de nos solutions; non seulement elle favorise l’inclusion et la diversité, mais elle améliore aussi la qualité globale de notre environnement de travail. Même si la mise en œuvre de plus de 20 solutions (décrites dans notre rapport complet) peut sembler ambitieuse, nous croyons qu’en procédant par étapes plus petites et réalisables, nous pouvons efficacement établir les priorités et mettre en œuvre nos recommandations sur une période de plusieurs années, tout en nous assurant d’atteindre nos objectifs. Nous nous attendons à ce que cette initiative continue de croître et d’évoluer au fil du temps, à mesure que les besoins et les attentes changeront au cours du processus de mise en œuvre.  Il en résultera probablement des ajustements périodiques du plan de mise en œuvre à long terme.

En regroupant nos forces pour renforcer une culture d’équité, de dialogue ouvert et  d’opportunités, nous créons collectivement des conditions propices à la réussite de l’entreprise. Dans cette optique, nous espérons que les retombées positives de notre initiative Leadership au féminin se feront sentir à l’échelle de notre organisation et dans les collectivités où nous vivons et exerçons nos activités, ce qui pourrait se traduire par un meilleur leadership, des équipes plus solides et un avenir meilleur pour tous.

Si vous êtes intéressé à en savoir plus sur notre travail, nous serons ravis de communiquer avec vous. Veuillez remplir le formulaire ci-dessous :

TORONTO (Ontario), le 5 avril 2023 – Investissements immobiliers Crestpoint Ltée (Crestpoint) a annoncé aujourd’hui l’acquisition d’un complexe multifamilial de deux immeubles situés au 2 et 4, Hanover Road à Brampton, en Ontario (la propriété).

La propriété, composée de deux tours de 18 et de 22 étages, pour un total de 605 appartements et de 946 places de stationnement, offre une combinaison intéressante d’appartements de 1, 2 et 3 chambres dont le taux d’occupation est actuellement d’environ 97 %. En plus des deux tours existantes, le site de 10 acres permet également la construction d’environ 400 appartements supplémentaires. L’emplacement idéal, à quelques minutes de l’autoroute 410 et des gares GO de Bramalea et de Brampton, offre aux locataires un accès facile à plusieurs écoles et à un éventail de commerces de détail, de lieux communautaires et d’espaces récréatifs, dont le parc Chinguacousy. Vestcor Inc. et Crestpoint, au nom de la Stratégie immobilière de base plus Crestpoint (son fonds à capital variable), se partagent une participation de 90 % dans la propriété. InterRent REIT a acquis les 10 % restants et fournira des services de gestion immobilière au nom du groupe de propriétaires.

La conclusion de ces acquisitions porte l’actif sous gestion total de Crestpoint à environ 9,9 milliards de dollars et de 36,5 millions de pieds carrés.

À propos de Crestpoint

Investissements immobiliers Crestpoint Ltée est une société de gestion de placements immobiliers commerciaux qui cherche à fournir aux investisseurs un accès direct à un portefeuille diversifié d’actifs du secteur immobilier commercial. Crestpoint est membre du Groupe financier Connor, Clark & Lunn, une société de gestion de placements dotée d’une structure multientreprise qui offre des produits et des services de gestion de placements à des clients institutionnels et à valeur nette élevée. Possédant des bureaux partout au Canada, ainsi qu’à Chicago, à Londres et à Gurugram, en Inde, le Groupe financier Connor, Clark & Lunn et ses sociétés affiliées gèrent collectivement un actif d’environ 104 milliards de dollars. Pour obtenir de plus amples renseignements, veuillez consulter le site : www.crestpoint.com.

Personne-ressource

Elizabeth Steele  
Directrice, Relations avec les clients  
Investissements immobiliers Crestpoint Ltée  
(416) 304-8743  
[email protected]

Fonds Connor, Clark & Lunn Inc. (le « gestionnaire ») a reformulé le contenu de son site Web afin de préciser que les facteurs ESG et les énoncés à ce sujet faits par le gestionnaire ne constituent ni des objectifs ni un élément important des stratégies de placement de ses fonds communs proposés au public. L’énoncé suivant a été supprimé à la demande du personnel de la Commission des valeurs mobilières de l’Ontario par suite d’un examen axé sur les enjeux des fonds liés aux facteurs ESG : « Fonds CC&L s’engage à adopter des pratiques d’entreprise responsables à l’égard des questions environnementales, sociales et de gouvernance (ESG) et cherche à faire des placements qui non seulement génèrent des rendements supérieurs pour les investisseurs, mais ont une incidence positive sur la société, l’environnement et les marchés dans lesquels elle exerce ses activités. »

En plus de modifier son site Web, le gestionnaire a actualisé les renseignements contenus dans le prospectus simplifié de ses fonds communs de placement alternatifs et met à jour le prospectus simplifié de ses fonds communs de placement conventionnels afin de fournir aux investisseurs des renseignements précis sur le rôle que jouent les facteurs ESG dans le processus décisionnel de certains fonds.

Liste des fonds inclus dans le prospectus simplifié des fonds communs alternatifs du gestionnaire :

  • Fonds alternatif de revenu CC&L
  • Fonds d’actions mondiales longues/courtes CC&L
  • Fonds mondial neutre au marché CC&L II
  • Fonds de rendement absolu PCJ II

Liste des fonds inclus dans le prospectus simplifié des fonds communs conventionnels du gestionnaire :

  • Fonds de revenu et de croissance de base CC&L
  • Portefeuille diversifié de revenu CC&L
  • Fonds d’actions de revenu et de croissance CC&L
  • Fonds Global Alpha CC&L
  • Fonds d’obligations à haut rendement CC&L
  • Fonds concentré d’actions internationales NS Partners

À propos de Fonds Connor, Clark & Lunn Inc.

Fonds Connor, Clark & Lunn Inc. (les Fonds CC&L) noue des partenariats avec des institutions financières canadiennes de premier plan et leurs conseillers en placement afin d’offrir des stratégies de placements institutionnelles uniques à des investisseurs particuliers, grâce à une gamme de fonds, de placements alternatifs liquides et de comptes en gestion distincte choisis avec soin.

En limitant sa gamme à un groupe de solutions de placement en particulier, Fonds CC&L est en mesure d’offrir des stratégies uniques conçues pour améliorer les portefeuilles traditionnels des investisseurs. Pour obtenir des précisions, consultez le site cclfundsinc.com.

À propos du Groupe financier Connor, Clark & Lunn Ltée.

Le Groupe financier Connor, Clark & Lunn Ltée (Groupe financier CC&L) est une société de gestion d’actifs indépendante à multiples sociétés affiliées qui offre une vaste gamme de solutions de gestion de placements traditionnelles et non traditionnelles aux investisseurs institutionnels et individuels. Le Groupe financier CC&L procure une envergure et une expertise considérables qui permettent d’assumer des fonctions administratives qui ne sont pas liées aux placements tout en laissant les gestionnaires de placement se concentrer sur ce qu’ils font le mieux grâce à la centralisation des activités liées aux opérations et à la distribution. Les sociétés affiliées du Groupe financier CC&L gèrent un actif de plus de 104 milliards de dollars. Pour obtenir des précisions, consultez le site cclgroup.com

Pour en savoir plus, veuillez communiquer avec :

Lisa Wilson
Directrice, Produits et service à la clientèle
Fonds Connor, Clark & Lunn Inc.
416-864-3120
[email protected]

Global economic sentiment has improved on the back of China’s reopening and a collapse in the European gas price but monetary indicators continue to signal a negative outlook. The “excess” money backdrop remains unfavourable for equity markets, with prospective developments suggesting overweighting non-energy defensive sectors and expecting a further relative recovery in quality / growth. 

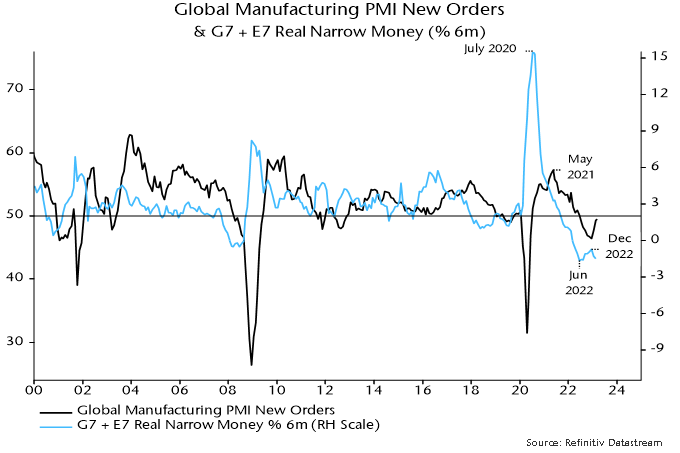
Revisions to US seasonal adjustments have slightly altered the recent profile of global (i.e. G7 plus E7) six-month real narrow money momentum – the key leading indicator in the money / cycles forecasting approach used here. On the new numbers, momentum bottomed in June 2022, recovering modestly into December before falling back in January / February – see chart 1. 

Chart 1

Chart 1 showing Global Manufacturing PMI New Orders & G7 + E7 Real Narrow Money (% 6m)

The June turning point has been followed – with a lag within the normal range – by a recovery in global manufacturing PMI new orders from a low in December, with the revival driven by a sharp rise in the Chinese component. 

The PMI recovery is expected to fizzle out and reverse into H2, for both monetary and cycle reasons. Six-month real narrow money momentum, as noted, fell back in January / February and remains in negative territory – a sustained economic / PMI recovery has never occurred historically against such a monetary backdrop. 

From a cycles perspective, major PMI lows occur around troughs in the stockbuilding cycle but the current downswing phase was only starting when PMI new orders bottomed in December. With the last cycle trough in Q2 2020, the average historical cycle length of 3 1/3 years suggests another low in H2 2023. 

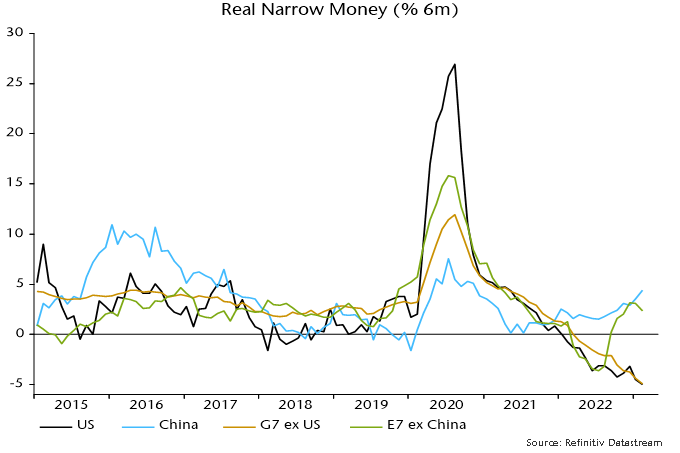
The marginal recovery in global six-month real narrow money momentum since June 2022 has been driven entirely by China and several other E7 economies. US / European momentum has slid deeper into negative territory as already restrictive monetary policy settings have been tightened further – chart 2. 

Chart 2

Chart 2 showing Real Narrow Money (% 6m)

The Chinese pick-up suggests economic acceleration through 2023 but a recovery will be held back by – and won’t offset – global weakness. Current Chinese real money strength, moreover, could fade: higher short-term rates / yield curve flattening since late 2022 suggest a slowdown in nominal money growth while unusually low inflation may revive as the economy normalises. 

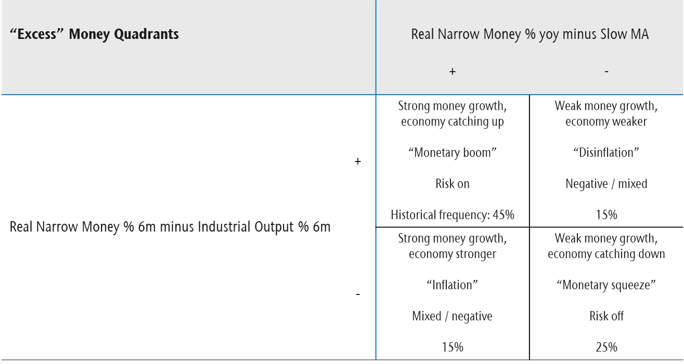
The assessment of market prospects relies on two indicators of global “excess” money – the gap between six-month real narrow money and industrial output momentum, and the deviation of year-on-year real money momentum from a long-term moving average. The signs of the two indicators define four investment quadrants describing different market environments – see table 1. (This presentation echoes Hedgeye’s investment “quads”, in their case defined by the directions of economic growth and inflation – the approach here offers an alternative “monetarist” perspective.) 

Table 1

Table 1 showing “Excess” Money Quadrants Real Narrow Money % yoy minus Slow MA

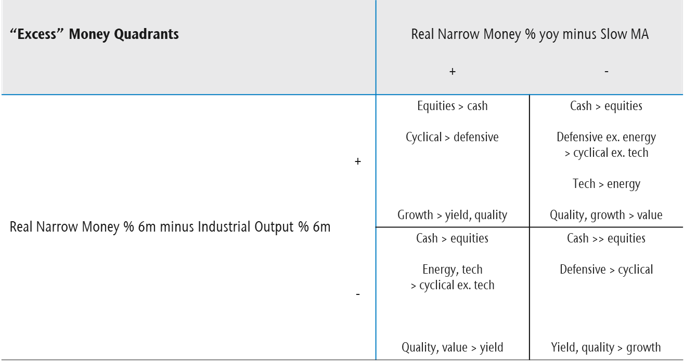
The two indicators were negative from January 2022 (allowing for reporting lags) through year-end but the last quarterly commentary suggested that the first measure would turn positive in early 2023 as weakening industrial output momentum crossed below stable or rising real money momentum. Based on historical patterns, the implied shift from the bottom right to top right quadrant might be associated with less negative equity markets and a reversal of some of last year’s sector / style moves, including relative recoveries in quality / growth and tech – table 2. 

Table 2

Table 2 showing “Excess” Money Quadrants Real Narrow Money % yoy minus Slow MA

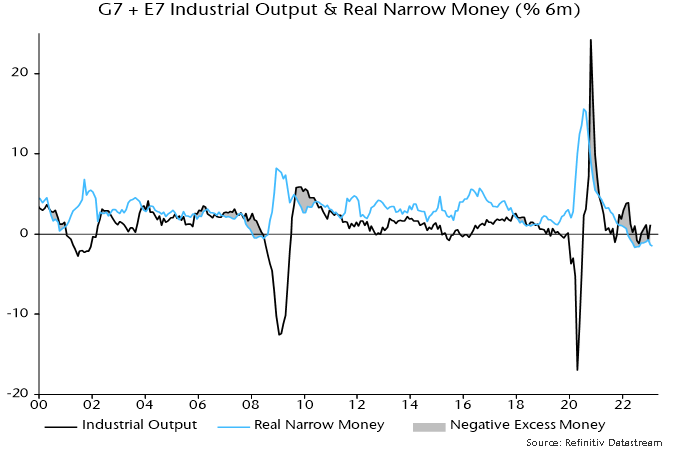
The suggested sign switch of the first indicator had not occurred by January – chart 3 – but markets appeared to front run the quadrant shift in Q1, with tech / growth outperforming strongly and energy / financials weak. A cross-over of six-month industrial output momentum below real money momentum is still expected here, although timing is uncertain – Chinese reopening has delayed industrial weakness. Some Q1 moves were extreme so it may be advisable to await confirmation before adding to favoured themes. 

Chart 3

Chart 3 showing G7 + E7 Industrial Output & Real Narrow Money (% 6m)

A common characteristic of the right hand quadrants of the table is a trend of non-energy defensive sectors outperforming non-tech cyclical sectors. The reverse occurred during Q1, although much of the cyclical relative gain unwound later in the quarter as financials were pummelled by banking crises. With no early move to the left hand of the table in prospect, an overweighting of non-energy defensive sectors – along with quality, which also usually outperforms in both right hand quadrants – is suggested. 

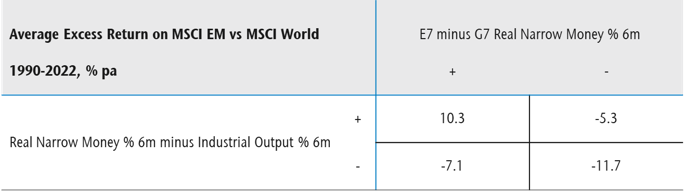
The stark contrast between positive and rising E7 six-month real narrow money momentum and faster contraction in the G7 raises the question of whether investors should overweight EM equities. Over 1990-2022, EM equities outperformed developed markets by 3.2% pa on average when the E7 / G7 real money momentum gap was positive, underperforming by 6.1% when it was negative. 

Further investigation, however, indicates that a positive gap is a necessary but not sufficient condition for EM outperformance – the global “excess” money backdrop, in addition, needs to be taken into account. Table 3 shows that, since 1990, EM equities have outperformed on average only when both the E7 / G7 gap and the first global excess money indicator were positive. Confirmation of a sign change in the latter indicator would strengthen the case for overweighting EM. 

Table 3

Table 3 showing Average Excess Return on MSCI EM vs MSCI World 1990-2022, % pa E7 minus G7 Real Narrow Money % 6m

Historically, periods of sustained EM outperformance coincided with trend declines in the US dollar. The dollar reached major peaks in 1969, 1985 and 2002. These peaks occurred 6-7 years before housing cycle lows (in 1975, 1991 and 2009). Assuming a normal (i.e. c.18 year) cycle length, another cycle low is scheduled for the late 2020s. A dollar peak in October 2022, therefore, may turn out to be a major top, preceding a trend decline into or beyond the housing cycle trough.

Chaque année, la Fondation CC&L appuie de nombreux organismes sans but lucratif au Canada pour :

  • favoriser un meilleur environnement;
  • améliorer l’éducation;
  • faire progresser la science et la médecine;
  • créer des collectivités plus fortes;
  • encourager les arts.

Elle vise notamment à soutenir les organisations avec lesquelles nos employés ou partenaires ont un lien personnel et ont pris des engagements financiers ou en temps.

La Fondation CC&L s’engage à verser 125 000 $ à l’Œuvre des Manoirs Ronald McDonald (Alberta)

En 2022, la Fondation CC&L a versé 125 000 $ à l’Œuvre des Manoirs Ronald McDonald (Alberta). L’Œuvre des Manoirs Ronald McDonald soutient les familles qui ont besoin de voyager, à la recherche d’un traitement médical vital pour leur enfant gravement malade ou blessé. Elle offre une maison loin de la maison lorsque ces familles traversent l’une des périodes les plus difficiles de leur vie. Tous les ans, des milliers de familles séjourneront dans l’une des quatre maisons de l’Œuvre des Manoirs Ronald McDonald en Alberta, les séjours pouvant durer de quelques nuits à plusieurs mois.

À l’heure actuelle, l’Œuvre des Manoirs Ronald McDonald n’est en mesure de servir que 14 % des personnes qui doivent se déplacer pour obtenir des soins pédiatriques en Alberta. Par conséquent, certaines familles sont refusées et doivent prendre leurs propres dispositions; il arrive quelquefois qu’elles soient séparées de leurs enfants. Afin d’accroître la capacité et de répondre à la demande élevée, l’Œuvre des Manoirs Ronald McDonald est en train de doubler ses capacités à Edmonton et à Calgary. Le don de la Fondation CC&L contribue à ces projets d’expansion.

Des bénévoles de Gestion privée CC&L participent au programme « Home for Dinner »

Jim Kapeluck est conseiller en gestion de patrimoine, représentant-conseil adjoint au sein de l’équipe de Gestion privée CC&L à Edmonton. Plus tôt cette année, Jim et l’équipe locale ont participé à l’une des soirées « Home for Dinner » du Manoir Ronald McDonald d’Edmonton. L’équipe a préparé et servi des repas aux familles dans le besoin.

Informez-vous sur le travail de la Foundation CC&L.

Federal Reserve Bank of Chicago.

It has been an extremely busy period as we navigated the banking environment. The risk of contagion is top of mind as well as the impact on our investments. The difficulty is that for a bank, added outsized risk can come in many shapes and forms. In 1907, the crisis came from overzealous bank owners attempting to corner the copper market. Today, for SVB, it came from duration misalignment of investments and even cryptocurrencies for Signature Bank. Elevated risk taken by banks often occurs when executives allow deposits and loans to grow faster than what their specific team of lenders and investment managers can handle in relation to risk.

Elevated risk can also come from other sources, such as too much government intervention in the case of the Baoshang bank in China in 2019 or severe mismanagement at all levels in the case of Credit Suisse. That’s the bad news. With 25,000 banks globally and 4,844 in the U.S. alone, let’s expect further difficulties to the system. Outflows are at 1.9%.

The good news is this is taken with extreme attention by government and banking associations. In the last two weeks, our team has travelled extensively, especially in Japan and the U.S. We were actually in California when we noticed the SVB debacle on the Friday. During a Monday morning presentation, a non-portfolio company commented that it had a US$80 million deposit with the California bank. All access to deposits was resolved by 11 a.m., certainly a sign of quick response.

Global Alpha holds larger exposure to financial services firms than bank stocks themselves. Its largest exposure is with Rothschild & Co (Roth FP), which provides global financial advisory (mergers and acquisitions and financing advisory). The company also has a wealth division and merchant bank that account for 24% and 16% of sales, respectively. Tracing back to 1760, the company now operates with 4,200 financial specialists across 40 countries. From its strong Europe-based foothold, the company is successfully growing its operations in North America. Rothschild & Co is presently subject to a takeover bid by the founding family’s financial holding.

Another important position for us in financial services is PRA Group (PRAA US). The U.S.-based company is a leading debt collection agency servicing mostly the financial industry, acquiring debt packages from banks and credit card companies. PRA is vertically integrated, from debt acquisition all the way down to call center-based collections, giving it a strong competitive edge. Increasing regulations implemented in the debt collection industry are certainly favouring PRA in the long term. The company has global footprint, with leading operations in North America and Europe.

Our positioning in regulated banks follows our general philosophy of investing in quality assets where we assess balance sheet strength, operational excellence, competitive standing and target markets. We generally tend to be underweight in banks, as most banks have low exposure to higher-growth investment themes and/or are constrained by increasing regulations. Our holdings include: 

Seven Bank Ltd. (8410 JP): The company provides banking services mainly through automated teller machines (ATM) across Japan. Culturally, the Japanese continue to rely on cash as their preferred payment method, mostly for security and identity theft reasons. Although licensed under a bank charter, Seven Bank majorly operates as a technology company through its 26,253 ATM outlets. Services are growing rapidly supplementing cash distribution, and novel and growing additions include credit and investment services. Its balance of deposits stands at ¥578 billion while its loan book conservatively stands at ¥32.7 billion.

With over 250 banks in our index, Global Alpha has low exposure to direct commercial real estate lending, an area that is being scrutinized with the increasing vacancies in commercial downtown centers. Our direct exposures are the following:

Wintrust Financial Corp. (WTFC US): Wintrust is a financial holding company with community bank locations in and around Chicago and northern Illinois, southern Wisconsin and northwest Indiana. Branded as Chicago’s bank, its lending book is highly diversified with a low exposure (6%) to residential real estate, all else mostly being small commercial (sub US$1.5 million) suburban business loans, with downtown office commercial real estate being a small part. An additional Wintrust differentiator is that it owns 15 bank charters, providing FDIC coverage 15 times over for every customer, or up to US$3.75 million in total guaranteed deposit coverage. We believe Wintrust will gain market share as it further commercializes this service.

UMB Financial Corp. (UMBF US): UMB is a U.S.-licensed bank operating nationwide, with main branches throughout Missouri, Illinois, Colorado, Kansas, Oklahoma, Nebraska, Arizona and Texas. Its US$31 billion in deposits is only 20% exposed to the consumer market. Deposits are otherwise commercial (46%) and financial services (17%). The majority (54%) of its US$17 billion loan book is in commercial and industrial lending. UMB maintains a low loan-to-value ratio (currently at 59%). With a 54% loan-to-deposit ratio, UMB also remains at the low end of the 74% peer median.

As you can see, our investment process has led us to financial services companies and banks with differentiated offerings, competitive advantages and defendable barriers to entry. These specialty-focused organizations tend to operate outside of the core banking space where increased risk (from volatile and unpredictable deposits and loans) is taken to achieve return targets. We will continue to monitor the bank environment as well as the health of our bank investments through direct engagement.