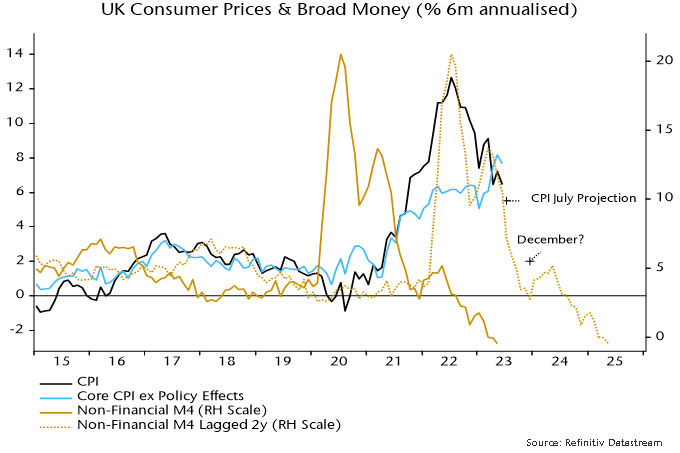
UK headline CPI momentum continues to track a simplistic “monetarist” forecast based on the profile of broad money momentum two years earlier. 

Six-month growth of headline prices, seasonally adjusted, peaked at 12.7% annualised in July 2022 and had halved to 6.5% as of June. This mirrors a halving of six-month broad money momentum from a peak of 20.5% annualised in July 2020 to 10.5% in June 2021 – see chart 1. 

Chart 1

Chart 1 showing UK Consumer Prices & Broad Money (% 6m annualised)

Broad money continued to slow sharply during H2 2021, with six-month momentum down to 2.7% by December, suggesting a fall in six-month CPI momentum to 2% annualised or lower by late 2023 / early 2024. 

A 2% rate of increase of prices during H2 2023 could be achieved by the following combination: 

The energy price cap falling by a further 10% in October, in line with current estimates based on wholesale prices, following the 17% July reduction. 

Food, alcohol and tobacco prices slowing to an 8% annual inflation rate by December from 14.9% in June. 

Core prices rising at a 4% seasonally adjusted annualised rate during H2 2023, down from 7.7% in H1. 

The latter two possibilities are supported by producer output price developments – annual inflation of food products is already down from a 16.8% peak to 8.7%, while core output prices flatlined during H1, following a 6.4% annualised rise during H2 2022. 

A 2% annualised CPI increase during H2 2023 would imply a headline annual rate of about 4% by year-end, well with PM Sunak’s target of a halving from 10%+ levels, although he will have made no contribution to the “success”. 

Why has UK CPI inflation exceeded US / Eurozone levels, both recently and cumulatively since end-2019? 

The assessment here is that the divergence reflects relatively weak UK supply-side economic performance and a larger negative terms of trade effect, rather than more egregious monetary excess. 

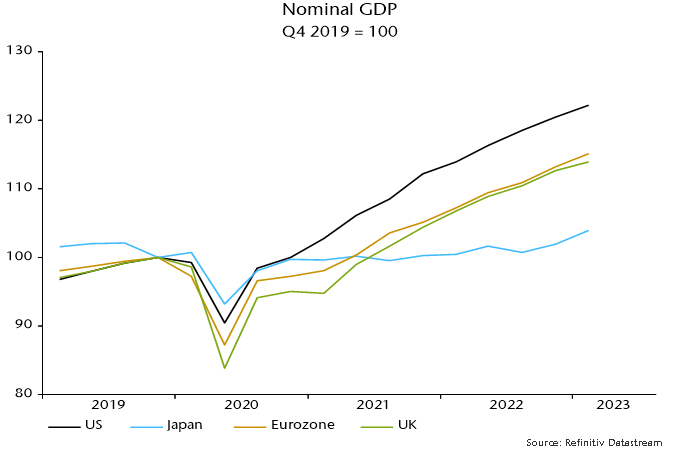
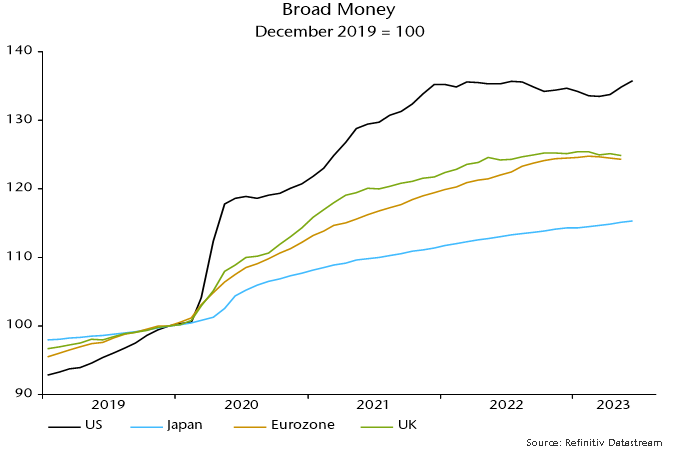
Charts 2 and 3 show that UK / Eurozone broad money expansion since end-2019 has been similar and less than in the US, with the relative movements mirrored in nominal GDP outcomes. 

Chart 2

Chart 2 showing Broad Money December 2019 = 100

Chart 3

Chart 3 showing Nominal GDP Q4 2019 = 100

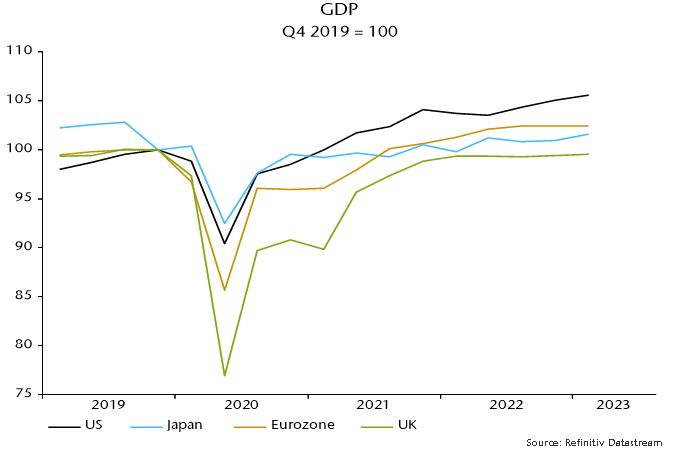
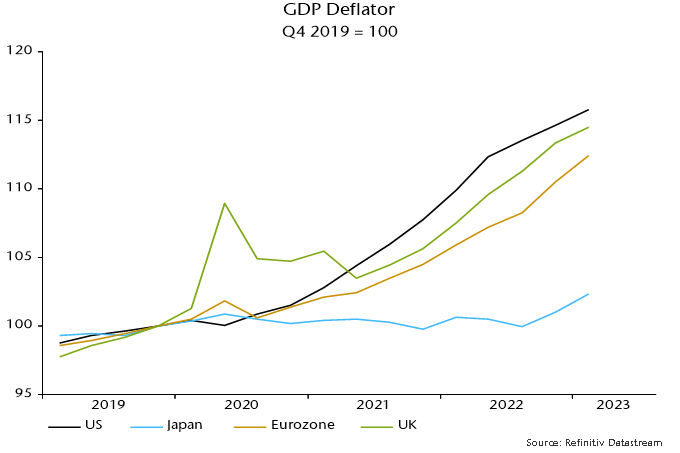
The UK has, however, underperformed the US and Eurozone in terms of the division of nominal GDP expansion between real GDP and domestically-generated inflation, as measured by the GDP deflator – charts 4 and 5. 

Chart 4

Chart 4 showing GDP Q4 2019 = 100

Chart 5

Chart 5 showing GDP Deflator Q4 2019 = 100

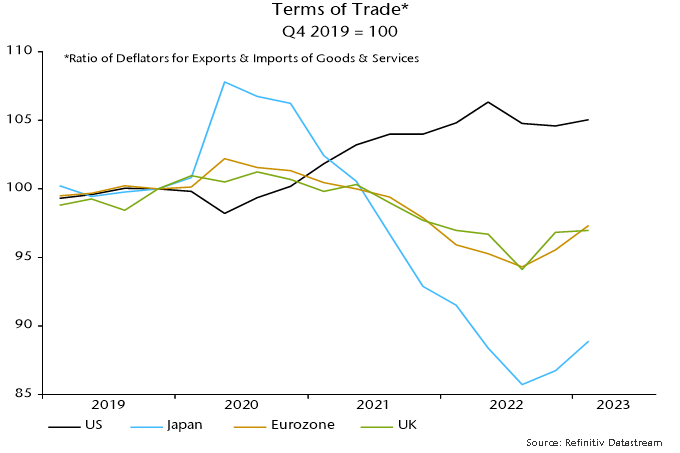
UK consumer prices were additionally boosted relative to the US by opposite movements in the terms of trade (i.e. the ratio of export to import prices), reflecting different exposures to energy prices as well as currency movements (i.e. a strong dollar through last autumn) – chart 6. 

Chart 6

Chart 6 showing Terms of Trade* Q4 2019 = 100 *Ratio of Deflators for Exports & Imports of Goods & Services

UK supply-side weakness may be structural but monetary and terms of trade considerations suggest an improvement in UK relative inflation performance – annual broad money growth is now similar to the US and below the Eurozone level, while sterling appreciation since late 2022 may extend a recent recovery in the terms of trade.

Beautiful view of a Puerto Vallarta beach on the Pacific coast of Mexico.

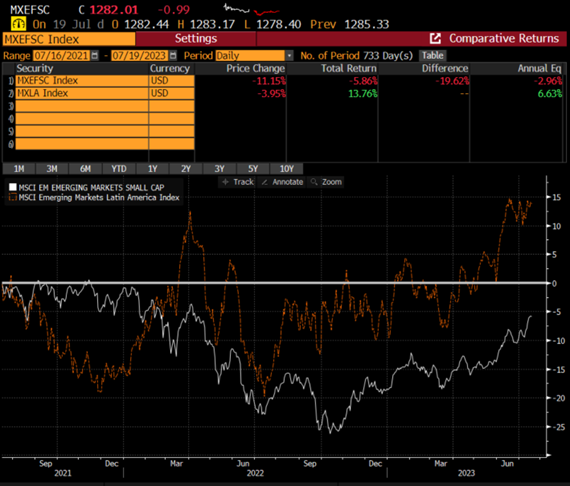
Latin America has outperformed other emerging markets over the past two years and this positive performance can be attributed to several key factors. However, the challenge lies in sustaining this momentum and ensuring it is not merely temporary.

MSCI World Small Cap Index vs MSCI Emerging Markets Latin America Index, 2021 to 2023

Graph showing the outperformance of the Latin America small cap index relative to its global peers between June 2021 and June 2023.

Source: Bloomberg

Notably, the combination of currency rallies among some Latin American countries and an emerging markets rally is uncommon. Reasons for this mismatch include:

  • Latin America leads the way in interest rate hikes worldwide. Starting in the first half of 2021, Chile and Brazil raised rates, helping control inflation levels, although they are still high but manageable. Chile will likely start its easing process next week, followed by Brazil within the year. This has boosted their respective stock markets, which were already undervalued in our view.
  • Additionally, Mexico has benefitted from the “nearshoring” theme. Nearshoring is nothing new to local investors, having been present in the region for decades. What is new is the level of intensity and amount of investment expected over the next three to five years. This has resulted in increased earnings per share (EPS) of 15% to 20% CAGR in the near term for some Mexican companies, outperforming the MSCI Emerging Markets Small Cap Index and contributing to higher valuations in Mexico’s market compared to its Latin American peers. However, there are questions about whether Mexico’s growth is comparable to its peers or to countries like Indonesia or Vietnam that are also heavily dependent on US imports.
  • Commodities also play a significant role in the region’s performance. Despite a global slowdown, certain commodities, like copper, have maintained high prices due to supply constraints. We believe the anticipated electric vehicle (EV) boom will further drive copper demand, ensuring a deficit in the market from 2026 onwards. For example, every EV, which weigh approximately two tons each, consumes around 60 additional kilos of copper.
  • Furthermore, the region has demonstrated better fiscal discipline, with countries like Chile and Mexico ending 2022 with fiscal surpluses or manageable deficits, respectively. This responsible fiscal approach has also supported their currencies. There is always the potential for Brazil to surprise on the downside due to its high fiscal spending and debt levels; however, the country has seen no “disruptive” events lately.
  • US rates hikes have favoured value over growth factors in emerging markets, benefitting markets like Latin America’s over countries perceived as growth-driven, such as Korea or India.
  • Innovation has not been a main driver for Latin America, but that is starting to slowly change. Moreover, the market has begun recognizing and crediting good companies with sustained growth expectations, which has historically been uncommon in the region. This trend in recognizing innovation and good companies is crucial for bottom-up investors like us who prioritize companies with solid balance sheets, strong cash flow generation and sustained competitive advantages. More Latin American companies have started to share these characteristics.

Latin America is still a small region relative to the rest of the world and it is dominated by, and benefits from, global trends, even though its politics are not always market friendly. However, sustained positive factors like the commodities momentum and nearshoring may make global investors more indifferent to the region’s internal dynamics.

What needs to happen for long-term compounder growth stories to emerge, like Nestle in India or TSMC in Taiwan? To maintain sustainable growth, we believe the region needs to align with external factors and foster strong domestic sectors and companies that promote growth. Improving innovation and adapting to rapidly changing environments are also key. For example, the financial sector in Mexico and Chile remains solid, while the transport-logistics sector in Mexico offers interesting opportunities. Brazil’s large population presents significant potential for emerging middle-class growth, creating opportunities in various sectors.

Latin America has growth engines and the key is to identify the best companies capable of maintaining a sustained differentiation over time. By focusing on these opportunities, our portfolio is well-positioning to capture their potential growth.

Company example

JSL (JSLG3 BZ) has the largest portfolio of logistics in Brazil, with long expertise operating in a variety of sectors and a nationwide scale of services. The company has long-lasting business relationships with clients that operate in several economic sectors, including pulp and paper, steel, mining, agribusiness, automotive, food, chemical and consumer goods, among others. JSL also has a unique position in the Brazilian highway logistics market, as leader for 19 years and much larger than its nearest competitor.

The logistics industry in Brazil is highly fragmented, with a high level of informality and low capitalization among players. This creates opportunities for further consolidation, especially for companies with structured businesses. According to Citibank, the top 10 companies have close to a 2% market share. JSL has roughly 1% market share (almost 5x the second-largest player) and is well placed to continue consolidating the industry. JSL also has a favourable M&A track record, which has been a growth driver in recent years. JSL has acquired seven companies since its re-IPO in October 2020 implying c20% annual organic growth and c60% EBITDA growth considering the acquisitions, maintaining strong returns. 

We also expect JSL to continue expanding its ROIC going forward, driven by the ongoing consolidation of new acquisitions into JSL’s financials, the company’s strategy to becoming a less capital intensive, asset light business, and strong revenue growth to maintain gaining scale and operating leverage. The logistics industry offers a lot of opportunities to implement tech-driven innovation, and we see JSL well-positioned to use its sector platform and status as a leading tech player. The stock has performed very well this year, partially driven by rate cut expectations and also strong earnings. We expect the company to continue delivering good results in upcoming quarters amid a highly fragmented sector, creating both organic and inorganic growth engines.

The Sahm rule states that the (US) economy is likely to be in recession if a three-month moving average of the unemployment rate is 0.5 pp or more above its minimum in the prior 12 months. 

The rule identified all 12 US recessions since 1950 but gave two false positive signals based on current (i.e., revised) unemployment rate data (1959 and 2003) and four based on real-time data (additionally 1967 and 1976). 

The signal occurred after the start date of the recession in all 12 cases, with a maximum delay of seven months* (in the 1973-75 recession). 

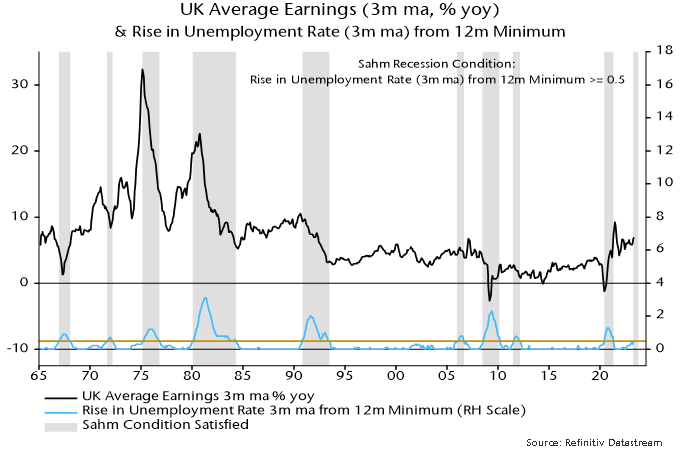
The Sahm condition hasn’t yet been met in the US – the unemployment rate three-month average was 3.6% in June versus a 12-month minimum of 3.5%. 

The rule has, however, triggered a warning in the UK, where the jobless rate averaged 4.0% over March-May, up from 3.5% over June-August 2022. 

UK Sahm rule warnings occurred on nine previous occasions since 1965, six of which were associated with GDP contractions. 

The Sahm signal is another indication that the UK economy is already in recession – see previous post – but a stronger message is that earnings growth is about to slow. 

Annual growth of average earnings fell after the Sahm signal in eight of the nine cases, the exception being the 2020 covid recession, when earnings numbers were heavily distorted by composition effects – see chart 1. 

Chart 1

Chart 1 showing UK Average Earnings (3m ma, % yoy) & Rise in Unemployment Rate (3m ma) from 12m Minimum

Previous generations of monetary policy-makers understood the dangers of basing decisions on the latest inflation and / or earnings data, which reflect monetary conditions 18 months or more ago. 

The current reactive approach, apparently endorsed by the economics consensus, may partly reflect mythology about a 1970s “wage / price spiral”. Rather than causing each other, high wage growth and inflation were dual symptoms of sustained double-digit broad money expansion. 

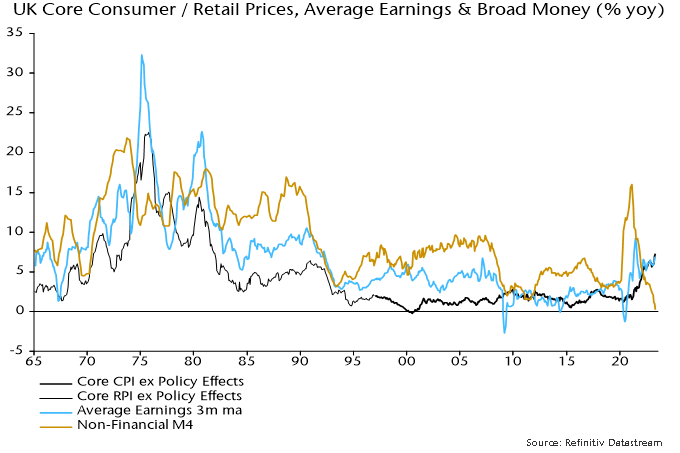
The monetarist case is summarised by chart 2, showing that earnings growth is almost coincident with core inflation whereas broad money expansion displays a long lead. (The correlations with core inflation are maximised with lags of four months for earnings growth and 24 months for money growth.) 

Chart 2 

Chart 2 showing UK Core Consumer / Retail Prices, Average Earnings & Broad Money (% yoy)

Recent monetary weakness argues that core inflation and wage growth will be much lower by late 2024; the Sahm rule signals that the decline is about to start.

*Eight months taking into account a one-month reporting lag.

Business woman looking at data on a computer at night. The coding is reflecting off of her glasses.

It seems like it happened overnight. Artificial Intelligence (AI) went from something distant that would not typically come up in small talk between colleagues (unless you work in the field, maybe), to the next great game changer that promises to transform the way everything is done. ChatGPT is now already a household name that can write homework for students, find bugs in programmers’ code or even draft a basic contract according to your specification. Just two months after the release of ChatGPT by OpenAI in November 2022, it had already become the fastest-growing software application in history with well over 100 million users. Subsequently this led to massive investments by Google, Baidu, Meta and many others to develop competing technologies to maintain their market shares.

Every time a new technology or concept is the subject of such interest, the media spends an incredible amount of resources theorizing all the different ways in which the world will be made different by this new shiny thing. Yet very few of these promised changes end up making a lasting impact. Blockchain was supposed to revolutionize the world of finance and decentralize the entire system, yet it remains a niche technology with a damaged reputation from the crypto craze.

The metaverse was sold as something that would be part of our everyday life with most households having their own VR headset, much like everyone had their own PC. We’re not quite there yet, although Apple now seems to believe this is the next big thing.

Finally, 5G was meant to unlock so many opportunities with promised better connectivity, low latency and no pocket loss. Every company was mentioning some opportunities from the internet of things to cloud gaming. All these frenzies had something in common: actors that overpromise and underdeliver in spectacular fashion, at least in the short term.

Then comes the new buzzword: generative AI. Between the Q4 2022 and Q1 2023 earnings season, the mention of AI in earning calls more than doubled among S&P500 companies. Nvidia rallied almost 200% in 2023 as one of the most obvious potential beneficiaries and is now worth over $1 trillion while trading at 40x revenues. For reference, these are dotcom bubble multiples.

Artificial intelligence as a field of research goes back to the late 1950s, 15 years after the famous Turing test was first put forward. So how did it become all the rage overnight over 60 years later? Long story short, significant advances in Large Language Models (LLM) in the last decade paved the way to commercial use of generative AI. In a context where the global economy has needed new productivity catalysts to prevent GDP deceleration and to help reduce inflationary pressure in the post-COVID era, ChatGPT seems to be filling the void almost too perfectly. As a new productivity tool that could potentially impact almost every aspect of the service economy, it’s no wonder everyone is jumping on the hype train. Nonetheless, if the commercialization of the internet is any reference, and assuming the impact of AI is of a similar size, we are still at the beginning of the dotcom/AI bubble where euphoria is high, and every company is set to either benefit from AI or disappear into irrelevance. Seasoned investors who lived through the internet bubble may offer one or more of the following pieces of advice:

  • Your internet/AI stock pick will likely prove wrong in the long term, as it will take years to fully realize the impact of the technology, while regulations can hinder companies’ plans.
  • Your stock pick could be the right one, yet the current valuation may still not make sense.
  • There are solid companies outside the tech/AI bubble that are being unfairly penalized as investors sell them to buy into the new hype stock.

Within this speculative environment, we identified an opportunity to initiate a position in a company that had been on our radar for a long time: Keywords Studios (KWS LN). Based in Ireland, Keywords is the dominant player in the fragmented market of video game outsourcing. With studios in over 26 countries, across eight different lines of business and three development divisions, Keywords operates at an unmatched scale three times larger than its closest competitor, yet with a market share of only 6%. The company offers services covering a wide range of developer requirements, including audio services, customer support for live games, marketing and social media management and bug testing.

Keywords had long been a darling in the video game small-cap space, commanding a valuation that made it challenging for us to justify an investment, despite its strong niche positioning and business model. However, near the end of April, the company appeared on an AI loser basket built by Bank of America, based on the belief that most of Keywords’ services would eventually be brought back in-house by game developers due the reduced need for labour caused by new AI technologies. This triggered a downward spiral in the share price. From that point on, negative momentum continued to feed on itself driven by index weight adjustments, loss cutting, quant signals and so on.

On closer examination, it became clear to us that the story was being misunderstood and that investors were selling services companies like Keywords indiscriminately. In fact, Keywords had already been making acquisitions and investments in AI technologies for at least a year before ChatGPT became a household name. It was already using this technology to enhance its localization services (Kantan AI), customer support business line (Helpshift), and to improve on its quality testing expertise (Mighty Games), among other things. Furthermore, Keywords is uniquely positioned to benefit from exposing its machine learning systems to a variety of games, languages and codes. It has a scale advantage that individual video game developers cannot match.

So why did we choose to invest in Keywords and not a game developer that owns its own intellectual property (IP)? The global video game market is highly hit-driven, which introduces risks and revenue lumpiness for developers, especially in the small-cap space where the number of IPs a company holds is usually limited and few games are released each year. Additionally, there is a significant ramp-up time when a new project is undertaken, as the game developer’s workload is not consistently aligned with that of the audio or functional testing teams, meaning employees may not always have the necessary workload to keep them on payroll.

In this environment, it is easy to understand why video game companies of all sizes are increasingly turning to outsourcing various stages of development. This is where Keywords excels. By working with virtually all the top gaming companies in the world, the company can leverage its scale to provide a consistent workload to its studios. Furthermore, by working across an unparalleled variety of games, Keywords builds a unique breadth of expertise without the need to manage its own IP or take on the risks associated with the release of a single title. Keywords is a great way of betting on the growth of the video game industry without making a call on specific titles or the medium on which it is consumed. The company represents most of what we would look for in a core portfolio holding: a leader in a niche market with pricing power, strong secular tailwinds and a good track record. And we got to buy it at a discount to its average valuation, thanks to investors that fell for this new AI mania.

Monetary and cycle aspects of the forecasting approach used here are currently in tension. Global real narrow money trends suggest a renewed weakening of economic momentum into late 2023. Cyclical forces, however, are scheduled to become more supportive from early 2024 as the stockbuilding cycle bottoms out and moves into a recovery phase. 

The two messages can be reconciled if real money momentum recovers over the remainder of 2023, confirming an improving outlook for 2024. Momentum is expected to be lifted by a further slowdown in inflation but a sufficient recovery is unlikely without a policy reversal by major central banks. Current signals are that such a reversal will require a dramatic deterioration in economic data and / or major market weakness. 

Economic news has been confusing, allowing optimists and pessimists to claim support for their assessments. Weakness appears the correct interpretation based on national accounts data. An average of the expenditure and income measures of US GDP rose at an annualised rate of only 0.3% in the five quarters to Q1 2023. The monthly measure of UK gross value added has flatlined since last summer while Eurozone GDP slipped into contraction in Q4 / Q1. 

Claims of economic resilience or even strength focus on solid employment growth and tight labour markets. Weak GDP expansion has been unusually jobs-rich because of a rebound in the share of lower-productivity services activities. With the goods / services split normalising, this composition boost is probably ending. 

GDP / employment divergence has been echoed in PMIs, with manufacturing weakness balanced by services strength. Again, the assumption here is that services exceptionalism is temporary, reflecting a later release of pent-up demand, suggesting focusing on manufacturing as a better guide to trend. 

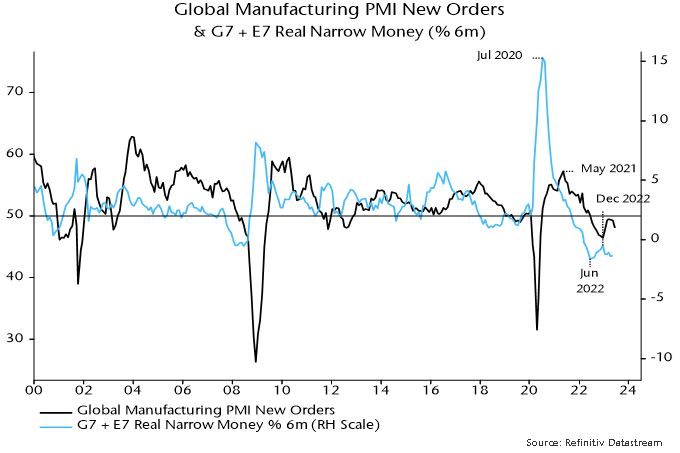
The global manufacturing PMI new orders index reached a 31-month low in December 2022, recovering modestly into the spring before falling back sharply in June. A revival and relapse had been signalled by six-month real narrow money momentum, which recovered during H2 2022 but eased again in early 2023. The recent slide extended into May, suggesting further PMI weakness into late 2023 – see chart 1. 

Chart 1

Chart 1 showing Global Manufacturing PMI New Orders & G7 + E7 Real Narrow Money (% 6m)

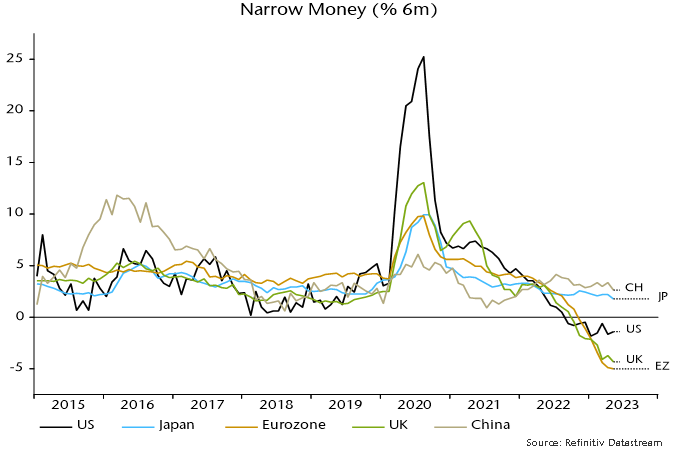
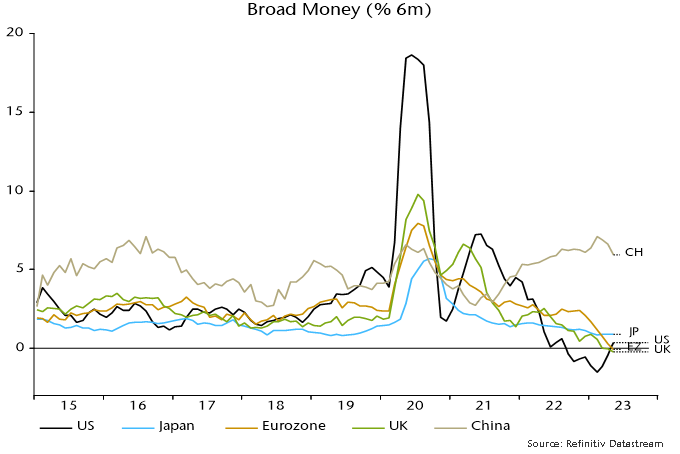
Monetary alarm bells are ringing loudest in Europe. Six-month rates of contraction of Eurozone and UK nominal narrow money quickened further in May, contrasting with less negative and stabilising US momentum – chart 2. Six-month changes in broad money have also now crossed below zero and the corresponding US change – chart 3. Trends in Sweden and Switzerland are even weaker. 

Chart 2

Chart 2 showing Narrow Money (% 6m)

Chart 3

Chart 3 showing Broad Money (% 6m)

China and India remain positive monetary outliers but narrow money momentum is modest by historical standards and has subsided recently. Relative to monetary trends, the consensus view on China looked overoptimistic at the start of 2023 and appears excessively gloomy now, although further policy easing is warranted to cushion the economy against likely export weakness despite a super-competitive exchange rate. 

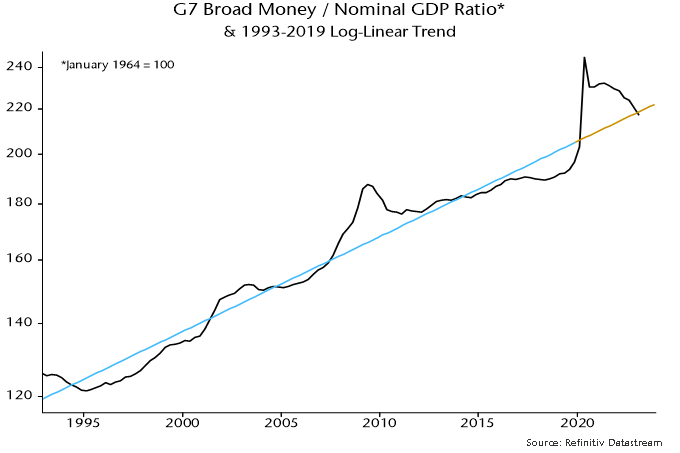
To the extent that the global economy has proved more resilient than expected, one explanation is that the impact of monetary weakness has been delayed by an overhang of “excess” money balances / savings resulting from 2020-21 stimulus. The ratio of G7 broad money to nominal GDP crossed back below its pre-pandemic trend in Q1 2023, suggesting that stock and flow arguments for pessimism are becoming aligned – chart 4. 

Chart 4

Chart 4 showing G7 Broad Money / Nominal GDP Ratio* & 1993-2019 Log-Linear Trend *January 1964 = 100

Cycle analysis is used here to provide longer-term context and a cross-check of monetary signals. Economic fluctuations reflect the interaction of three investment cycles: a shorter stockbuilding cycle typically of about 3 1/3 years in duration; an intermediate business investment cycle of 7-11 years; and a longer housing cycle averaging about 18 years. 

The business investment and housing cycles last reached lows in 2020 and 2009 respectively. If current cycles are of normal length, the next lows could occur in the late 2020s. Downswings into lows typically play out over 1-3 years so are unlikely to begin before 2025. This suggests that recent softness in housing and business investment represents a temporary correction within ongoing upswings. Current cyclical weakness, on this interpretation, reflects a downswing in the shorter-term stockbuilding cycle, which last bottomed in Q2 2020 and recently entered the time band for another low. 

Stockbuilding cycle downswings in isolation are usually associated with global economic slowdowns or at worst recessions that are modest and / or geographically contained. Examples of the latter include the 1970 US recession and the 2011-12 Eurozone downturn. Against a backdrop of monetary weakness and unusually rapid policy tightening, the expectation here has been the current downswing would be more severe and global than the norm. 

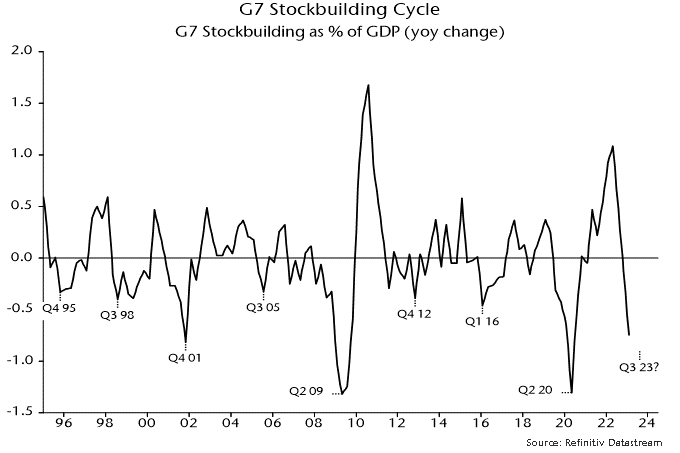
The cycle analysis suggests, however, that the window for severe economic weakness will begin to close from late 2023. Recent stockbuilding data indicate that the cycle downswing is already well-advanced, consistent with a low being reached before year-end – chart 5. A stockbuilding recovery could combine with continuing upswings in business and housing investment to drive global economic reacceleration in 2024-25. As noted, however, such a scenario requires confirmation from an early recovery in real money momentum, in turn probably dependent on H2 policy reversals. 

Chart 5

Chart 5 showing G7 Stockbuilding Cycle G7 Stockbuilding as % of GDP (yoy change)

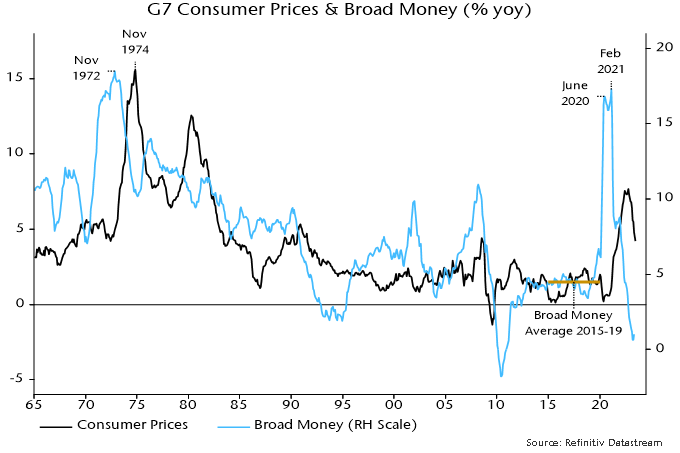
The “monetarist” forecast was that G7 headline CPI inflation would fall rapidly from early 2023, mirroring a large and sustained decline in annual broad money growth from a February 2021 peak.  This scenario is playing out: a GDP-weighted average of G7 national headline rates dropped from 6.8% in January to 4.8% in May, with a further decline to 4.2% projected for June – chart 6. 

Chart 6

Chart 6 showing G7 Consumer Prices & Broad Money (% yoy)

Broad money growth returned to its pre-pandemic average in mid-2022 so – allowing for a standard two-year lead – inflation rates may be back at pre-pandemic (i.e. target-consistent) levels in mid-2024. Recent further monetary deceleration suggests significant risk of an undershoot in late 2024 / 25. The cyclical counterargument is that stockbuilding cycle upswings are usually associated with rising commodity prices, which may support headline rates moving through 2024. 

A tendency of policy-makers and commentators to downplay headline progress and focus on stickier core readings is the mirror-image of 2021 claims that a headline surge was “transitory”. Disinflation is following the usual sequence from commodities to goods to lagging services / wages. Recent US / Eurozone data confirm a downshift in short-term core momentum, e.g. US “super-core” consumption prices – ex. food, energy, housing and used cars – rose by an annualised 3.1% between February and May, the smallest three-month gain since December 2020. 

The two global “excess” money indicators calculated here – the gap between six-month real narrow money and industrial output momentum, and the deviation of 12-month real narrow money momentum from a slow moving average – have been negative in most months since the start of 2022, suggesting an unfavourable backdrop for equity markets. Despite a strong H1 rally, the MSCI World index was 8.2% below its closing 2021 level at end-June. Cyclical sectors (including tech) lagged defensive sectors (including energy) over this period. 

An earlier hope that the first measure – the real money / output momentum gap – would turn positive during H1 was dashed by a combination of renewed monetary weakness and a production boost from an easing of supply constraints. With June global manufacturing PMI results signalling output contraction, a cross-over remains possible soon. The second measure – the deviation of real money momentum from a moving average – is further from a switch. 

Historically, equity markets outperformed cash on average only when both measures were positive – still a distant prospect. Both the current negative / negative and possible positive / negative configurations were associated with non-energy defensive sectors outperforming non-tech cyclical sectors.
Alors que le mois de la fierté tire à sa fin, la Fondation CC&L et ses employés ont réussi à recueillir 13 200 $ pour Rainbow Railroad. Tout au long du mois de juin, le Groupe financier CC&L et ses sociétés affiliées ont activement défendu la cause des personnes LGBTQ+, témoignant de notre soutien à leur sécurité et à leur droit de vivre de façon authentique, sans égard aux frontières géographiques.

Nous encourageons les particuliers et les organisations à continuer de soutenir l’égalité des personnes LGBTQ+. En amplifiant les voix, en fournissant des ressources et en prônant le changement, nous pouvons travailler collectivement à bâtir une société qui célèbre les droits et l’identité de toutes les personnes, quelle que soit leur orientation sexuelle ou leur identité de genre.

À propos de Rainbow Railroad 

Rainbow Railroad est une organisation canadienne reconnue qui se consacre à aider les personnes LGBTQ+ partout dans le monde qui sont victimes de violence, de persécution ou de discrimination en raison de leur orientation sexuelle ou de leur identité de genre. Par l’entremise d’un réseau de bénévoles et de partenaires, Rainbow Railroad offre des ressources essentielles, du soutien et des options de voyage sécuritaires qui permettent aux personnes LGBTQ+ d’échapper à des environnements oppressifs et de rebâtir leur vie dans la dignité et la liberté. Apprenez-en plus sur cet important travail à rainbowrailroad.org

Rainbow Railroad logo
Aerial photograph of a coastal car parking lot as waves break nearby.

The transportation industry has undergone significant change in recent years due to the impact of COVID-19 and technological advancements. Last mile deliveries and car sharing have emerged as important ways of reducing transportation costs. However, it’s worth noting that Uber is now more expensive than taxis in many cases. The industry is continuously transforming, with autonomous driving being a prominent example.

COVID-19 disrupted personal transportation as people avoided public transit and stayed home. But now, as we move forward, consumers are faced with hard choices to balance their budgets, and corporations are demanding increased presence in the workplace. 

According to the American Public Transportation Association (APTA), t​he average household spends 16 cents of every dollar on transportation and 93% of this amount is allocated to buying, maintaining and operating cars. This makes transportation the second-largest expenditure after housing. By opting for public transportation and reducing car ownership, households can save nearly $10,000. This saving becomes substantial when considering the average household income of $67,521 in the United States, especially if housing costs are considered fixed. 

There are several secular trends driving the growth of the public transportation market regardless of economic downturns. One such trend is the cost disparity between operating a new bus route and expanding road lanes, which continues to widen as land availability diminishes. Recent studies have also shown that road expansion leads to lower real estate prices compared to improvements in bus transit. Hence, municipalities become important stakeholders for bus transit as real estate prices directly correlate with property taxes. 

To support public transportation, governments typically provide subsidies for its operations and passenger ticketing often represents the service rather than a revenue source. In the US alone, the government has subsidized public transport with up to $108 billion, including $91 billion in guaranteed funding until 2026 under the 2021 Bipartisan Infrastructure Law. This represents the most significant federal investment in transit in the country’s history.

Demographically, millennials initiated a shift away from youth car ownership a decade ago. Accelerating immigration and rising housing costs further indicate an increased reliance on public transportation.

The global public transportation market was valued at USD214.54 billion in 2022 and is expected to grow at a compound annual growth rate (CAGR) of 3.7% from 2023 to 2030

During our recent travels to Australia, we observed the noticeable effects of accelerating immigration. Sydney and Melbourne suburbs are well-positioned for population growth thanks to their organized infrastructure and pleasant weather. The country is now attracting immigrants from beyond Southeast Asia and Melbourne in particular is a vibrant cultural hub poised for multi-year urban expansion.

We visited several real estate developments that are unaffected by slowdowns due to high immigration levels and lack of housing.

When it comes to sustainability, public transit is surpassed only by bicycles. According to the Environmental Protection Agency, transportation is responsible for 28% of greenhouse gas emissions. Whether using electric, biogas or hydrogen-powered vehicles, implementing green public transportation is crucial for controlling greenhouse gas emissions, especially as emerging markets catch up with urbanization levels. 

In the realm of public transportation, Global Alpha holds the Kelsian Group (KLS:AU). 

Headquartered in Adelaide since 1989, the Kelsian Group has emerged as a leader in public bus, marine transport and tourism operations. It consists of Australia’s most experienced providers of multi-modal public transport services and tourism experiences, operating ferry, bus and light rail services domestically and internationally. 

In 2022, the Kelsian Group transported more than 257 million customers, employing around 9,000 people and operating approximately 4,000 buses, 113 vessels and 24 light rail vehicles. 

Earlier this year, the company acquired the US-based All Aboard America to establish a presence in the US sunbelt region, which has favourable demographics. The founder of Kelsian personally relocated to Denver to ensure successful acquisition integration. 

The US bus transportation industry remains fragmented and as the market becomes more complex with the need for new technologies and multi-engine platform expertise (such as biogas, electric and hydrogen), smaller operators will struggle to compete. 

The public transportation industry qualifies as defensive growth. Bus operators typically work under multi-year agreements, often lasting seven years, with inflation adjustment clauses to protect them from cost accelerations. Their compensation is typically based on the quality of their route execution rather than the number of passengers, making low-volume routes still profitable.

Kelsian operates a best-in-class technology platform to optimize its routes and its comprehensive bus driver acquisition and training programs result in low turnover rates. Additionally, it leads the way in offering electrified biogas and hydrogen-powered transportation solutions. As we redesign transit for a greener and more connected society, the future holds tremendous opportunities.

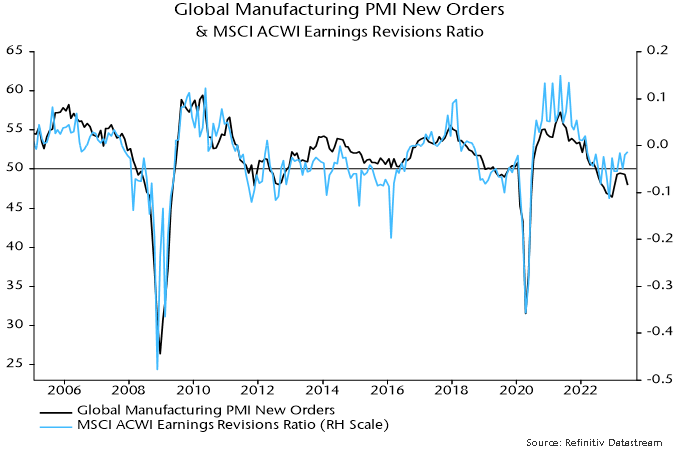
DM flash results released last week suggest that the global manufacturing PMI new orders index fell sharply in June, having moved sideways in April and May following a Q1 recovery – see chart 1. 

Chart 1

Global Manufacturing PMI New Orders, & G7 + E7 Real Narrow Money (% 6m). Source: Refinitiv Datastream.

The relapse is consistent with a decline in global six-month real narrow money momentum from a local peak in December 2022. A recovery in real money momentum during H2 2022 had presaged the Q1 PMI revival. 

Real narrow money momentum is estimated to have fallen again in May, based on partial data, suggesting further PMI weakness into late 2023. 

The global earnings revisions ratio has been contemporaneously correlated with manufacturing PMI new orders historically but remained at an above-average level in June, widening a recent divergence – chart 2. 

Chart 2

Global Manufacturing PMI New Orders, & MSCI ACWI Earnings Revisions Ratio. Source: Refinitiv Datastream.

Based on monetary trends, a reconvergence is more likely to occur via weaker earnings revisions than a PMI rebound. 

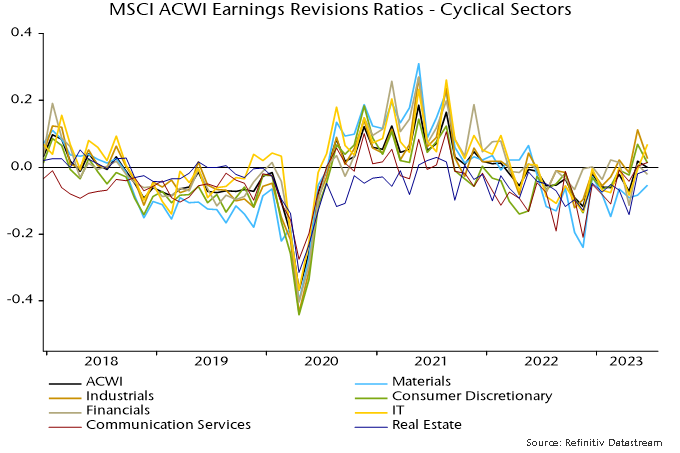
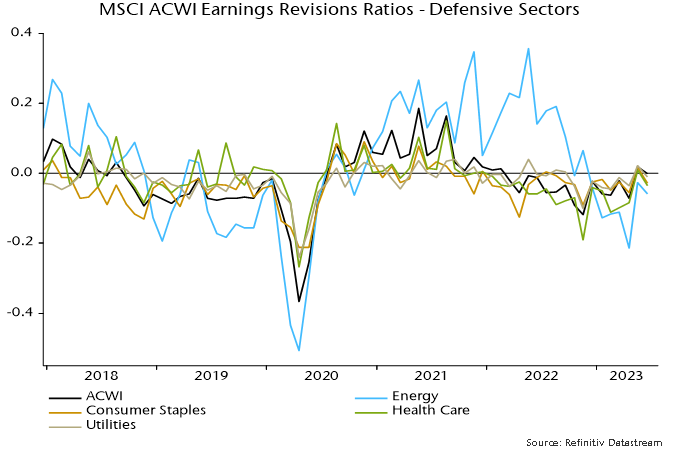
Charts 3 and 4 show that revisions resilience has been driven by cyclical sectors – in particular, IT, industrials and consumer discretionary. Notable weakness has been confined to the materials sector. Cyclical sectors may be at greater risk of downgrades if the global revisions ratio heads south. 

Defensive sector revisions have underperformed recently but are likely to be less sensitive to economic weakness. 

Chart 3

MSCI ACWI Earnings Revisions Ratios - Cyclical Sectors. Source: Refinitiv Datastream.

Chart 4

MSCI ACWI Earnings Revisions Ratios - Defensive Sectors. Source: Refinitiv Datastream.

The positive divergence of earnings revisions from the PMI may reflect firms’ ability to push through price increases to compensate for slower volumes. The deviation of the global revisions ratio (rescaled) from manufacturing PMI new orders – i.e. the gap between the blue and black lines in chart 2 – has displayed a weak positive correlation with the PMI output price index historically (contemporaneous correlation coefficient = +0.41). 

Any earnings support from pricing gains is now going into reverse: the output price index has crashed from an April 2022 peak of 63.8 to 49.8 in May, with DM flash results suggesting a further fall last month.

Photo of Sabrina Lacroix

Global Alpha accueille une nouvelle gestionnaire sénior de la conformité. Accueillons chaleureusement Sabrina Lacroix!

Mme Lacroix apporte une riche expérience à Global Alpha, puisqu’elle a auparavant occupé le poste de directrice de la conformité et des contrôles réglementaires de Trans-Canada Capital Inc. ainsi que des postes de direction aux responsabilités croissantes à Hexavest Inc., y compris celui de vice-présidente, Conformité et Affaires juridiques.

Elle est titulaire d’un baccalauréat en commerce, profil finance, de l’Université McGill et détient le titre de CFA.

En tant que gestionnaire sénior de la conformité, Mme Lacroix sera chargée de superviser les activités de conformité et de veiller à ce que nos activités de placement soient conformes à la réglementation. Sa contribution au maintien d’une culture de conformité et à la gestion de contextes juridiques complexes sera inestimable pour le succès de notre société.

Downtown business skyscrapers in Warsaw, Poland.

Our Emerging Markets team recently returned from an insightful trip to Poland, where we explored its dynamic investment landscape. Since emerging from its communist past and establishing itself as a democratic state in 1989, Poland has achieved remarkable progress. It has not only become one of the major economies in the European Union (EU), ranking after Germany, France, Italy, Spain and the Netherlands, but is also one of the region’s fastest growing.

With a population of over 38 million, Poland boasts one of the largest consumer markets in Central and Eastern Europe. The country is known for its highly educated and skilled workforce. Polish universities tend to produce graduates in the fields of science, technology, engineering and mathematics. It’s no wonder Poland has attracted major players in the EV battery and semiconductor industries, such as LG Energy Solution, SK Inc. and Intel, further cementing its reputation as an attractive investment destination. Cities like Warsaw, Krakow and Wroclaw offer a vibrant startup environment, presenting excellent investment opportunities in technology, gaming and entrepreneurship. Notably, Poland is home to nearly 500 gaming companies employing over 14,000 people.

The country has also benefited from the recent settlement of 1.5 million Ukrainians fleeing Russia’s invasion who are expected to make Poland their permanent home, providing a significant boost to the local economy. Ukrainian can be heard on almost every major Polish street.

Poland’s accession to the EU in 2004 played a pivotal role in its development, granting Polish businesses unprecedented access to a vast market and creating abundant opportunities for growth. The EU membership also facilitated access to funds for infrastructure development, research and other strategic projects, contributing to Poland’s progress.

During our visit, we engaged with our holding companies, explored potential ideas and attended a consumer and technology conference. Key takeaways from our meetings include Polish companies rapidly expanding across Europe, intense competition in the grocery sector (especially from discounters), Polish consumers dealing with high inflation and negative wage growth (but that situation has likely bottomed), concerns surrounding the upcoming Fall parliamentary elections and the hope that the resolution of the war in Ukraine will open up vast opportunities for Polish companies.

Although the current level of inflation remains high, it meaningfully declined to 13% in May from 18.4% in February, mainly driven by moderating food and energy prices. Poland’s central bank has kept its key policy rate unchanged at 6.75% since September 2022, with the governor mentioning the possibility of rate cuts later this year under certain conditions. Meanwhile, the Polish labour market remains robust, with a record low unemployment rate of 5.2% as of April 2023.

A historic mass protest in Warsaw on June 4 that saw as many as 500,000 demonstrators gathering was primarily driven by a controversial law proposed by the ruling party, raising concerns about potential misuse against opposition leaders. The demonstrations also highlighted such issues as inflation and women’s rights.

We anticipate that inflation in Poland will likely persist at a high single-digit level through to 2024. The outcome of the parliamentary elections could either maintain the current political status quo or unlock the flow of EU funds to the country. Additionally, there is potential for a gradual decline in the country risk premium as geopolitical factors become less disruptive.

Considering the current situation, Poland’s equity market looks attractively valued. The WIG20 Index, consisting of the 20 largest Polish companies, trades at a forward P/E ratio of 8.3x, below its 10-year average of 10.9x and the broader MSCI Emerging Markets Index of 11.3x. Foreign investors and operators have shown increased interest in both Polish public and private companies, with notable examples including UK Entain’s acquisition of STS Holdings, German Mutares’ acquisition of Arriva Poland and Czech PPF’s acquisition of a 15% stake in InPost (INPST), an e-commerce logistics company with a strong ESG profile.

Taking advantage of what we believe to be a temporary dislocation in Poland-based equities, we initiated positions in InPost and Grupa Kety SA (KTY), a manufacturer of aluminum products and flexible packaging.

InPost specializes in out-of-home parcel delivery services primarily in Poland, as well as France, the UK, Spain, Portugal and Italy. Through a network of approximately 30,000 automated parcel machines (APM) and 27,000 pick-up and drop-off points, InPost offers a cost-efficient alternative with a significantly reduced carbon footprint compared to traditional door-to-door delivery. The company’s logistics infrastructure in Poland, supported by an efficient technology platform, covers first, middle and last-mile capabilities. We are impressed by InPost’s dominant market position in the rapidly growing Polish market, aided by attractive business economics. Its first-mover advantage in Poland provides a solid foundation for international expansion, further amplified by the acquisition of Mondial Relay in 2021, which unlocked substantial opportunities in Western Europe. Notably, InPost is still guided by its visionary founder, who retains a significant ownership stake in the company.

Grupa Kety is the leading Polish producer of aluminum products used in construction, automotive industries and flexible packaging for household products, confectioneries, pharmaceuticals and cosmetics. With a consistent track record of revenue growth and profitability, Grupa Kety holds a strong market-leading position. The company is led by a stable and professional management team with an impressive track record. We believe Grupa Kety is well-positioned to increase its market share within the EU and expand into higher-margin hard alloys.

Despite visible challenges, Poland presents compelling investment opportunities in various sectors. The country’s economic potential, combined with its strategic advantages and ongoing developments, make it an attractive prospect for investors looking to capitalize on its growth trajectory.