Why believe the “monetarist” forecast that recent G7 monetary weakness will feed through to low inflation in 2024-25? 

Monetary trends correctly warned of a coming inflationary upsurge in 2020 when most economists were emphasising deflation risk. 

The forecast of rapid disinflation is on track in terms of the usual sequencing, with commodity prices down heavily, producer prices slowing sharply and services / wage pressures showing signs of cooling. 

A further compelling consideration is that the monetary disinflation expected in G7 economies has already played out in emerging markets. 

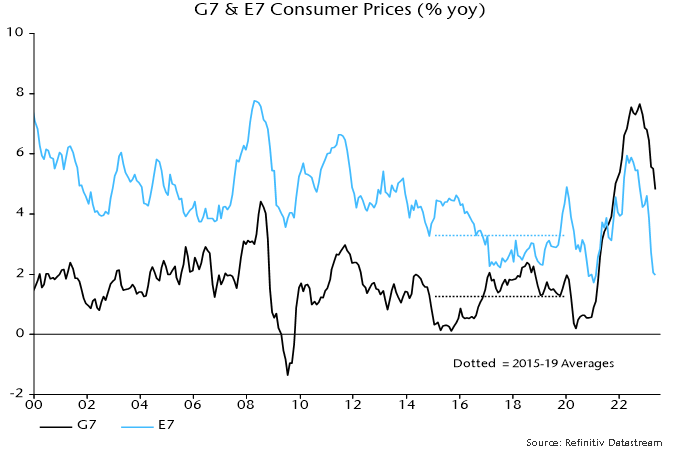
A GDP-weighted average of CPI inflation rates in the “E7” large emerging economies* crossed below its pre-pandemic (i.e. 2015-19) average in March, falling further into May – see chart 1. 

Chart 1

G7 & E7 Consumer Prices (% yoy). Source: Refinitiv Datastream.

The E7 average is dominated by China but inflation rates are also below or close to pre-pandemic levels in Brazil, India and Russia. 

Inflation rose by much less in the E7 than the G7 in 2021-22, opening up an unprecedented negative deviation that has persisted. 

The recent plunge in the E7 measure reflects a significant core slowdown as well as lower food / energy inflation. 

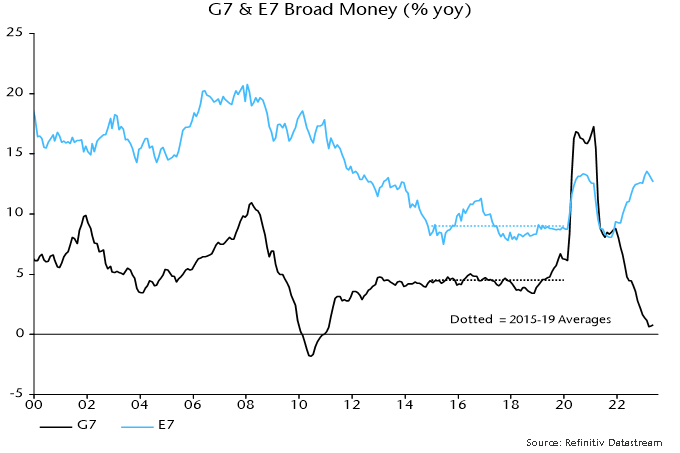
The divergent G7 / E7 experiences are explained by monetary trends. Annual broad money growth rose by much less in the E7 than the G7 in 2020 and returned to its pre-pandemic average much sooner – chart 2. 

Chart 2

G7 & E7 Broad Money (% yoy). Source: Refinitiv Datastream.

E7 broad money growth crossed below the pre-pandemic average in May 2021. CPI inflation, as noted, followed in March 2023, i.e. consistent with the monetarist rule of thumb of a roughly two-year lead from money to prices. 

G7 broad money growth crossed below its pre-pandemic average in August 2022 and has yet to bottom, suggesting a return of inflation to average in summer 2024 and a subsequent undershoot. 

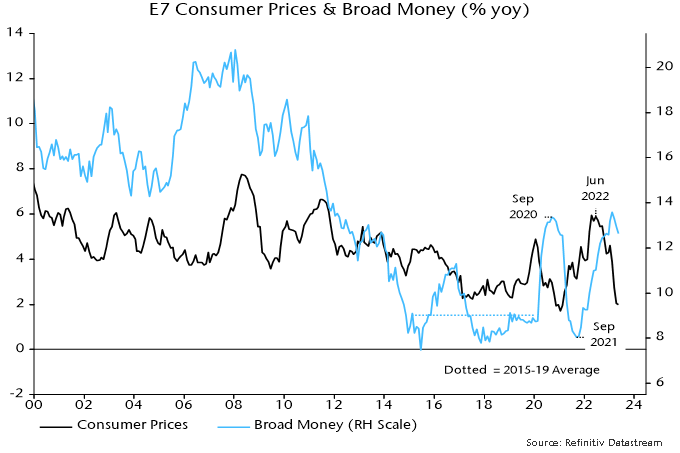
E7 disinflation, however, may be close to an end. Annual broad money growth has recovered strongly from a low in September 2021, signalling a likely inflation rebound during 2024 – chart 3. Broad money acceleration has been driven by China, Russia and Brazil. 

Chart 3

E7 Consumer Prices & Broad Money (% yoy). Source: Refinitiv Datastream.

E7 annual broad money growth is around the middle of its longer-term historical range and has eased since February. Chinese numbers may have been temporarily inflated by a shift in banks’ funding mix in favour of deposits. 

The expected rise in E7 inflation may not extend far but restoration of a positive E7 / G7 differential is likely in 2024.

*E7 defined here as BRIC + Korea, Mexico, Taiwan.

Piles de pièces assises sur un fond de graphique financier.

Les investisseurs institutionnels sont souvent confrontés à la décision de protéger ou non leurs placements étrangers contre les fluctuations des taux de change. La vigueur ou la faiblesse d’une devise par rapport à une autre, comme le dollar canadien par rapport au dollar américain, est une préoccupation courante. Plusieurs mythes concernant les devises peuvent influencer les décisions de placement.

Mythe 1 – Les fluctuations des taux de change ont le même effet sur toutes les sociétés.

Bien que la majorité des sociétés des marchés boursiers mondiaux payent des coûts et génèrent des revenus dans différentes devises, les fluctuations des taux change n’ont pas la même incidence dans tous les cas. Les sociétés des marchés boursiers mondiaux peuvent être réparties en quatre grandes catégories.

Multinationales Ressources naturelles Exportateurs Centrées sur le marché intérieur
Coca-Cola Shell Nissan Itau
Unilever AngloGold Ashanti Swatch Unibanco
Multinationales Coca-Cola Unilever
Ressources naturelles Shell AngloGold Ashanti
Exportateurs Nissan Swatch
Centrées sur le marché intérieur Itau Unibanco
 

Dans la catégorie la plus importante, les sociétés multinationales, les coûts et les revenus sont exprimés dans plusieurs devises. Les fluctuations du taux de change de la monnaie nationale auront donc une incidence sur le rendement et la volatilité des sociétés individuelles.

Dans le cas des entreprises liées aux ressources naturelles, comme celle des secteurs de l’énergie et des mines, le facteur qui a le plus d’effet sur le rendement et la volatilité est la variation du prix du produit de base qu’elles exploitent.

Les exportateurs génèrent la plus grande partie de leur chiffre d’affaires à l’étranger, par conséquent, la faiblesse de la monnaie nationale peut être avantageuse, parce qu’elle rend leurs produits plus concurrentiels, tandis qu’une monnaie forte peut avoir l’effet inverse.

Les entreprises centrées sur leur marché intérieur œuvrent principalement sur leur marché national, donc, les fluctuations des taux de change ont une faible incidence sur le rendement et la volatilité.

Mythe 2 – Les gestionnaires de placement s’occupent de gérer le risque de change.

Les méthodes de gestion des taux de change varient selon le style et le processus de chaque gestionnaire de placement. En règle générale, la première considération est propre au titre : les entreprises sont classées en grandes catégories, comme cela est décrit dans le Mythe 1, afin d’évaluer comment chaque société gère les répercussions des taux de change sur ses activités, ce qui permet au gestionnaire de placement de déterminer le risque de change « réel » de chaque société.

Les gestionnaires de placement qui privilégient une approche fondamentale analysent la surpondération de certaines devises résultant du processus de sélection d’actions et de répartition sectorielle, afin de déterminer si une couverture est nécessaire pour se rapprocher de la répartition de l’indice de référence. Cette analyse n’entraîne pas toujours l’adoption d’une couverture.

En revanche, les gestionnaires systématiques (quantitatifs) perçoivent souvent une exposition au risque de change différente de celle de l’indice de référence comme un risque non compensé et les différences de change engendrées par le processus de sélection des titres sont couvertes, afin qu’elles aient un effet globalement neutre par rapport à l’indice de référence, après avoir examiné les coûts associés à la couverture.

Mythe 3 – Les actions mondiales sont plus volatiles que les actions canadiennes.

Sur des périodes plus courtes (p. ex., périodes mobiles de trois ans), le rendement des actions mondiales a généralement été moins volatil que celui des actions canadiennes, malgré l’exposition au risque de change. Toutefois, sur de courtes périodes, les actions mondiales peuvent être plus volatiles. La figure 1 présente la volatilité relative des rendements des actions canadiennes (représentées par l’indice S&P/TSX) sur des périodes mobiles de trois ans par rapport aux actions mondiales (représentées par l’indice MSCI Monde non couvert). Lorsque la courbe de volatilité dépasse la ligne horizontale de 0 %, cela indique que les actions canadiennes ont été plus volatiles. À l’inverse, lorsque la courbe de volatilité descend en dessous de la ligne horizontale, cela indique que les actions mondiales ont été plus volatiles. En général, les actions canadiennes ont été plus volatiles.

Figure 1 : Volatilité relative des actions canadiennes et mondiales

Source : Bloomberg and MSCI

Toutefois, l’analyse à long terme (rendements sur des périodes mobiles de 10 ans) montre que les actions mondiales ont été presque systématiquement moins volatiles que les actions canadiennes (figure 2), car les occasions de placement sont plus diversifiées.

Figure 2 : Volatilité des rendements absolus des actions canadiennes et mondiales

Source : Bloomberg and MSCI

Mythe 4 – Couvrir le risque de change réduit la volatilité des actions mondiales.

Comme les investisseurs institutionnels détiennent souvent des portefeuilles diversifiés comprenant des actions mondiales, l’exposition aux taux de change est un facteur important. Même si la couverture des taux de change est souvent perçue comme nécessaire pour réduire la volatilité, les recherches montrent que ce n’est peut-être pas toujours la meilleure approche. La figure 3 montre que la volatilité des rendements sur des périodes mobiles de trois ans a généralement été plus faible sans couverture des taux de change, surtout depuis le milieu des années 1990. Cela s’explique par le fait que les fluctuations des taux de change peuvent compenser les fluctuations du rendement, ce qui réduit la volatilité globale des placements. Lorsque la courbe de volatilité relative dépasse la ligne horizontale de 0 %, la couverture du taux de change des actions mondiales a réduit la volatilité du rendement. Sous la ligne horizontale de 0 %, les placements en actions mondiales non couverts ont produit des rendements moins volatils.

Ne pas couvrir le risque de change peut avoir des avantages, comme la capacité de tirer parti des fluctuations de change favorables. Toutefois, le risque de change peut aussi accroître le risque global d’un portefeuille et doit être surveillé et géré avec soin pour s’assurer qu’il demeure acceptable pour chaque investisseur.

Figure 3 : Actions mondiales couvertes et non couvertes

Source : Bloomberg and MSCI

Mythe 5 – Couvrir le risque de change à 50 % est la stratégie optimale.

Les recherches indiquent souvent qu’un ratio de couverture de 50 % est optimal. Toutefois, la décision de couvrir le risque de change dépend de l’investisseur et de sa perspective concernant le risque, ainsi que du risque de change d’un portefeuille. Par exemple, les stratégies de couverture doivent être adaptées au portefeuille de l’investisseur. La figure 4 montre que le niveau de couverture nécessaire dépend du risque de change total du portefeuille d’un investisseur. Les portefeuilles des investisseurs A et B ont une exposition nette de 30 % au risque de change, même s’ils ont des ratios de couverture très différents.

Figure 4 : Conséquences d’un ratio de couverture de 50 %

  Exposition au risque de change (a) Ratio de couverture (b) Net currency exposure (a-b)
Investisseur A 60 % 50 % 30 %
Investisseur B 30 % 0 % 30 %
  Investisseur A Investisseur B
Exposition au risque de change (a) 60 % 30 %
Ratio de couverture (b) 50 % 0 %
Exposition nette au risque de change (a-b) 30 % 30 %
 

Du point de vue du risque, un ratio de couverture de 50 % peut être recommandé pour gérer le « risque de regret », c’est-à-dire le regret qu’un investisseur éprouvera s’il décide de complètement couvrir ou de ne pas couvrir du tout le risque de change et que cette décision s’avère ne pas être la bonne.

La figure 5 compare le rendement des actions américaines non couvertes sur des périodes mobiles de trois ans moins le rendement des mêmes actions entièrement couvertes (ligne orange), ainsi que le rendement non couvert moins le rendement obtenu avec un ratio de couverture de 50 % (ligne verte). Lorsque le rendement relatif sur une période mobile de trois ans est au-dessus de la ligne horizontale de 0 %, la décision de ne pas couvrir le risque de change a permis d’enregistrer un meilleur rendement. Lorsque le rendement relatif est en dessous de la ligne horizontale, la décision de couvrir le risque de change a permis d’enregistrer un meilleur rendement.

Figure 5 : Regret lié à la gestion du risque de change

Source : Bloomberg and MSCI

La stratégie de couverture à 50 % visant à gérer le « risque de regret » minimise les rendements relatifs extrêmes, ce qui peut être avantageux pour certains investisseurs.

Dans un monde idéal, les investisseurs préféreraient une approche dynamique de la gestion des taux de change leur permettant de ne pas couvrir le risque de change lorsque le dollar canadien perd de la vigueur et de couvrir ce risque lorsque le dollar canadien prend de la vigueur.

Fixer des seuils qui déclencheront la couverture et son montant en fonction de la vigueur ou de la faiblesse relative de la devise pourrait être une option. La figure 6 ci-dessous donne un exemplede seuils pouvant être utilisés pour un portefeuille indiciel d’actions américaines.

Figure 6 : Seuils dynamiques

Taux de change ($ USD pour 1 $ CA) % d’actions américaines à couvrir
Supérieur à 0,90 $ 0 %
De 0,85 $ à 0,90 $ 20 %
De 0,75 $ à 0,85 $ 40 %
Inférieur à 0,75 $ 60 %
Taux de change
($ USD pour 1 $ CA)
% d’actions américaines à couvrir
Supérieur à 0,90 $ 0 %
De 0,85 $ à 0,90 $ 20 %
De 0,75 $ à 0,85 $ 40 %
Inférieur à 0,75 $ 60 %
 

Selon l’analyse du rendement relatif sur une période mobile de trois ans, la figure 7 montre la différence entre le rendement produit avec un ratio de couverture fixe de 50 % et celui produit avec une approche dynamique fondée sur des seuils. L’approche dynamique n’offre pas systématiquement un avantage et, en fait, la stratégie de couverture fixe a produit le meilleur rendement relatif, de 2005 à 2013. L’analyse ne tient pas compte du coût de la couverture. Étant donné que l’approche dynamique exige plus de temps et de surveillance, et qu’il faut des décennies pour produire un avantage significatif, il est probable qu’elle serait abandonnée au profit d’autres stratégies potentiellement plus rentables.

Figure 7 : Couverture fixe ou dynamique (rendements relatifs)

Source : Bloomberg and MSCI

Abonnez-vous aux mises à jour
Nous sommes heureux d’annoncer qu’Andy O’Brien s’est joint à Banyan à titre de partenaire opérationnel pour cibler des occasions d’investissement dans les segments de l’alimentation et des boissons, des produits de consommation et des espaces commerciaux et nous permettre d’acquérir des entreprises dans ces segments.

Andy est un dirigeant accompli qui compte plus de 30 ans d’expérience dans divers secteurs. Il possède de vastes connaissances en matière de stratégie de marque, de développement de produits et d’expansion des affaires, et il a constamment obtenu un rendement exceptionnel tout au long de sa carrière.

Avant de se joindre à Banyan, Andy a occupé le poste de chef de la direction de M&M Food Market, où il a dirigé de nombreuses initiatives stratégiques, dont le nouveau positionnement de la marque, le remaniement du portefeuille de produits, la réorganisation du réseau de magasins existants, le développement d’un programme de fidélisation et l’établissement d’un canal de commerce électronique. Il a finalement conduit l’entreprise jusqu’à sa vente à Parkland Corporation en 2022, qui a été couronnée de succès.

Auparavant, Andy a contribué à l’acquisition et à la direction de The WORKS Gourmet Burger Bistro et a assuré l’excellente gestion de plus de 275 établissements à titre de président de Montana’s BBQ & Bar et de Kelseys Original Roadhouse. Apprenez-en plus sur nos critères d’investissement avec Andy.

Apprenez-en plus sur nos critères d’investissement avec Andy

Découvrez notre réseau de partenaires opérationnels

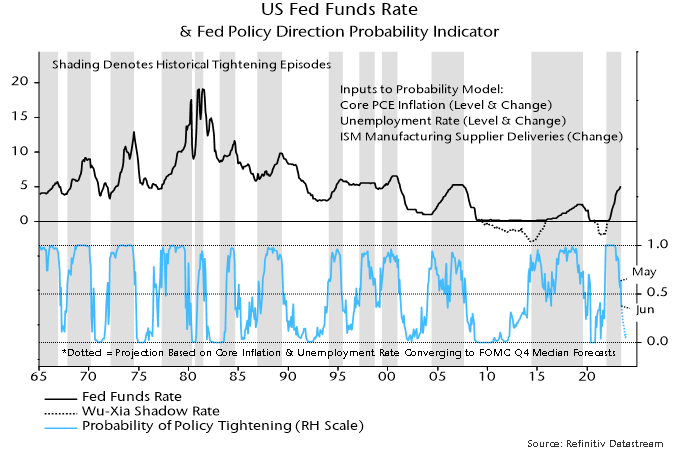
The FOMC’s updated economic forecast for the remainder of 2023 is inconsistent with Committee members’ median expectation of a further 50 bp rise in official rates during H2, according to a model based on the Fed’s past behaviour. Policy is more likely to be eased than tightened if the forecast plays out. 

The model estimates the probability of the Fed tightening or easing each month from current and lagged values of core PCE inflation, the unemployment rate and the ISM supplier deliveries index, a measure of production bottlenecks. It provides a simple but satisfactory explanation of the Fed’s historical decision-making, i.e. the probability estimate was above 50% in most tightening months and below 50% in most easing months – see chart. 

US Fed Funds Rate & Fed Policy Direction Probability Indicator.

The probability of the Fed tightening at yesterday’s meeting had been estimated by the model at 36%, the first sub-50% reading since September 2021. (The FOMC started to taper QE at the following meeting in November.) 

The FOMC’s median forecast for core PCE inflation in Q4 was revised up to 3.9% from 3.6% previously (currently 4.7%). The unemployment rate forecast was lowered to 4.1% from 4.5% (currently 3.7%). 

The model projections shown in the chart assume that core PCE inflation and the unemployment rate converge smoothly to the Q4 forecasts, while the ISM supplier deliveries index remains at its current level. Despite the revisions, the probability estimate still falls to below 10% in Q4, consistent with the Fed beginning to ease by then. 

The projections highlight the Fed’s historical sensitivity to the rates of change of core inflation and unemployment as well as their levels. It would be unusual for policy-makers to continue to tighten when inflation and unemployment are trending in the “right” directions, especially given the magnitude of the increase in rates to date. 

One difference from the past is that Fed now forecasts its own actions. Has yesterday’s guidance that rates have yet to peak boxed policy-makers into at least one further rise? This may mean that the model’s probability estimate for July – currently 29% – is too low. Still, next month’s decision will hinge on data, with inertia plausible barring stronger-than-expected news.

India Gate, New Dehli, India.

Summary

  • EM equities were down through the month, with China the key drag as investors were disappointed by weaker than expected consumption figures.
  • Cyclical markets exposed to energy and commodities including the Gulf states and South Africa posted negative returns. Our view is that these parts of the market will remain vulnerable as the global economy deteriorates on the back of very weak money numbers.
  • Pro-democracy parties swept Thailand’s national elections, led by the progressive Move Forward Party which is set to form a governing coalition with Pheu Thai and four other smaller parties. However, a Senate dominated by figures appointed by the military government that seized power in a 2014 coup threatens to delay the appointment of the governing coalition and the appointment of Move Forward’s leader Pita Limjaroenrat as Prime Minister. Uncertainty will hang over Thai equities as the tussle between the coalition and the Senate plays out in the coming months.
  • Despite unorthodox economic policy sparking surging inflation and a collapsing economy, Turkish President Recep Tayyip Erdogan secured a third decade in power, winning a second round run-off against opposition coalition leader Kemal Kilicdaroglu.
  • Semiconductor names in Taiwan and Korea surged on the investor frenzy over AI technology sparked by Nvidia reporting Q1 sales and management guidance which were streets ahead of sell-side expectations.

India remains one of the best structural stories in EM

NS Co-CIO Ian Beattie returned from a research trip in India this month, and he was keen to emphasise that the story of India’s rapid rise is still on:

“My thesis that this still feels like China 30 years ago is intact. Now imagine that with strong institutions and democracy. Of course, we are dealing with a massive and diverse country you have to embrace the mess, chaos, bureaucracy, the riots, shocking Gini coefficient and all that entails. BUT, it is improving in almost all of the important areas. And you make money on the delta, don’t you?

India as the fastest growing major economy has grabbed headlines but it is ongoing. Structural reform, societal change (slow), tax and social reform (incredible), it feels like a virtuous circle. United Payments Interface (UPI) is now a success on a global scale.

Sustained progress buttressed the popularity of Prime Minister Modi, liked by the poor as well as the shopkeepers. The poor and middle classes are getting wealthier and feel that there is less skimming from the top.

Infrastructure is improving, employment is up. Tax collection is up. It feels like things are improving for almost everyone.

I am seeing first-hand the increasing aspirations in younger generations. Though it will be a challenge for the government to stay ahead of this I imagine it opens up a completely new political landscape and many opposition parties will be unable to resort to traditional tactics.

Indian stocks are relatively less expensive than on my last visit, having traded lower and recovered to similar levels, whilst very strong GDP growth and good earnings have come through.

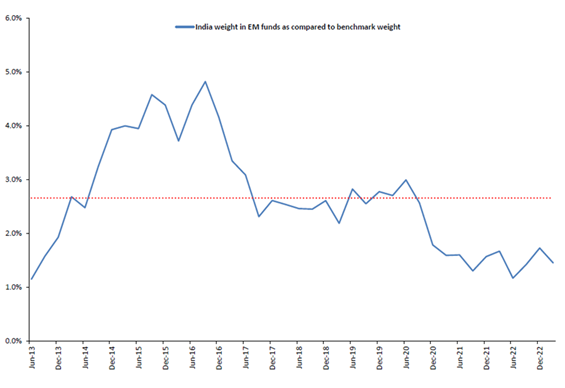
Foreign investors in Indian equities are back to a very small overweight, while locals fear a retreat by retail investors as positive momentum has faded.

Foreign investor positioning modest overweight

Chart showing India weight in EM funds as compared to benchmark weight.

Source: Jefferies, 2023.

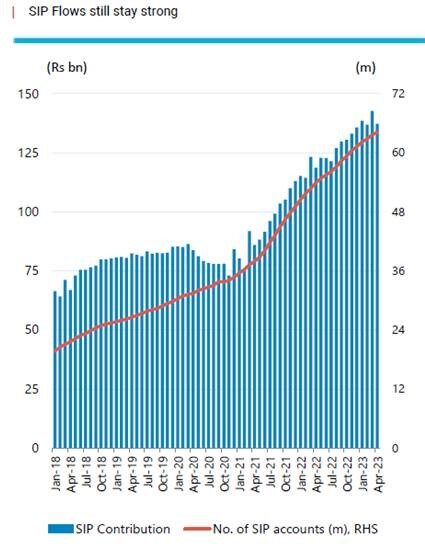
However, this misses the structural story at play which is becoming increasingly important – that is the rising importance of domestic flows from local mutual funds seeing inflows from Systematic Investment Plans (SIPs).

Structural change in EM can be a key return driver

Chart showing SIP contribution compared to number of SIP accounts (m), RHS from January 2018 to April 2023.

Source: Jefferies, 2023.

Flows from a young and growing cohort into domestic mutual funds are boosting local liquidity, with long time horizons suited to equities exposure and more incentivised than foreign investors to push on Indian corporates to improve governance.

Be careful of relying too much on your mean reversion tables when structural change like this is underway. Prices are no longer set in London or New York, but rather in Delhi or Mumbai.”

India’s embrace of digital payments infrastructure is supercharging its development

India is a country of 1.4 billion people, 22 languages, 1 billion mobile connections and 800 million internet users. Yet only 6% are income taxpayers and only 6% transact digitally for commerce.

Leveraging technology and widespread connectivity is seen by policymakers as a massive development opportunity to draw more people into the formal economy while supporting innovation and relieving economic bottlenecks in India.

Enabling access to banking is an early example of how digital technology is being utilised – banking penetration went from 20% of the population in 2008 to 100% by 2017/18. During the pandemic, banking access – linked up to the Aadhaar digital identification program and the United Payments Interface (UPI) was pivotal in enabling the swift and targeted transfer of around $4.5 billion worth of benefits to 160 million beneficiaries.

India has emerged as a leader in the development of Digital Public Infrastructure (DPI), which is pervasive and inclusive with 1.36 billion unique digital IDs, facilitating tens of billions of payments each year, and covering 10 million GST-registered companies.

At the heart of this is UPI, a real-time payments system established in 2016 which has quickly become the world’s largest real-time digital payments market. In 2020, 25.5 billion transactions were registered on UPI. The technology allows users across India to use their smartphones to quickly set up and transact using cardless accounts accessed using personalised QR codes, and utilise services including overdrafts, autopayments and voice-based payments. The system is even being expanded internationally, enabling free and instant cross-border transactions (versus pricey transactions via SWIFT) in a number of different currencies to and from India, which is the world’s largest remittances market – worth over US$100 billion in 2022 (World Bank). 

This has been a game-changer for India. Besides our oft-quoted reforms (bankruptcy law, demonetisation, clean water and electricity roll out, infrastructure spending, public toilets in rural areas, etc.), UPI has proven incredibly successful and has been crucial in ensuring welfare payments get to the right people, reducing waste and corruption, increasing tax revenues and giving more people bank accounts and phones.

What does this all mean for investors in emerging markets? While positive, initiatives like UPI, bankruptcy reform or sanitation may seem relatively trivial in isolation. However, it is the compounding effect of these incremental steps over a sustained period that can create a virtuous circle that unlocks the next upward shift on the development ladder. For a country the size of India, that progress will see several hundred million Indians join the formal economy and accumulate wealth, which can in turn present a host of opportunities for investors with the framework to harness these structural tailwinds.

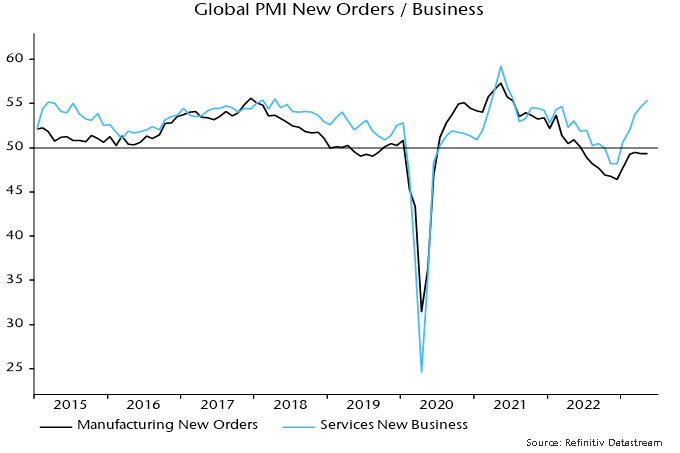
Global growth optimists expect continued solid services sector expansion to offset manufacturing weakness. PMI results for May appear, on first inspection, to support this view: services activity and new business indices rose further to 18- and 22-month highs respectively even as manufacturing new orders remained stalled below 50 – see chart 1. 

Chart 1

Chart 1: Global PMI New Orders /  Business. Chart compares manufacturing new order vs. services new business from 2015 to 2023. Source: Refinitiv Datastream.

There are, however, several reasons for discounting the strong headline services readings. 

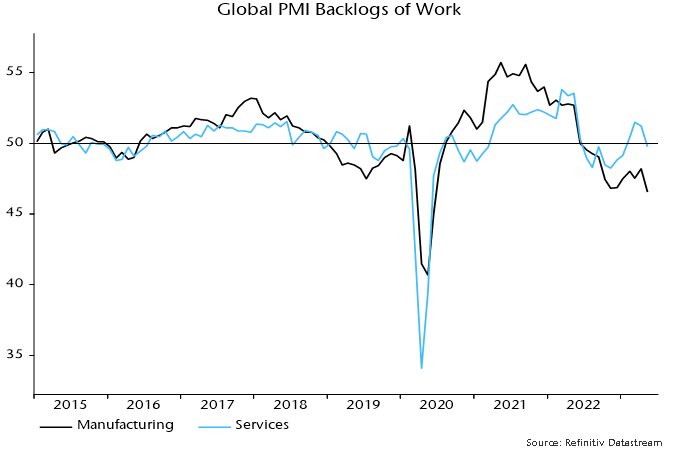
First, backlogs of services work fell sharply to a four-month low despite stronger new business – chart 2. This suggests that current output is running ahead of incoming demand, in turn implying a future adjustment lower unless demand picks up further. 

Chart 2

Chart 2: Global PMI Backlogs of Work. This chart compares manufacturing vs. Services from 2015 to 2023. Source: Refinitiv Datastream.

Manufacturing backlogs also fell sharply last month, breaking below their November 2022 low. 

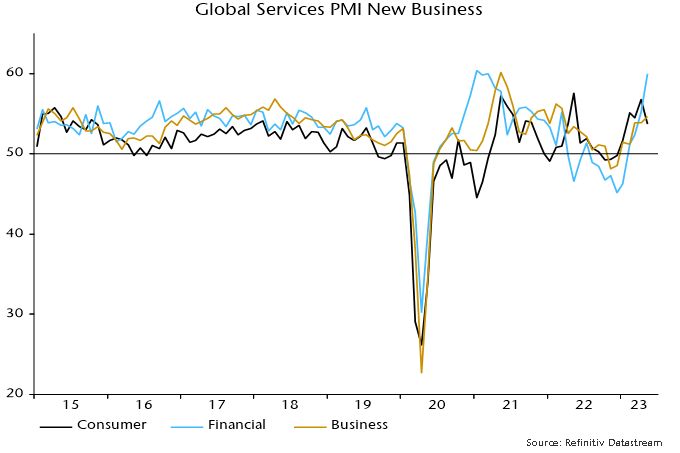
Secondly, the sectoral breakdown of the activity and new business indices shows that May rises were driven by a surge in financial services – chart 3. Consumer services indices eased on the month. Financial services strength is difficult to understand given monetary stagnation, slowing bank lending and flat trading volumes, so may prove short-lived. 

Chart 3

Chart 3: Global Services PMI New Business. This chart compares consumer, financial, and business from 2015 to 2023. Source; Refinitiv Datastream.

Thirdly, the high May readings of the global activity and new business indices reflect strong contributions from the US and Chinese components but national services surveys are significantly weaker. 

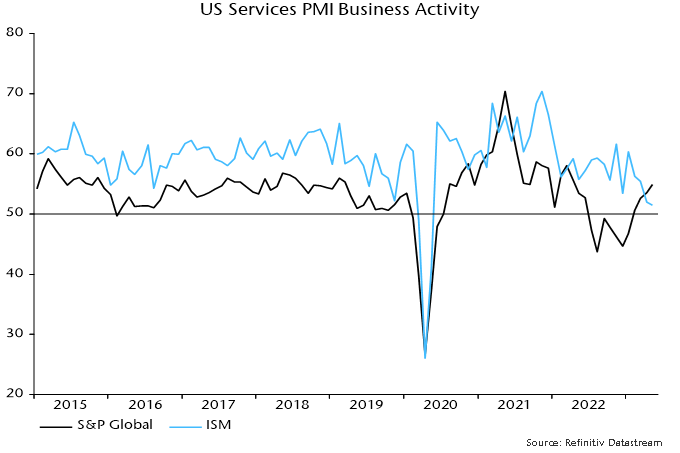
The US ISM services activity index fell to a three-year low in May even as the S&P Global equivalent series reached a 13-month high – chart 4. 

Chart 4

Chart 4: US Services PMI Business Activity. This chart compares S&P Global vs ISM from 2015 to 2023. Source: Refinitiv Datastream.

The Chinese NBS non-manufacturing new orders index moved below 50 in April and fell further in May, in puzzling contrast to the S&P Global / Caixin services new business index, which reached its second-highest level since November 2020. 

The global manufacturing new orders and services new business indices have been strongly correlated historically but statistical tests indicate a tendency for manufacturing to lead services rather than vice versa*. With global monetary trends continuing to give a negative economic signal, the current unusually wide gap is more likely to be closed by services weakness than a manufacturing revival. 

*In regressions using monthly data with three lags, lagged manufacturing new orders terms are significant in the regression for services new business, but lagged services new business terms are insignificant in the regression for manufacturing new orders.

Road intersection illuminated by neon lights in downtown Shanghai at night.

With the economic recovery slowing, one of the few central banks reducing rates due to deflation fears, increasing trade tensions and geopolitical escalation, risk-averse foreign investors are reducing their weighting of China’s financial markets. This decline in investment is driving down both stock prices and the value of the yuan.

The real estate sector, which combined with related industries accounts for 20% to 30% of China’s GDP, has not rebounded as expected. China’s new home sales by area fell 11.8% on the year in April, following a drop of 3.5% in March.

I recently spent close to a month in China, visiting relatives and friends for the May Day holiday that runs from April 29 to May 3. I also had the opportunity to meet many entrepreneurs, government officials, professionals and students as well as many of our holdings and companies we are interested in.

I spent a few weeks in Jiangsu province, a province about the size of Portugal or Kentucky that borders Shanghai. It is a province of 85 million people that has the second-highest GDP per capita (US$21,647 nominal), again higher than Portugal or Greece. If it were a country, it would be the 10th-largest economy in the world, just behind Canada and ahead of Brazil. As a US state, it would be the fifth-largest by nominal GDP, just behind Florida.

I also spent a week in Sichuan and its capital Chengdu, a modern metropolis of 26 million people, the fourth-largest city in China. The country’s so-called Western capital, Chengdu’s history dates back over 5,000 years. Nowadays, it is recognized by UNESCO as a city of gastronomy and is most often associated with the giant panda that makes the region its home. Although 1,700 km away from Shanghai, it is considered a beta+ (global second-tier) city, together with places like Washington DC, Miami, Houston, Berlin and Barcelona. More than 300 Fortune 500 companies have operations in Chengdu.

I spent my last week in Shanghai which needs no introduction, a global metropolis of 34 million people.

I will share my observations in no order of importance.

Geopolitics

During my stay, I did not witness or hear much about trade issues and other tensions that North American news outlets tend to cover. There is almost no coverage of the war in Ukraine. Most ordinary citizens have neither a pro-Russia nor pro-Ukraine view. Instead, news coverage focuses on the positives. Examples include projects or investments, cooperation deals and cultural exchanges between China and the rest of the world, from Morocco to Malaysia.

I did not feel any animosity towards me, a Caucasian man from North America. I found going through customs and travelling across China easier even than before COVID.

I also noticed much fewer foreigners. I was told that the Germans and Japanese still have an important presence, but Americans are seemingly gone. Also noticeable is the number of African businesspeople and students.

COVID and its aftermath

COVID has had a profound effect on the Chinese population. From mid-2020 to mid-2022, the country was isolated. There were almost no cases and life continued almost normally while much of the rest of the world was under some restrictions. Then the world reopened and China implemented the harshness measures of confinement and quarantine. In Shanghai, people were restricted from leaving their apartments for over two months. Hospital doctors and nurses stayed at work knowing that if they left, they could not return. People have been traumatized. More on this later.

After reopening last Fall, life today is largely back to normal. Except for an antigen test required for arrivers to China, there are almost no COVID measures. Maybe 10% of people wear masks, but they are not compulsory anywhere, even in hospitals. For foreigners, the country accepts valid visas that were issued before COVID and has resumed issuing new 10-year travel visas.

Most Chinese people have caught COVID, often more than once. 

The strength of the economy

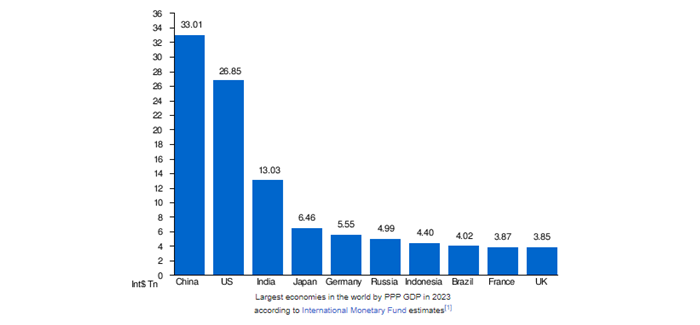
China’s economy is the world’s largest by GDP based on purchasing power and second by nominal GDP. In August 2021, President Xi Jinping first introduced the concept of common prosperity. The goal is to reduce inequalities and make regional development more balanced and people centered.

Chart 1: chart showing largest economies in the world by PPP GOP in 2023, according to International Monetary Fund estimates.

Barring a more significant decoupling from the US and some European economies, the Chinese economy is on a path to expand modestly over the next few years – the government’s goal is 4% to 5%. Is it achievable? Even if growth did not reach these levels, we believe the country still presents many opportunities. Let’s review important sectors of its economy.

The real estate sector

Foreign investors have called the Chinese real estate market a bubble for at least 20 years. It probably was to a certain extent, but it had solid underpinnings including China’s rapid urbanization. For example, Chengdu more than doubled its population between 2000 and 2020.

A foreigner visiting China for the first time might think that construction is booming. For myself, a regular traveller to China since 2000, construction has never seemed so slow. The number of new projects is the lowest I have ever seen. The number of stalled projects in every city is noticeable.

What does that mean? A recession in China and a collapse that resembles the Great Financial Crisis of 2008?

Given the importance of the real estate sector in China, a slowdown will have a large impact on its economy. But also on many commodity-producing countries. 

A full-blown financial crisis? I do not think so! Why? 

In China, more than 90% of households own their home, probably the largest percentage in the world.  Housing is 59% of household total assets. However, just 18% of households have a mortgage. That compares with more than 50% in the US and Canada. Most mortgages are variable rate and rates have declined recently. A decline in property prices would not bankrupt people but a negative wealth effect would be felt.

The same can’t be said for property developers. We have already seen the world’s largest, China Evergrande Group, default on some of its debt obligations and struggle to restructure its more than US$300 billion debt load.

Who will lose? Bond holders, including US-based. Now, the default rate of US-dollar real estate bonds in China has risen to over 50% for a loss of over US$40 billion so far.

The big Chinese banks, all government controlled, will absorb much of the losses. It may explain why the world’s largest bank, Industrial and Commercial Bank of China (ICBC), a bank twice the size of JP Morgan Chase and four times the size of Royal Bank of Canada by assets is trading at 4.8x earnings (P/E) and pays a dividend of 6.24%. So, we see the risk of a full-blown financial crisis as small to moderate.

Why do we think real estate will probably never recover to its prior levels? Demographics is a main reason. China’s working population stopped growing about 10 years ago. Its actual population declined for the first time in 2022. However, its urbanization rate is still a positive driver. Now at 65%, it is expected to reach 80% by 2035, which means an additional 200 million people moving to urban areas in the next 10 to 15 years. 

I have found the psychology around owning a house very different from my previous trips to China. Following the quote by Xi Jinping that houses are for living and not speculating, Chinese people are not so certain anymore that house prices can only rise. With the establishment of the property register and the expected real estate tax system being implemented soon, it will no longer cost anything to carry an empty house. Ownership of multiple empty apartments, which by some estimates exceeds 100 million, indicates there are more sellers than buyers. There are more ways for Chinese people to accumulate wealth, including an expanded stock market and other options for international investing. Finally, I have observed that the younger generation seems less interested in home buying, probably expecting to inherit one of many from their families as most are only children with two parents and four grandparents who are likely homeowners.

Reasons for China’s youth unemployment problem? 

Not unlike many countries, there is a mismatch between the needs of the job market and the expectations of graduates. Joblessness among young people aged 16 to 24 rose to a record 20.4% in April, far above the pre-pandemic rate high of 13% through much of 2019.

The rise was more surprising given that China’s urban unemployment overall fell to 5.2% as of April, compared with 6.1% a year earlier. The government is trying to encourage state-owned enterprises to hire new graduates. It is also running a campaign to promote job opportunities in more manual and technical professions. 

Talent Boom - number of new university graduates in China. Note: 2022 and 2023 figures are estimates.
Sources: China’s National Bureau of Statistics, China’s Ministry of Education.

Will the “lying flat” generation rise? It certainly represents a huge pool of talent and given the relatively young retirement age (55 for women, 60 for men) and the lower birth rate, we believe this issue should get resolved relatively soon.

Where will growth come from?

So, what sectors may take the baton and contribute to future growth?

Like most mature economies, China is experiencing an enormous need for services sectors, from hospitality and tourism to healthcare.

One sector that continues to grow and benefits from investments is infrastructure.

The infrastructure sector

In its latest five-year plan, China aims to expand its expressways to 130,000 kms by 2027, up 11% from the end of 2021. This will add to what is already the biggest such network in the world. By comparison, the US had about 98,000 kms of expressways as of 2020 based on data from the Federal Highway Administration.

China’s high-speed rail network, run by state-owned China State Railway Group, spanned 42,000 kms at the end of 2022 – the longest in the world, and 13 times the size of Japan’s shinkansen bullet train network. The five-year plan will expand it by another 26% to 53,000 km in 2027. And North America still has zero kilometres.

More airports will be built, bringing the total to around 280 from 254 as of 2022.

Nationwide fixed-asset investment in transportation reached a record ¥3.8 trillion (US$537 billion) in 2022 and is set to remain about the same each year for the next five-year plan.

Again, as a comparison, the bipartisan infrastructure bill passed by President Biden at the end of 2021 authorizes up to $108 billion to support transportation projects between 2022 and 2026.

Tourism – another growing sector

One sector that China counts on to stimulate its economy and create millions of jobs particularly in remote regions is tourism. China’s domestic tourism sector is the largest in the world and China was the third most visited country by foreigners in 2019. The World Travel & Tourism Council (WTCC) expects the tourism sector to create over 30 million jobs in the next decade for a total of over 107 million people employed in tourism. Travel and tourism is expected to grow at an average of 9.7% over the next 10 years, twice the expected growth of the country overall, representing 14% of the economy.

To give you a sense of numbers, during the May Day holiday period, the first holiday after three years of strict COVID controls, more than 270 million domestic trips were made by car, rail, airplane and waterways, up 163% from last year, according to the Ministry of Transport. Railway and airplane trips exceeded 2019 pre-pandemic levels by 22.1% and 4.2% respectively, according to the ministry.

We believe that the tourism sector, which was growing faster than GDP before COVID, will continue its growth trajectory in China and elsewhere. « YOLO » seems to be one of the lasting effects of COVID.

Innovation as a growth engine

Of the 8.3 million students who graduated in China in 2021, more than half earned science, technology, engineering or mathematics (STEM) degrees. That compares to about 450,000 degrees in similar disciplines in the US.

According to the World Intellectual Property Organization (WIPO), China accounted for 46.6% of all patents issued in 2021, or 1.6 million patents, up 6% from the year before. The US was second at 17.4% or 591,000, down 1% from 2020. It was followed by Japan at 8.5% and the Republic of Korea at 7%. India was far behind with 61,000 patents.

This innovation can be seen everywhere in China. In consumer electronics for example, Apple has been stuck at around 20% market share for the last few years. In Shanghai, I saw a lot more people in the Huawei store than in the Apple store across the street. 

Why are Chinese brands across industries such as consumer electronics, appliances and apparel gaining market share in China? Unlike global brands, they are often specifically made for Chinese customers, understanding their preferences.

A sector where innovation and the rise of Chinese brands is particularly visible is electric vehicles (EVs).

One of the first things I noticed when I landed at most airports or ordered Didi (the equivalent of Uber) is that most cars in China are electric. Electric cars have a green license plate whereas gasoline-powered cars have blue plates.

In 2009, China became the world’s largest car market. In 2023, it will become the second-largest car exporter, behind Japan and ahead of the US and South Korea. In 2022, 27 million vehicles were sold in China compared to 14 million in the US. In China, 7 million of the cars sold were EVs. That’s 25% of the market. In the US, 750,000 were sold, or 5.6% of the market.

Much like the US in the 1920s, there are over 100 EV car manufacturers in China. In the US, by the 60s, the big 3 dominated. We can expect the Chinese market to have four or five dominant brands in 10 years.

China top 5 EV maker sales share in 2022

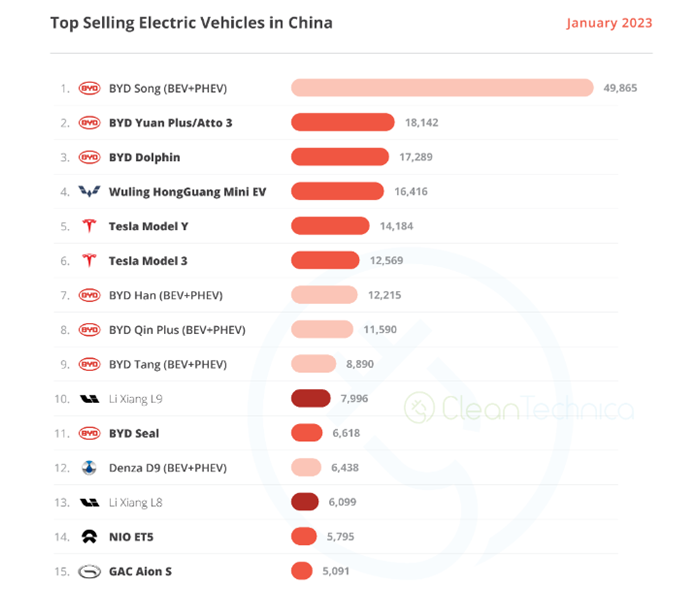
BYD (Build Your Dream), the company Warren Buffett invested in, had 29.7% market share in 2022, up from 18% in 2021. Six of the top-10 EV models sold in China in 2022 were BYD. And the company is at the top of the list when I asked people what EV car they would buy.

GM, which includes the joint venture with SAIC, had 8.9% market share. I saw many Buick electric models in China that are not available elsewhere.

Tesla is third at 8.8% market share, down from around 14% in 2021. Interestingly, when discussing cars, most people still associate luxury and aspirational brands as German, with names like Audi, Mercedes and Porsche. Tesla is not viewed as a luxury brand in China, but just another EV car brand. And with questionable quality and inferior software, a very different impression from the typical North American view. Its market share continues to drop in 2023, despite drastic price cuts.

In fourth place and growing fast is Geely, which also owns Volvo and Polestar, with 5.2% market share.

And in fifth place, Changan with 4.5%, market share and also growing.

Looking at January 2023, here are the top-15 models sold that month.

Chart showing Top selling electric vehicles in China (as of January 2023).
Source: Cleantechnica.

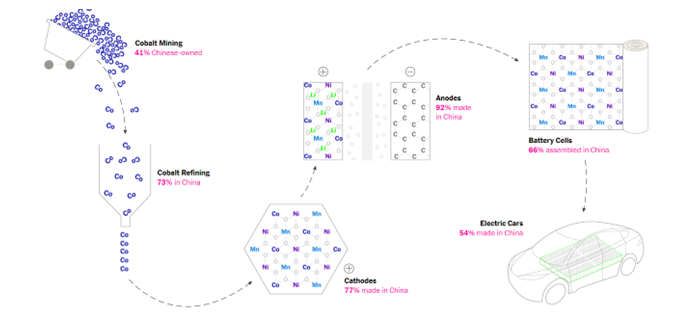
When looking at the lead Chinese EV makers, could the rest of the world catch up? The answer is probably not. Looking below at the battery supply chain explains that even with battery gigafactories built by most western automakers, the dominance of Chinese companies is structural.

Diagram showing the process of cobalt mining & refining, cathodes, adodes and battery cells for electric cars.
Source: Cleantechnica.

This note may seem optimistic and I am. I also visited China’s largest publicly listed funeral services company, Fu Shou Yuan (1448 HK). We own it in our emerging markets fund. Last year, the company assisted over 74,000 families to honour their deceased family members.

I also visited Raffles Medical Shanghai Hospital (RFMD SP), a brand new, 400-bed tertiary hospital in the heart of the fastest growing new area of Shanghai. We have owned Raffles Medical, a Singapore-based healthcare company building a network of clinics across Asia and China, in our global and EAFE fund for the last seven years and profiled it before in these weekly comments.

There are a lot of opportunities in China, despite the rhetoric that it is un-investible.

In the last few weeks, the CEOs of JP Morgan, Starbucks, Volkswagen, Tesla and many others have gone to China and reiterated the importance of globalization and cooperation, not decoupling from China.

If, however, the situation deteriorates further, our role will be to navigate these risks and identify opportunities for our clients.

If you would like to discuss more, do not hesitate to contact us at Global Alpha.

Monetary trends continue to give a negative message for global economic prospects, suggesting that European / US weakness will outweigh resilience in major EM economies. 

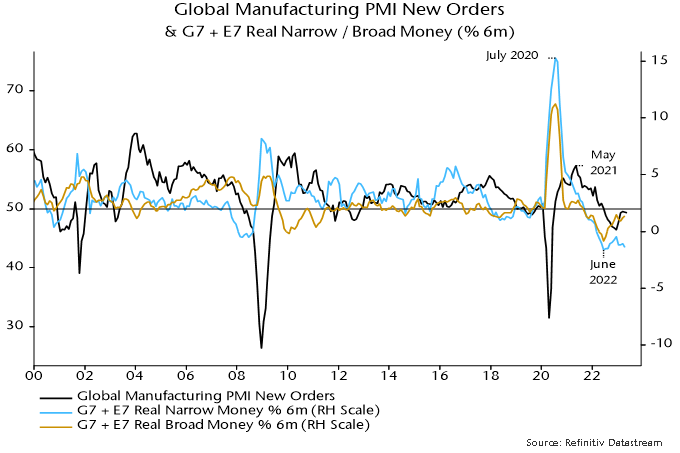
G7 plus E7 six-month real narrow money momentum fell again in April, extending a move down from a local peak in December and suggesting a decline in economic momentum through late 2023 – see chart 1. 

Chart 1

Chart 1 showing Global Manufacturing PMI New Orders & G7 + E7 Real Narrow / Broad Money (% 6m)

A revival in real narrow money momentum in H2 2022 was reflected in a recovery in global manufacturing PMI new orders between December and March. The recovery stalled in April / May and the forecast here remains for a relapse and possible retest of the December 2022 low during H2 2023. 

Narrow money has outperformed broad money as a leading indicator historically, in terms of reliability in signalling turning points in economic momentum. Narrow money usually weakens relative to broad money when interest rates rise as depositors are incentivised to shift funds to less liquid accounts. This is an important feature of the transmission mechanism and one of the reasons narrow money outperforms as a forecasting indicator. 

An argument, however, has been made that the unusual speed of the rise in interest rates over the past year, coupled with worries about deposit safety following recent bank failures and an associated switch into money market funds, may have exaggerated narrow money weakness relative to “true” economic prospects. This would suggest giving greater weight to broad money trends at present. 

As chart 1 shows, global six-month real broad money momentum recovered more strongly during H2 2002 and has stalled rather than fallen back since December. Still, the message for economic prospects is weak, suggesting no growth revival before 2024. 

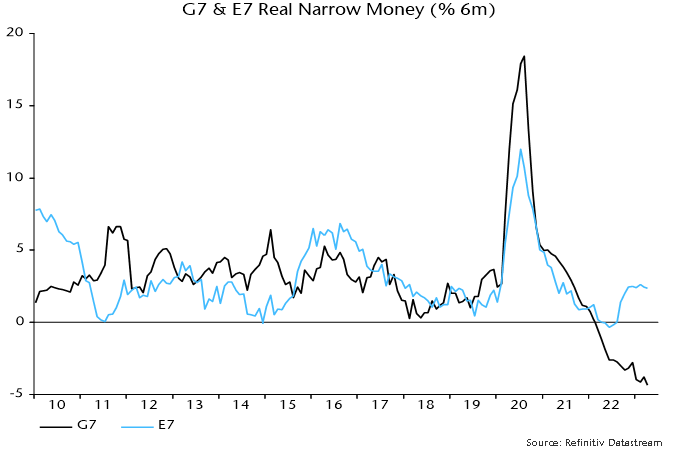
A marginal decline in global manufacturing PMI new orders in May reflected a notable weakening of the DM component offset by stronger EM results. EM resilience is consistent with recent stronger E7 real money momentum (broad as well as narrow) – chart 2. 

Chart 2

Chart 2 showing G7 + E7 Real Narrow Money (% 6m)

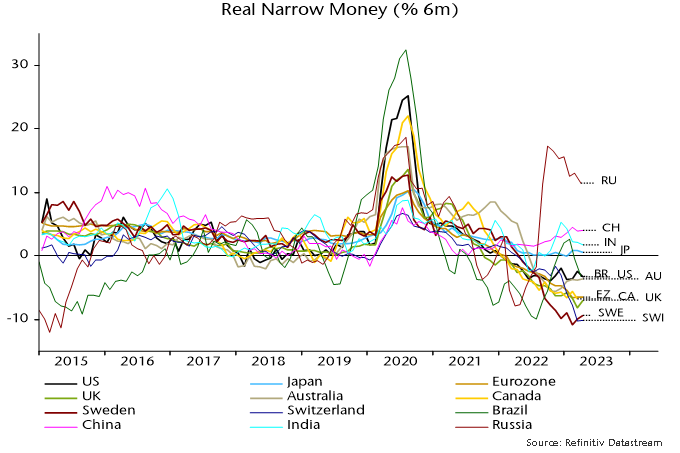
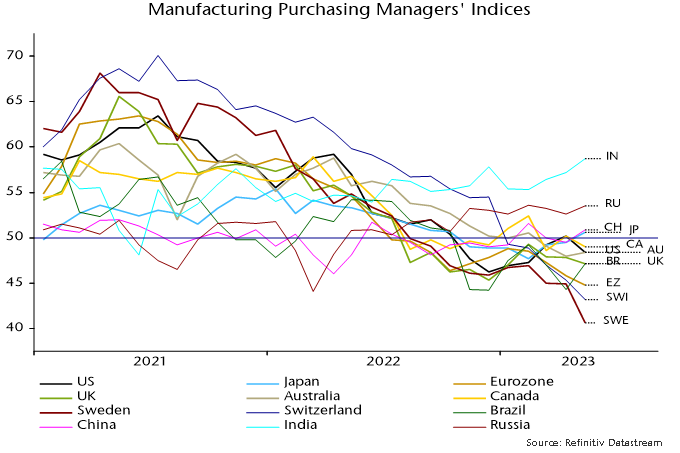
Charts 3 and 4 show six-month real narrow money momentum and manufacturing PMIs in selected major economies. Russia, China and India top the real money momentum ranking with weakness focused on Europe – particularly Switzerland and Sweden. The latest PMI results mirror the real money ranking (rank correlation coefficient = 0.85), with recessionary readings in the Eurozone, Switzerland and Sweden contrasting with Indian / Russian strength. 

Chart 3

Chart 3 showing Real Narrow Money (% 6m)

Chart 4

Chart 4 showing Manufacturing Purchasing Managers’ Indices
Nyhavn warmly illuminated beside the sailing ships moored beneath sunset skies in the heart of Copenhagen, Denmark.

Digitalization has been a driving force behind growth in many industries, creating new opportunities and increasing efficiencies. The benefits of a thriving digital society are immense, including improved productivity and cost reduction. Unsurprisingly, the global market for digital transformation is enormous and rapidly growing. In 2022, this market was valued at close to US$750 billion and is projected to experience a compound annual growth rate of 26.7% from 2023 to 2030

The IMD World Digital Competitiveness ranking evaluates the capacity and readiness of 63 countries to adopt and explore digital technologies for societal enhancement using 54 different criteria. Denmark was named the most digitally advanced country in the world by the International Institute for Management Development (IMD) last year, marking the first time a Scandinavian country surpassed the US in this ranking. The US secured a respectable second place, thanks to its large and expanding tech industry and robust digital infrastructure. Denmark’s top position can be attributed to its readiness to embrace digital transformation, business agility and IT integration. The country also excels in delivering online public services and a remarkable 94% of its citizen are connected and considered tech-savvy.

In other parts of Europe, the digital landscape is uneven, with varying levels of digital readiness, infrastructure availability and digital skills among countries. However, efforts are underway to bridge the digital divide and drive transformation across the European Union (EU).

The European Commission has long been working on the “digital single market” and, in 2020, unveiled the Recovery and Resilience Facility (RFF). This €750 billion initiative aims to address the economic and social consequences of the COVID-19 pandemic and will be distributed among member states. At least 20% of the recovery funds must be allocated to projects that digitize economies and societies. 

The initiative’s goal is to expand digital infrastructure, support digital skills and education, promote digital innovation and entrepreneurship, and enhance digital public services. The EU’s vision is to become the most connected continent globally by 2030, ensuring every household has access to high-speed internet coverage by 2025 and gigabit connectivity by 2030. The EU is also committed to supporting the expansion and improvement of 5G infrastructure across its member states. For instance, Greece’s recovery and resilience plan includes €1.3 billion allocated to the digital transformation of the public sector and €500 million for promoting digital transformation in the education and health systems.

We believe that Netcompany, a recent addition to our international portfolios, is well-positioned to benefit from Europe’s digitalization. 

Netcompany, a Scandinavian provider of next-generation IT services for public and private customers, aims to support its clients in gaining competitive advantages and enhancing efficiency through digitalization, customized application development and business process re-engineering. The company has established a highly differentiated business model that is repeatable and scalable, enabling the delivery of projects on time and within budget. In its most recent fiscal year, Netcompany reported revenues of DKK 5,545 million (US$797 million) and an EBIT of DKK 839 million (US$121 million).

Originally based in Denmark, Netcompany has expanded its operations to Norway, the Netherlands and the UK. In 2021, it further expanded into Continental Europe through the acquisition of Intrasoft, gaining access to EU institutions and government tenders. By leveraging the combined platforms, competencies and strengths of both companies, we believe Netcompany is well-equipped to capture market share in Europe’s digitalization journey. 

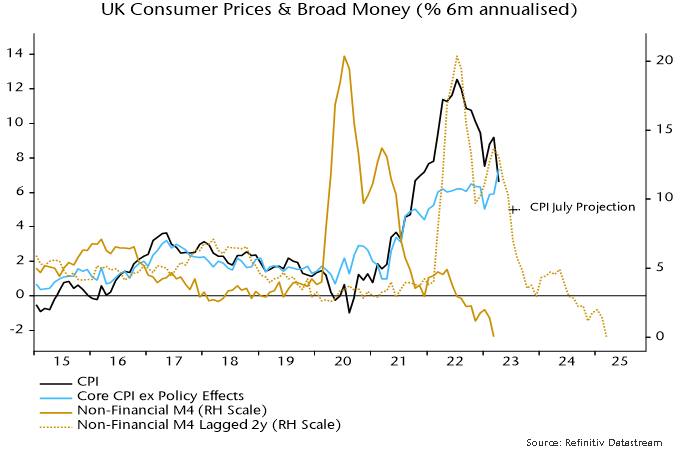
Market reaction to UK April CPI numbers focused on the overshoot of headline and core inflation relative to forecasts, ignoring a continued slowdown in headline price momentum. 

The six-month rate of increase of headline prices, seasonally adjusted here, fell to 6.6% annualised in April, the slowest since September 2021 and down from a peak 12.6% – see chart 1. 

Chart 1

Chart 1 showing UK Consumer Prices & Broad Money (% 6m annualised)

Six-month headline momentum is tracking a simplistic “monetarist” forecast that assumes a two-year lag from money to prices and the same “beta” of inflation to money growth as on the way up. 

This forecast suggests a further decline in six-month momentum to about 5% annualised in July on the way to much lower levels in late 2023. 

The projection of a fall to 5% or so in July is supported by a bottom-up analysis incorporating the announced 17% cut in the energy price cap that month. 

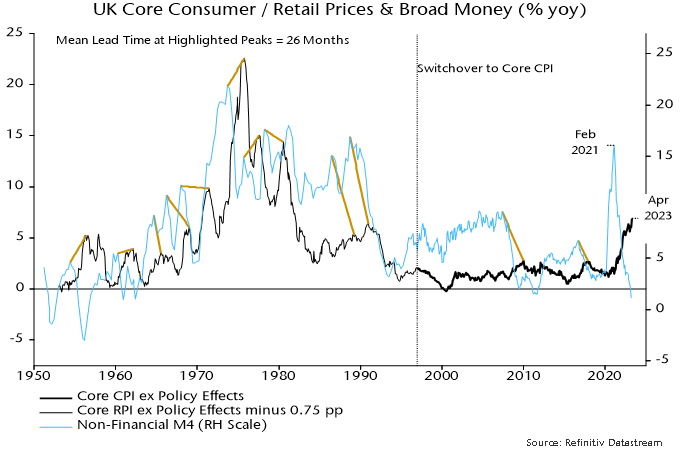
Markets were spooked by annual core inflation reaching a new high of 6.8% in April but it is normal for core to lag headline at turning points. 

The April result, moreover, is consistent with a mean historical lag of 26 months between peaks in annual broad money growth and core inflation: money growth continued to rise into February 2021 – chart 2. 

Chart 2

Chart 2 showing UK Core Consumer / Retail Prices & Broad Money (% yoy)

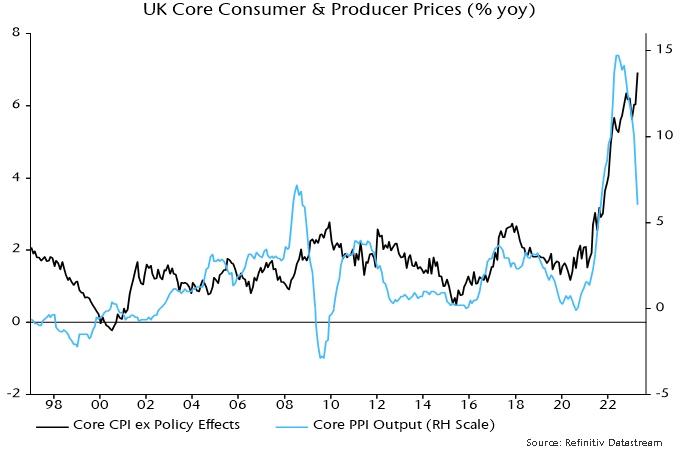
The suggestion that core inflation is at or close to a peak is supported by PPI data: core PPI output inflation usually leads and has slowed significantly from a May 2022 peak – chart 3. 

Chart 3

Chart 3 showing UK Core Consumer & Producer Prices (% yoy)

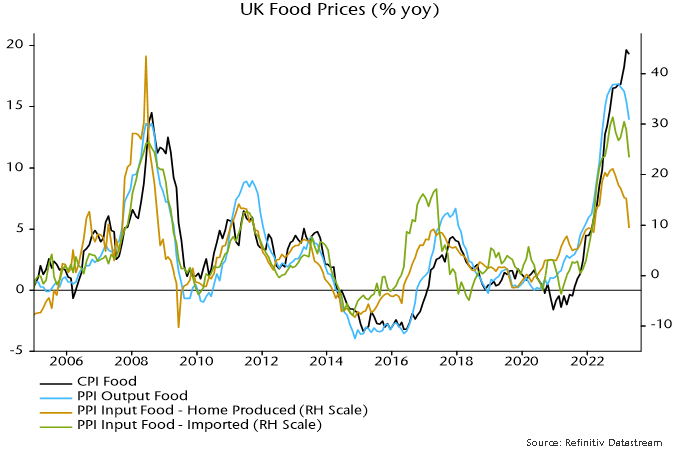
PPI data also indicate that CPI food inflation is peaking and could fall rapidly over the remainder of the year – chart 4. 

Chart 4

Chart 4 showing UK Food Prices (% yoy)