Pessimistic commentators argue that the Chinese economy has entered a “liquidity trap” and faces Japan-style deflation. This assessment is not shared here: a recent monetary slowdown can be explained by misguided policy tightening around end-2022, which is now being reversed, while broad money growth would need to fall much further to suggest a sustained decline in prices. 

A review of monetary policy in recent years is helpful in understanding current conditions. An important consideration is that – like the Fed decades ago – the PBoC does not announce changes in its policy stance, which often become apparent only after the event in movements in money market rates and credit / monetary trends. 

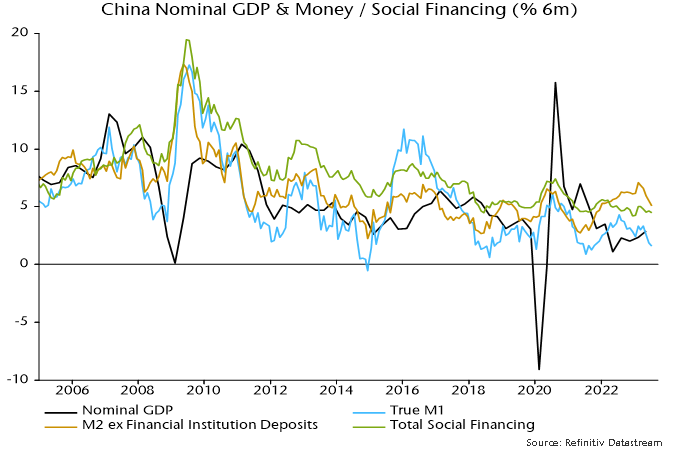
The PBoC eased policy between late 2020 and summer 2022 to cushion covid-related economic weakness. Three-month SHIBOR fell from over 3% to 1.5%, while six-month growth rates of money and credit began to pick up from mid-2021 – see charts 1 and 2. 

Chart 1

Chart 1 showing China Interest Rates

Chart 2

Chart 2 showing China Nominal GDP & Money / Social Financing (% 6m)

Narrow and broad money measures continued to accelerate in H1 2022, laying the foundations for a solid post-reopening economic recovery in H1 2023 – real GDP grew by 6.1% annualised between Q4 2022 and Q2 2023. 

The PBoC, however, blotted its copy book in late 2022, tightening policy on misplaced concern about a reopening-driven inflation pick-up, although narrow money and credit growth were by then cooling and the ratio of broad money to nominal GDP was close to trend (in contrast to the US / Europe, where a large monetary overhang fuelled strong price pressures). 

Three-month SHIBOR rebounded from 1.7% in September to 2.4% by year-end, rising further to 2.5% in March. The consensus view at the time – not shared here – was that the rise in money rates reflected stronger money demand due to reopening, i.e. the increase was “endogenous” rather than policy-driven and would not threaten economic prospects. 

Policy tightening has resulted in six-month narrow and broad money growth falling to late 2021 levels, although credit expansion has declined by less (despite a very weak July flow number) – chart 2. The monetary slowdown suggests a loss of economic momentum through late 2023.

The PBoC has, at least, been swift to recognise its error, resuming easing in early Q2. Three-month SHIBOR has retraced half of its August-March rise but may need to return to the low to offset recent monetary damage. 

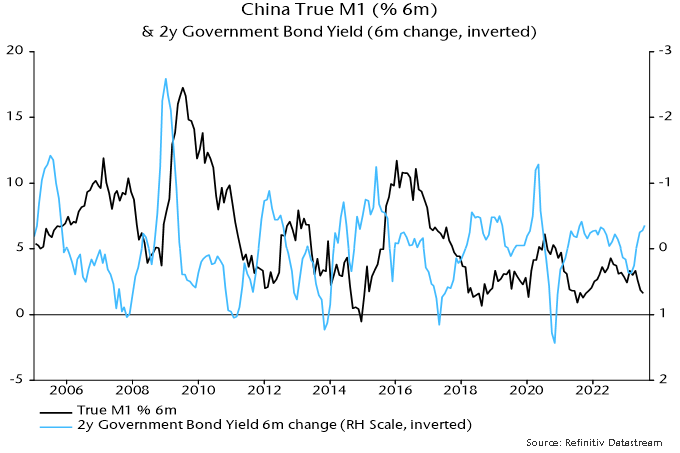
Chart 3 illustrates the inverse leading relationship between changes in interest rates (in this case the two-year government yield) and narrow money momentum. The reversal in rates suggests a bottoming out and revival in money momentum, although timing is uncertain. 

Chart 3

Chart 3 showing China True M1 (% 6m) & 2y Government Bond Yield (6m change, inverted)

Why did Japan enter a sustained deflation in the early 1990 and are there parallels with current Chinese conditions? 

From a monetary perspective, a deflationary environment requires (broad) money growth to fall below the sum of trend real GDP growth and the trend rise in the money / nominal GDP ratio. 

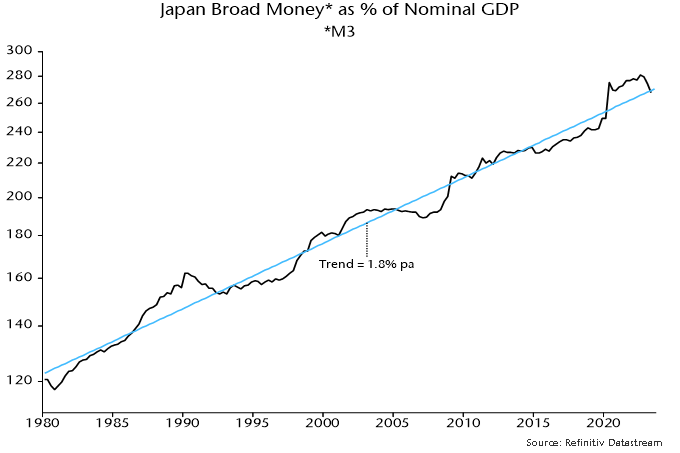
The ratio of Japanese broad money M3 to nominal GDP has risen by 1.8% pa on average over the long run – chart 4. Trend real GDP growth was running at about 2% in the early 1990s, so broad money needed to expand by about 4% pa to maintain stable prices. Annual growth fell below this level in 1991 on the way to zero in 1992, averaging 2.7% over 1991-2000. 

Chart 4

Chart 4 showing Japan Broad Money* as % of Nominal GDP *M3

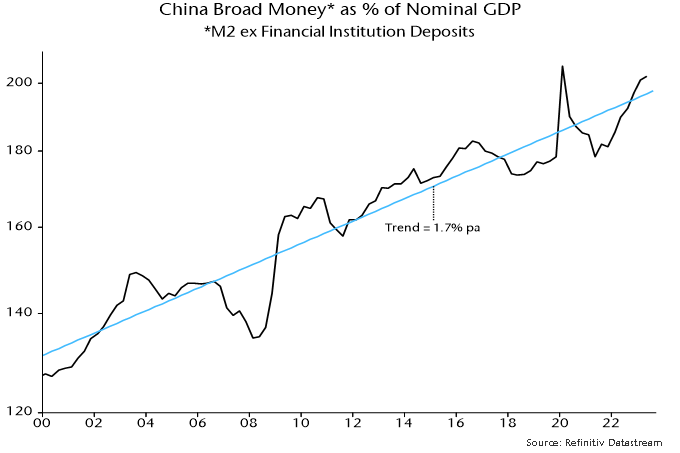
China’s broad money to nominal GDP ratio has risen at a similar trend rate of 1.7% pa – chart 5. If trend real GDP growth is assumed to be about 5%, broad money expansion needs to stay above about 7% to avoid a deflationary scenario. Annual growth is currently 11.6%, with the six-month rate of increase at 10.4% pa. 

Chart 5

Chart 5 showing China Broad Money* as % of Nominal GDP *M2 ex Financial Institution Deposits
Lake surrounded by mountains.

In June this year, 3M was ordered to pay $10.3 billion for its contamination of US drinking water supplies with per- and polyfluoroalkyl substances (PFAS), also known as forever chemicals. In the US alone, there are currently over 15,000 open claims against PFAS manufacturers and users, with some experts estimating that payouts could exceed the $200 billion payout levels of tobacco companies in the 1990s.  

PFAS were invented in the 1930s and started to be widely adopted in the 1940s. These chemicals have been used in many industries for various applications since. In response to growing concerns about their side effects in humans, such as liver damage, obesity, fertility issues and cancer, many authorities around the world are considering strict regulations to limit their use.  

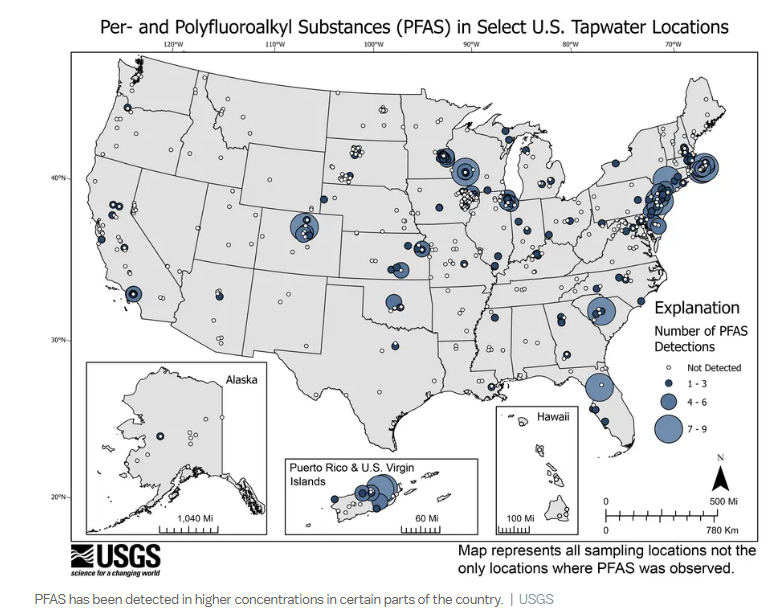
Per- and polyfluoroalkyl substances are synthetic, manufactured chemicals that are mostly used in products for their nonstick and repelling properties. They have a special type of bond called carbon-fluorine, one of the strongest bonds in chemistry. This explains why PFAS do not degrade easily in the environment and human body and instead tend to accumulate. Within usage and production, they migrate into soil, water and air. Long-term PFAS use has resulted in at least 45% of US drinking water supplies containing traces of these forever chemicals.  

Illustration/map showing Per- and Polyfluoroalkyl Substances (PFAS) in Select U.S. Tapwater Locations

The widespread contamination of US drinking water led the Environmental Protection Agency (EPA) to propose new limits of four parts per million, a drastic reduction compared to the limits set back in 2016 of 70 parts per million.  

For visualization purposes, four parts per million would be equivalent to a grain of sand in a football field! 

Though these limits have not yet been approved, many municipalities around the US have started testing their drinking water supplies. If the limits do become the standard, all municipalities will need to begin regularly testing their water supplies within three years from the adoption of the law.  

The clean up of PFAS is an expensive overhang for water utilities, especially because of the age of the infrastructure. Some US water treatment facilities are over 100 years old. The American Water Works Association, an international nonprofit founded in 1881 and dedicated to providing total water solutions assuring effective water management, estimates that PFAS clean up will cost between $2.5 and $3.2 billion annually for the next decade. 

Many companies currently have treatment technologies to facilitate the cleaning up of chemicals in water supplies. The three most widely adopted ones are activated carbon, ion exchange treatment and high-pressure membranes.  

Activated carbon is a porous element derived from organic materials that have high carbon content, such as wood, lignite and coal. It can trap various compounds including certain types of PFAS. The activated carbon is used as a filter through which water flows and the chemicals are captured. The activated carbon within the filters needs to be replaced every 6 to12 months depending on the frequency of use, volumes of water filtered and PFAS concentration.  

Ion exchange treatment involves resins. These resins are made of porous materials with positively charged ions. The negatively charged ions of the PFAS are attracted to the positively charged ions acting as magnets. This resin is then discarded typically through incineration, thus ensuring no further contamination occurs. 

High-pressure membranes such as nanofiltration use nanometer-sized holes or pores to trap particles. This technique is highly effective but also requires that the membranes be changed every few years.  

One of our companies, Kurita Water (6370 JP), is a leading water treatment company that manufactures and sells speciality equipment. The company operates throughout the world, but is focusing growth plans in the US market. Since 2015, the company has been acquiring in the US, EU, Korea, Canada and the Middle East to increase its global footprint.  

Due to the increasing regulations among public water supplies authorities and emerging concerns about contaminants, many clients are turning to Kurita for its expertise and speciality treatment facilities to address these concerns and adhere to regulations. 

Kurita is able to provide a large breadth of solutions to its clients. It offers both on-site and remote planning and support as most water systems are customized to customer specifications. For PFAS treatment, Kurita provides all three technologies mentioned.  

As PFAS regulations become more stringent, Kurita is poised to benefit from the vast adoption of advanced water treatment facilities. 

Evening view of illuminated Udaipur Palace in India with lights reflected in the water.

Summary

  • Emerging markets were stronger through July, led by a bounce in Chinese equities on announcements from a Politburo meeting that authorities would step up support for the economy.
  • Materials, energy and consumer discretionary sectors performed well on talks of a global economic soft landing and China stimulus.
  • We are not tempted to chase the rally in more cyclical parts of the market. The global monetary backdrop suggests risk of a head fake for investors expecting a soft or no landing, our view being that global PMIs are likely to roll into the end of 2023.
  • Brazil is the first major emerging market to initiate rate cuts, with the Central Bank surprising markets with a 50 bps cut to the Selic policy rate, which now stands at 13.25%.
  • While positive and signalling the capacity for many major emerging markets to ease policy as DM central banks pause, Brazil is vulnerable to weak commodities prices as the global economy slows. Narrow money numbers in Brazil are also very weak and indicating risk of a sharp domestic slowdown, while the currency looks vulnerable to a pullback from elevated levels.

Despite the bounce, bearish sentiment for Chinese equities prevails, with headlines dominated by foreign investor revulsion over the perceived fragility of the economic recovery and geopolitical overhang. This has been a tough market for our fund, with many of the high-quality names we hold underperforming as foreigners exit, and while domestic mutual fund investors favour SOEs on hopes that a government-backed reform drive will act as a catalyst for more dynamic management of what have historically been highly inefficient businesses. The low-hanging fruit for the SOEs will be cost cutting, with bloated headcounts being the obvious target. However, we question whether the political appetite for this exists in Beijing given high levels of national unemployment (with youth unemployment of at least 20%). 

We have been writing for nearly a year on China’s monetary backdrop, which while not inspiring in absolute terms, looks much better than many other parts of the world, especially relative to major developed markets. While EM and global investors have been disappointed by the absence of a reopening boom in consumption akin to what we saw in the West, economic recovery is indeed underway.

However, recent data covering consumption, property prices and industrial production tells us that this recovery is fragile and risks rolling without further support. Following a meeting of the Politburo in late July, the authorities have signalled that concrete support is on its way. Better late than never.

Just as central banks and governments in the West were slow to turn off the monetary and fiscal taps as vaccines were rolled out and lockdowns ended, Chinese authorities have been too reactive in managing the recovery. Rather than relying on forward-looking indicators to guide proactive policy, the CCP prizes hard but backward-looking data. This is compounded by the deterioration of China’s institutional quality, as Xi’s consolidation of power has squeezed out dissenting voices in government, the wider party, economic and political think tanks, and in the private sector. This makes for slow and reactive decision-making, and many investors are not keen to wait around, adopting what we refer to as an “anything but China” footing, or ABC for short.

The risk to ABC is an unexpected policy reversal by China’s authorities that wrong-foots the market. They have form, such as the backflip on the regulation of China’s gaming sector – from “spiritual opium” in 2021 to an indispensable pillar of China’s development in 2022 – as fuel for the development of strategic technologies such as AI. Xi throwing in the towel on zero-COVID following protests set off by the tragic fire in a locked-down apartment block in Urumqi, Xinjiang, surprised investors and was the catalyst for a huge rally from October 2022 through to the end of the year.

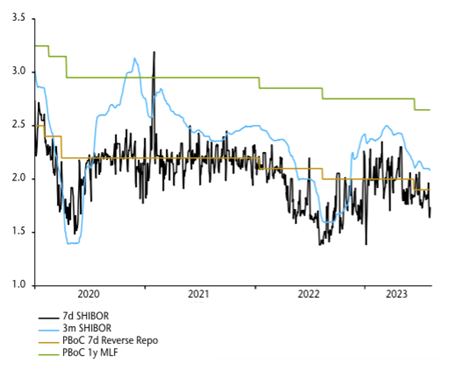
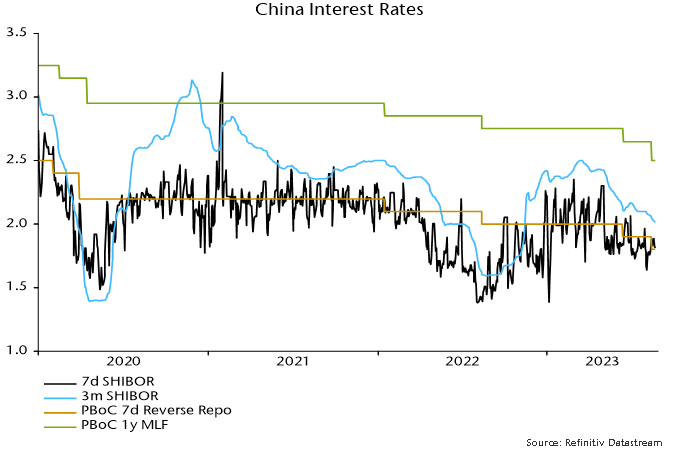
While many investors and commentators will wait for something decisive from authorities before any pivot, there are signals that they are already taking action. Monetary policy changes in China aren’t announced (similar to the Fed decades ago). The first sign of loosening is often an easing of money market rates as the PBoC adds liquidity via open market operations. The PBoC’s reverse repo rate is supposed to act as a floor for rates, so if the PBoC allows the 7-day SHIBOR rate to trade below the reverse repo rate for any period, there is a good chance the latter will be cut. We can see this in the chart below from NS strategist and economist, Simon Ward.

7-day SHIBOR has been trading soft MTD
China interest rates

Chart showing China's interest rate movements, 2019 to 2023

Source: Refinitiv Datastream

This suggests improving liquidity and another rate cut. We have written previously on our reservations about China’s development path and deteriorating institutional quality in particular. While this is a structural negative that hurts the longer-term picture for China, there is a potential cyclical opportunity for investors as meaningful monetary stimulus would drive a revival of animal spirits.

India’s HDFC merger makes combined entity one of the largest banks in the world

The merger of Housing Development Finance Corporation and HDFC Bank (both long-term portfolio holdings) in July was the largest in Indian corporate history. The combined loan book will stand at around 22 trillion rupees ($275.8 billion) and will make it one of the largest banks in the world by market cap – behind only JP Morgan Chase, ICBC and Bank of America. According to management, the merger synergies will outweigh the costs due to lower costs of funding, and the expansion of the mortgage business footprint by offering HDFC products across all 6,500 branches of HDFC Bank (from current presence in 2,500 branches).

A combined and more efficient entity will tap into HDFC’s status as India’s oldest and largest mortgage company, and market leader by virtue of wide distribution reach, robust asset liability management and tight control of operating costs. This leaves it well-positioned to harness multiple structural tailwinds that are set to drive growth in India’s housing market, which include:

  • The rise of a massive and increasingly urbanised middle class (32% of the Indian population reside in cities, estimated to be 40% by 2030), which will act as a major structural source of demand.
  • Around 66% of the population is below 35 years of age, with the average age of a home buyer being 38.
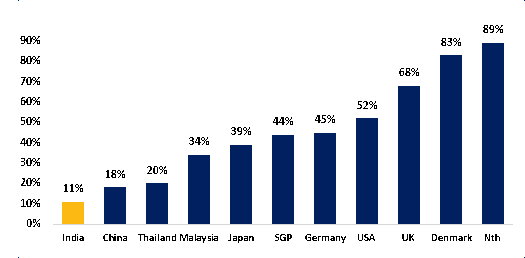
  • Low mortgage penetration, with India’s mortgages as a percentage of nominal GDP at only 11% versus over 20% for broader Asia.
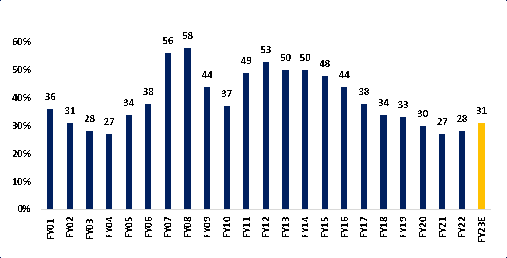
  • Housing affordability over the past decade has improved as incomes rise while housing prices have been stagnant.

Mortgages as a % of nominal GDP

Chart showing India’s mortgages as a percentage of nominal GDP at only 11% versus over 20% for broader Asia.

Source: HDFC investor presentation 4Q 2022

Affordability ratio (home loan payment/income ratio)

Chart showing improving housing affordability in India over the past decade.

Source: Jefferies Indian housing sector research 2022

Unsurprisingly, valuations are rich for such a robust growth profile and high quality management, but have softened recently as the merger played out. The merger is likely to be accretive and allow foreigners to hold an additional 10% in the combined entity, allowing investors to increase exposure to one of EM’s strongest structural stories in the rise of the Indian middle class.

A recovery in global economic momentum into the spring has gone into reverse, with monetary trends suggesting that weakness will intensify during H2. 

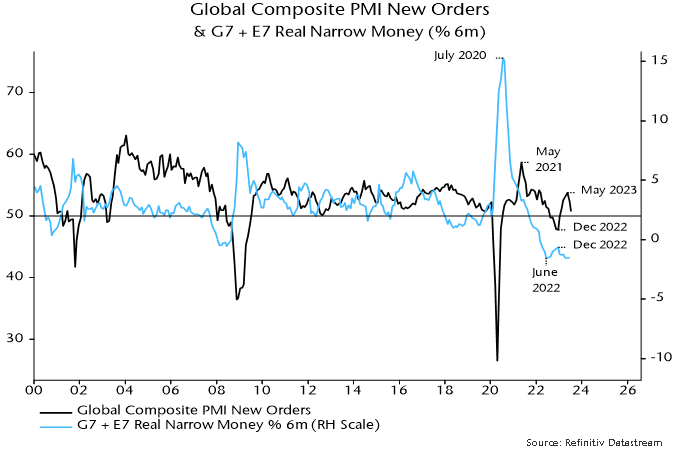
The global composite PMI new orders index fell sharply again in July and has now retraced half of its December-May rise – see chart 1. The relapse was foreshadowed by a decline in global six-month real narrow money momentum from a local peak in December 2022. Real money momentum retested its June 2022 low in April and has since moved sideways, suggesting a further slide in the PMI index into early Q4 followed by stabilisation.

Chart 1

Chart 1 showing Global Composite PMI New Orders & G7 + E7 Real Narrow Money (% 6m)

The December-May recovery in global PMI new orders was boosted by several non-monetary factors, including release of pent-up demand for services, China’s reopening and gas price relief in Europe. With similar tailwinds unlikely during H2, the orders index may retest or break the December 2022 low. 

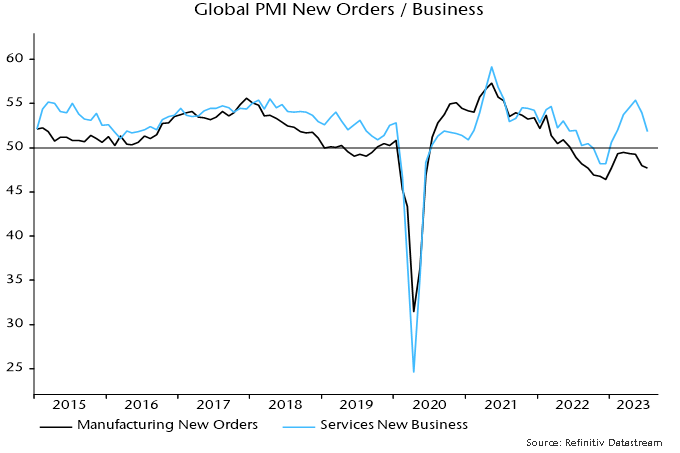
The July orders decline was paced by a slowdown in services new business, although manufacturing demand also weakened further – chart 2. The services-manufacturing gap remains wide and is expected to close via the former moving into contraction, with manufacturing possibly stabilising as the stockbuilding cycle bottoms. 

Chart 2

Chart 2 showing Global PMI New Orders / Business

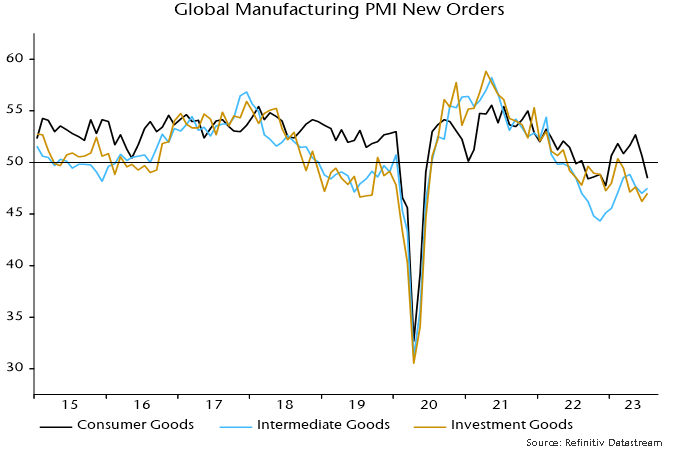
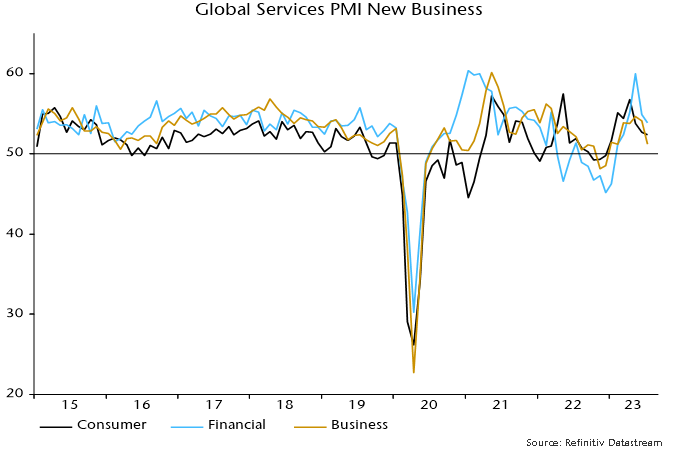
The July PMI orders decline was broadly based across sectors. Within manufacturing, consumer goods joined investment and intermediate goods in contraction – chart 3. Services demand slowed across consumer, financial and business segments – chart 4. 

Chart 3

Chart 3 showing Global Manufacturing PMI New Orders

Chart 4

Chart 4 showing Global Services PMI New Business

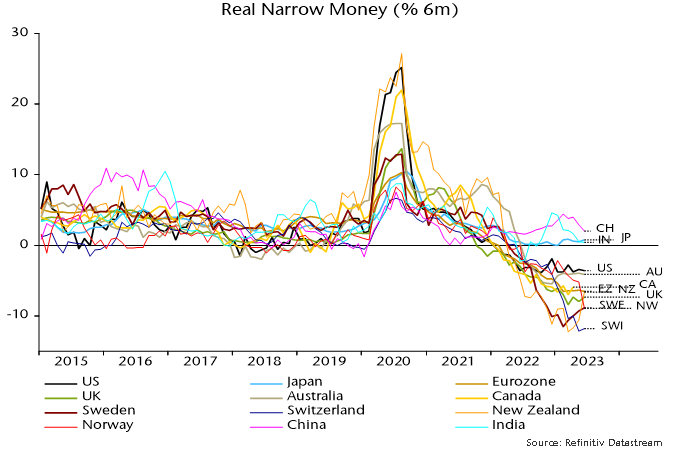
Six-month real narrow money momentum remains weakest in Europe and has slowed in China and India – chart 5. With policy tightening still feeding through, and recent oil price strength acting to slow a decline in six-month CPI momentum, global real money momentum may fail to recover during Q3. 

Chart 5

Chart 5 showing Real Narrow Money (% 6m)

Eurozone CPI numbers for July were deemed disappointing because annual core inflation – excluding energy, food, alcohol and tobacco – stalled at 5.5%. 

Or did it? The annual rise in the ECB’s seasonally adjusted core series slowed to 5.3%, below the consensus forecast of 5.4% for the Eurostat unadjusted measure. The two gauges rarely diverge to this extent (they both recorded 5.5% inflation in June). 

The six-month rate of increase of the ECB series eased to 4.7% annualised in July, the slowest since June 2022 and down from a December peak of 6.2%. Six-month headline momentum was lower at 3.4%. 

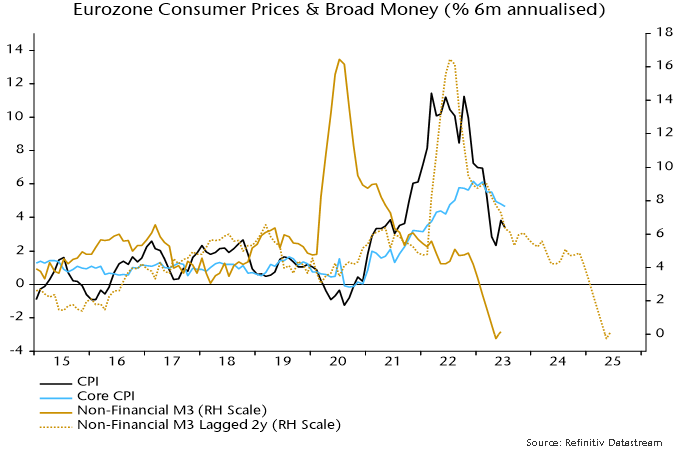
As in the UK, six-month headline inflation is tracking a simplistic “monetarist” forecast based on the profile of broad money momentum two years earlier – see chart 1. This relationship suggests that six-month CPI momentum will be back at about 2% in spring 2024, with the annual rate following during H2. 

Chart 1

Chart 1 showing Eurozone Consumer Prices & Broad Money (% 6m annualised)

The projected return to 2% next spring is a reflection of a fall in six-month broad money momentum below 5% annualised in spring 2022. A subsequent decline in money momentum to zero suggests an inflation undershoot or even falling prices in 2025. 

The shocking implication is that monetary trends were already consistent with a return of inflation to target before the ECB started hiking rates in July 2022. The 425 bp rise since then represents grotesque overkill, confirmed by recent monetary stagnation / contraction. 

The corollary is that a huge and embarrassing policy reversal is likely to be necessary over the next 12-24 months, unless some other factor causes broad money momentum to recover to a target-consistent pace. 

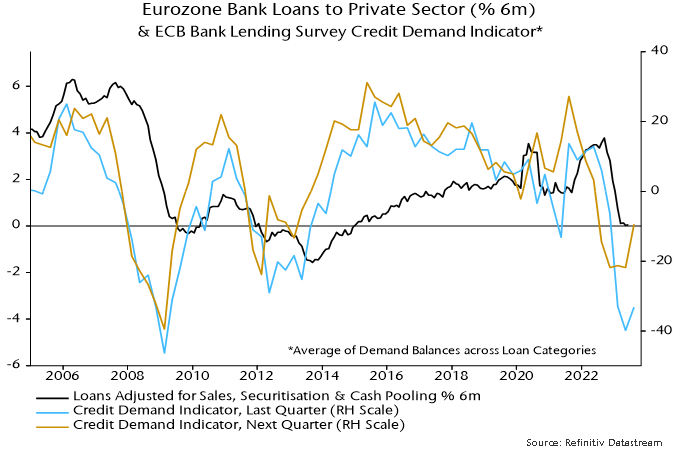
That seems a remote possibility, based on consideration of the “credit counterparts”. Loan demand balances in the latest ECB bank lending survey were less negative but still suggestive of negligible private credit expansion – chart 2. 

Chart 2

Chart 2 showing Eurozone Bank Loans to Private Sector (% 6m) & ECB Bank Lending Survey Credit Demand Indicator* *Average of Demand Balances across Loan Categories

Credit to government may contract given QT, withdrawal of TLTRO funding and inverted yield curves. (Banks previously used cheap TLTRO finance to buy higher-yielding government securities.) Redemptions of public sector debt held under the ECB’s Asset Purchase Programme amount to €262 billion over the next 12 months, equivalent to 1.6% of M3. 

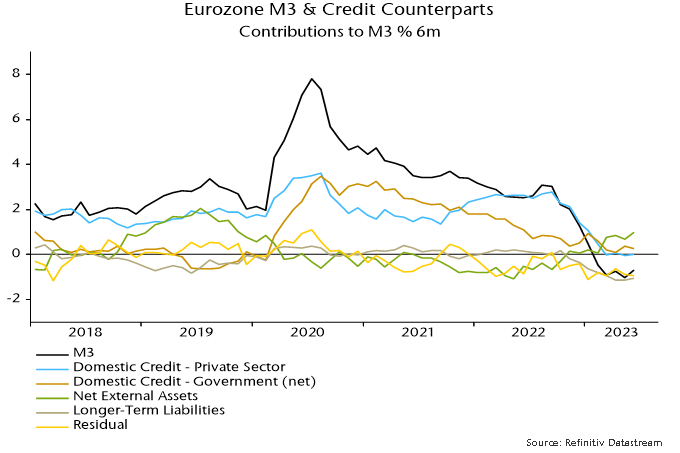
Broad money momentum has been supported recently by an increase in banks’ net external assets, reflecting a strengthening basic balance of payments (current account plus non-bank capital flows) – chart 3. This could accelerate as a Eurozone recession swells the current account surplus but is unlikely to outweigh domestic credit weakness. 

Chart 3

Chart 3 showing Eurozone M3 & Credit Counterparts Contributions to M3 % 6m
Oil pumpjacks in silhouette at sunset.

Much of the initial spike in inflation that the Federal Reserve (the Fed) is now working so hard to curb came from strong energy prices. After WTI crude crossed $120 a barrel, energy prices are back in the $70 range. Today’s bear case for oil is widely discussed – from an impending recession to China’s tepid economic rebound and the eventual transition to EV vehicles. These are sensible arguments, but the oil and gas industry has undergone some structural changes. The seeds of these changes can be traced back to the last big run up in oil prices in 2008 when oil peaked at close to $140 a barrel.

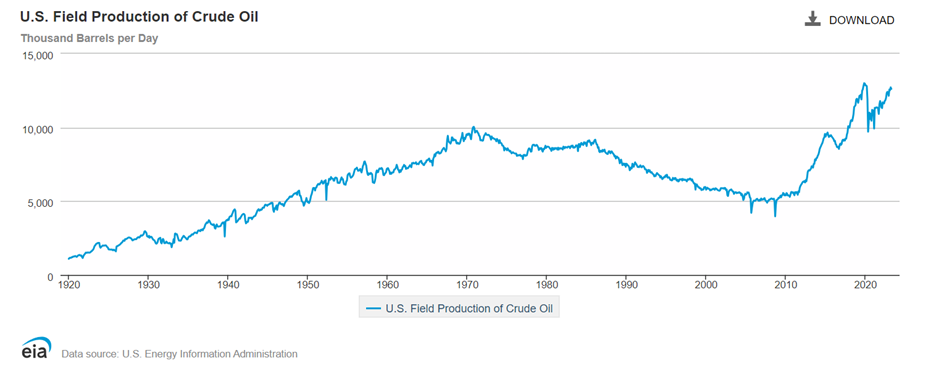
After the demand-driven boom that peaked in 2008, encouraged by the recent high prices oil, drillers in the US began exploring ways to reach previously untouchable deposits using fracking and horizontal drilling. While fracking and horizontal drilling had been around since 1998, the spike in oil prices incentivized US producers to leverage this technology. The result was a shale boom with US production that had been in terminal decline since the 1960s, doubling from about five million barrels per day in 2008 to 10 million per day over the next 10 years.

Line graph illustrating growth in US field production of crude oil, 1920 to today.

With OPEC unwilling to cede market share to a new generation of American drillers, elevated rates of supply eventually led to a fall in prices in 2014-15. In retrospect, this marked the beginning of the end of the US shale boom. Then came the one-two punch of slowing demand from China (the largest driver of incremental demand for oil) and COVID-related lockdowns that caused oil prices to hit lows of $20 per barrel in 2020 after a brief reprieve in 2018-19.

The two price shocks that occurred over a short period led to two changes in behaviour that we think has structurally changed the industry.

  • First, a new base of conservative investors replaced the more growth-oriented cohort from the shale boom. The new investor base now pushed for an end to risky new projects, instead focusing on debt reduction and returning excess cash in the form of buybacks and dividends.
  • Second, taking a cue from their investor base, management of companies that survived this boom-bust cycle vowed to be conservative with their capital expenditure programs and promised to divert their future capex to more renewable projects.

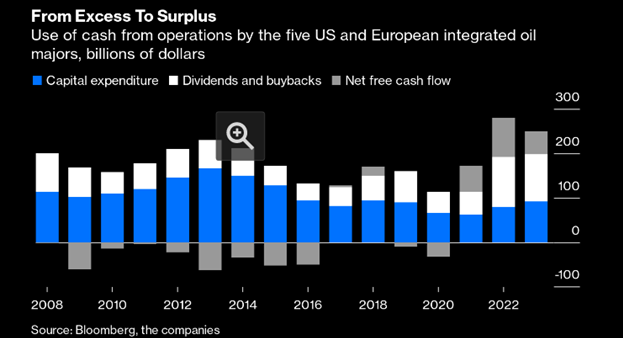
In the past, for every dollar of dividends and buybacks, oil companies would reinvest $3 to $4 back in the business. Now as we can see in the following chart, every $1 of reinvestment is matched by $1 of buybacks and dividends.

Bar graph illustrating decline in level of share buybacks by oil companies since 2008.

The result of this structural change in the market is that big oil producers will continue to be conservative with projects that take a decade or more to earn returns on investment. We are now in a situation where supply is tight due to both long-term factors, such as limited new exploration projects, and short-term factors like replenishment of the Strategic Petroleum Reserve (SPR) by the US, increasing from current levels of 350 million barrels to 650 million barrels. Adding to this, OPEC has committed to restricting supply until the end of 2023 by cutting 1.16 million barrels per day.

On the demand side, we are seeing record demand in 2023 at 101.9 million barrels per day, an increase of two million barrels from last year. While we anticipate an eventual transition away from oil, the combination of tight supply and persistent rising demand could lead to a messy transition with price spikes near-term volatility.

We think this new normal allows small and nimble players to quickly respond to a stronger pricing environment with ramped up spending. A good example of such a player is Parex Resources (PXT CN), which is part of our emerging markets portfolio.

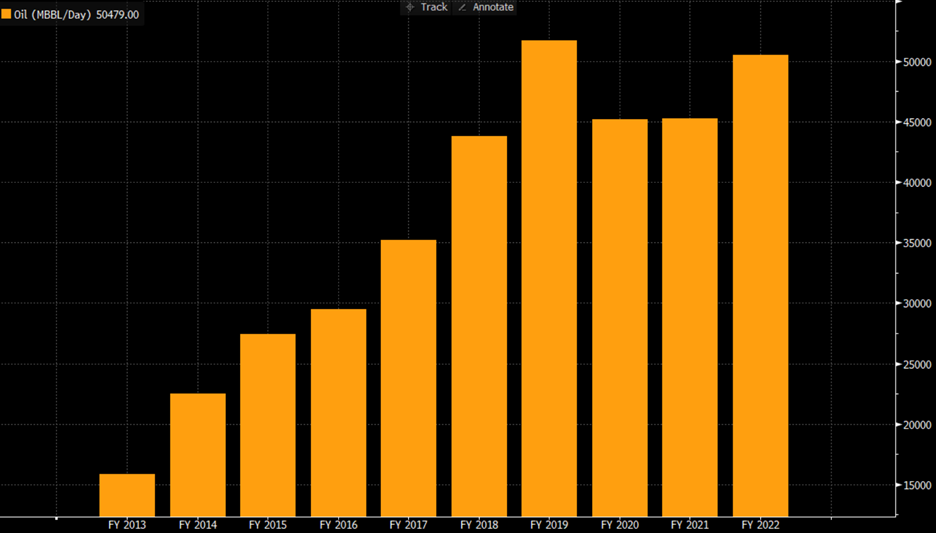
Parex is the largest independent oil and gas exploration company in Colombia sitting on over 200 million barrels of reserves and exploration opportunities. In 2023, it added 18 new blocks and expanded its exploration land by four million acres over the last five years. Currently, it produces 60,000 barrels of oil equivalent (BOE) per day and its production has grown at an 8% CAGR over the last five years, as seen in the following chart. Absolute proved developed producing (PDP) reserves have registered a 10% CAGR over the same period.

Consistent growth in oil production (barrels per day)

Bar graph illustrating growth in CAGR of Parex Resources, 2013 to 2022.

If we were to sum up our thesis on Parex, it would be capital efficiency with best-in-class execution. All of this in a country that has faced its fair share of curveballs with natural disasters, political uncertainty and infrastructure bottlenecks. To elaborate further:

  • We like Parex’s transition from a single-asset operator to a countrywide operation, with new asset acquisitions and an MOU with state giant EcoPetrol.
  • This had led to product diversity, moving from heavy oil to adding light oil, gas and condensates.
  • Parex has a track record of using of proven exploration technologies from the West to tap into easy-to-produce reservoirs with low risk.
  • We appreciate the management team’s commitment to adding shareholder value while maintaining strict cost control.
  • Finally, Parex has shown consistent growth that has been self-funded, with zero debt on the balance sheet.

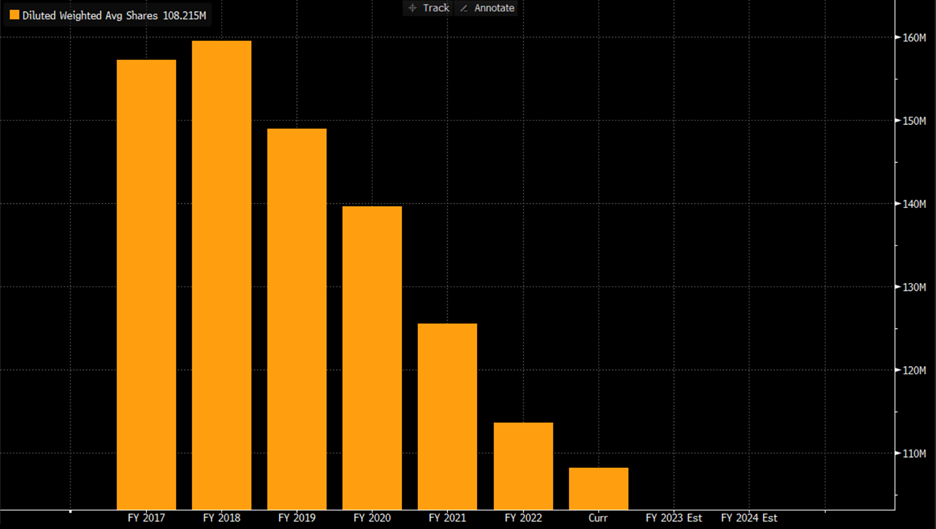
Parex has maintained a simple and consistent capital allocation framework. A full two-thirds of its funds from operations are reinvested into the business, while the remaining one-third is returned to shareholders. As seen in the chart below, Parex has reduced its free float of shares by 33% over last five years and returned $1.3 billion back to shareholders. In 2021, it announced a dividend policy to further reward shareholders, with the company offering a 5% dividend yield at current prices.

33% reduction in shares outstanding

Bar graph illustrating 33% reduction in free float of Parex Resources shares since 2017.

Parex also scores well on our ESG framework. It has reduced GHG intensity by 43% since 2019, linked executive compensation to ESG metrics and has a diverse and independent board. With a low cash cost, Parex has performed well even at today’s subdued oil prices. If a sustained period of high oil prices does materialize as we anticipate, we expect Parex to continue delivering shareholder value from a position of strength.

A bottoming out of the global stockbuilding cycle could be associated with a near-term recovery in manufacturing survey indicators. Money trends suggest that any revival will be modest / temporary and offset by wider economic weakness. 

Economic news has been unusually mixed since end-2021, with GDP weakness contrasting with labour market strength and manufacturing deterioration offset by services resilience. Confusing signals have contributed to market hopes of a “soft landing”. 

Sectoral and regional divergences may persist in H2 2023. The expectation here is that manufacturing survey weakness will abate but labour market data will worsen significantly. Money trends continue to cast strong doubt on soft landing hopes. Europe is likely to underperform the US. 

The US ISM manufacturing new orders index – a widely watched indicator of industrial momentum – hit a low of 42.5 in January and retested this level in May before recovering to 45.6 in June. 

Reasons for expecting a further rise include: 

  • The index has been in the 40s since September 2022 and the mean duration of sub-50 periods historically was eight months (ignoring episodes of three months or less). 
  • The global stockbuilding cycle remains on track to bottom out during H2 2023 and lows historically were usually preceded by a recovery in US / global manufacturing new orders. 
  • Recent price falls for raw materials and other production inputs may further incentivise firms to step up purchasing to maintain or replenish inventories.

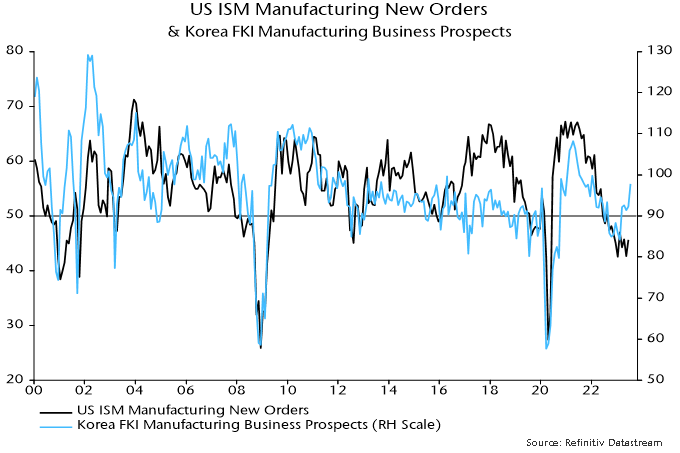
Korean manufacturing is a bellwether of US / global trends and the latest Federation of Korean Industries survey reported a marked improvement in optimism, consistent with ISM new orders moving back above 50 – see chart 1. 

Chart 1

Chart 1 showing US ISM Manufacturing New Orders & Korea FKI Manufacturing Business Prospects

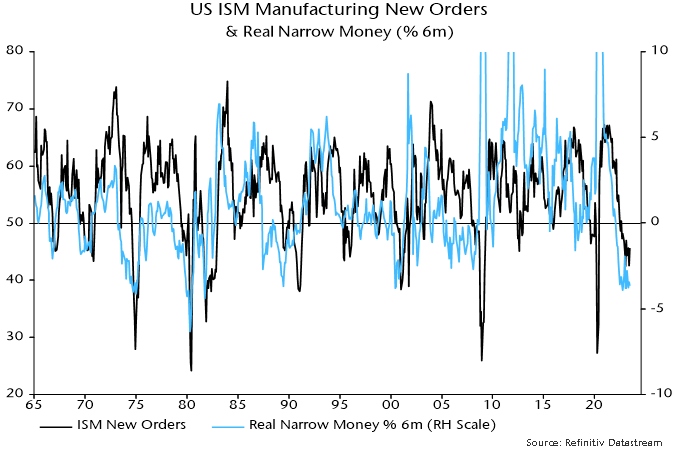
Sustained recoveries in ISM new orders from the mid 40s into expansionary territory historically occurred against a backdrop of positive and / or rising six-month real narrow money* momentum. Current trends are unfavourable, with momentum still significantly negative and moving sideways – chart 2. 

Chart 2

Chart 2 showing US ISM Manufacturing New Orders & Real Narrow Money (% 6m)

Examples of recoveries to above 50 without a supportive monetary backdrop include 1970 and 1989-90. In both cases the rise was modest (peaking below 55), short-lived and followed by a decline to a lower low. The recovery in 1970 occurred within an NBER-defined recession and in 1989-90 just before one. 

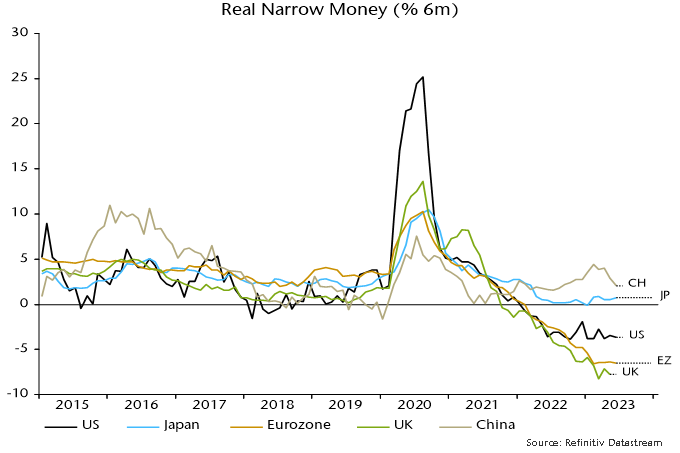
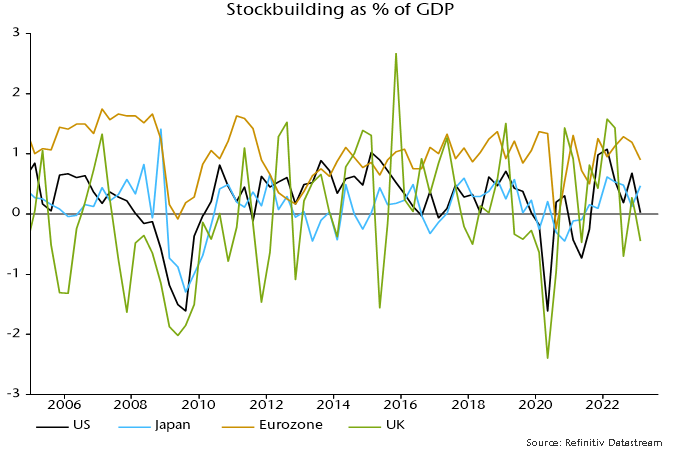
An ISM rebound might not be mirrored by much if any revival in European manufacturing surveys. Money trends are even weaker than in the US, while the stockbuilding adjustment started later in the Eurozone and probably has further to run – charts 3 and 4. 

Chart 3

Chart 3 showing Real Narrow Money (% 6m)

Chart 4

Chart 4 showing Stockbuilding as % of GDP

*Narrow money definition used here = M1A = currency + demand deposits.

Young professional looking concerned while working at her desk late at night.

Même si nous évoluons toujours en période d’incertitude lorsque nous prenons des décisions en matière de placement, certaines périodes, comme 2022, sont beaucoup plus difficiles que d’autres. Cet article présente cinq lignes directrices essentielles pour aider les comités de placement à gérer l’incertitude et à limiter les influences négatives dans le processus décisionnel.

Comprendre l’incertitude

Dans son livre Thinking in Bets, Annie Duke aborde le sujet de l’incertitude. Annie Duke est titulaire d’un doctorat en psychologie. Elle a été l’une des meilleures joueuses de poker au monde. S’appuyant sur son expérience de joueuse de poker, elle souligne à quel point les bons joueurs de poker et les bons décideurs sont à l’aise avec l’incertitude mondiale. Au lieu de se concentrer sur la prise de décision, ils tentent de déterminer leur degré d’incertitude, ce qu’Annie Duke suggère de faire pour prendre de meilleures décisions.

Le risque et l’incertitude vont de pair. Pour David Hillson, consultant international en gestion du risque, tous les risques peuvent être qualifiés d’incertains, mais les incertitudes ne sont pas toutes des risques. » Par exemple, si les prévisions météorologiques laissent entrevoir un risque de pluie, cela suppose une incertitude plutôt qu’un risque, que l’on peut régler simplement en apportant un parapluie.

Selon David Hillson, le risque est une incertitude qu’il ne faut pas négliger. Cela nous amène naturellement à nous demander comment reconnaître ce à quoi il faut accorder de l’importance. L’important est de comprendre la probabilité que le risque se concrétise et à quel point les conséquences pourraient être importantes si les choses ne se déroulent pas comme prévu. Si un événement a une forte probabilité de se produire et que le risque est important, il faudra certainement y accorder de l’importance et s’y attaquer.

Gérer l’incertitude

Que peut-on faire pour gérer l’incertitude? La première ligne directrice est de reconnaître qu’il existe de l’incertitude, tandis que les autres lignes directrices présentent une approche claire pour s’y retrouver efficacement.

Ligne directrice 1 : Prendre des décisions en gardant les yeux ouverts.

Cette ligne directrice est cruciale et dépend de la reconnaissance de la nature imprévisible des décisions pour lesquelles il existe des risques qui peuvent – ou non – être contrôlés. Il est également nécessaire d’évaluer le niveau et la probabilité du risque. Par exemple, si on s’attend à ce qu’un risque associé à un portefeuille de placement ait une incidence minimale et une faible probabilité de se produire, un comité peut décider qu’il s’agit d’un risque acceptable à assumer. Toutefois, pour les risques importants et dont la probabilité est plus élevée, un comité cherchera à atténuer le risque, notamment en améliorant la diversification du portefeuille.

Two purple onions, one is halved revealing its layers.

Ligne directrice 2 : Décomposer le problème pour le rendre plus gérable.

Cette ligne directrice s’appuie sur l’analogie avec les pelures d’oignon. En décomposant un problème en éléments plus petits, on le rend plus facilement gérable. Comme lorsqu’on épluche un oignon, l’évaluation des diverses couches d’une situation peut fournir des renseignements utiles qui n’étaient peut-être pas évidents à première vue.

L’un de ces éléments est le cadre, qui reconnaît qu’il existe des types distincts d’incertitude qui sont parfois considérés comme identiques. Par exemple, une connaissance limitée peut être attribuable à l’imprévisibilité d’un résultat, comme l’incidence de la volatilité des marchés boursiers. Par ailleurs, une connaissance limitée pourrait s’expliquer par le fait qu’un comité dispose de peu d’information sur un nouveau sujet, comme le rôle des marchés privés. La réponse serait différente pour chacun.

Une autre couche consiste à apprécier les différents groupes, personnes et organisations liés à la décision et à identifier les parties prenantes qui ont une influence sur la décision, celles qui ont l’expertise nécessaire pour la soutenir et celles qui seront touchées par celle-ci.

Il est également important de faire la distinction entre les faits et les hypothèses. Par exemple, une hypothèse de rendement annualisé de 7 % à long terme est simplement la meilleure estimation du rendement attendu et pas nécessairement le rendement qui sera réalisé.

Ligne directrice 3 : Être conscient des avantages et des limites des modèles.

La gestion de l’incertitude peut comprendre l’appréciation des avantages et des contraintes des modèles utilisés pour faciliter la prise de décisions. Voici ce que dit le statisticien britannique George Box :

« Tous les modèles sont erronés; certains modèles sont utiles. »

L’un des avantages les plus utiles des modèles est qu’ils peuvent favoriser une meilleure compréhension. Dans la construction d’un nouvel immeuble, un modèle architectural à petite échelle sert de représentation visuelle de la conception finale du bâtiment. En donnant une image plus claire et une impression générale du projet, on peut aider à repérer et à corriger les défauts de conception potentiels, ce qui permet de réduire les coûts des matériaux pendant la construction.

Les modèles statistiques sont souvent utilisés pour examiner la répartition de l’actif à long terme des investisseurs. Le rôle de ces modèles est de favoriser une meilleure compréhension des avantages relatifs des différentes répartitions de l’actif possible avant de les appliquer au portefeuille en tant que tel. Bien que ces types de modèles statistiques soient utiles pour regrouper des renseignements très complexes afin de faciliter la prise de décisions, ils ne sont que des outils et ne fournissent aucune garantie quant au résultat réel.

Ligne directrice 4 : Ne pas se laisser berner par les biais comportementaux.

Au moment de prendre des décisions, il est important d’être conscient des biais comportementaux qui peuvent influencer inconsciemment ses choix. Ces biais posent souvent des défis aux comités de placement.

Biais courants dans la prise de décision

Appel aux probabilités 
Être trop axé sur les résultats
Cadrage serré 
Ne pas envisager toutes les options
Ancrage 
Difficulté à se départir de sa première impression
Biais de confirmation 
Tendance à rechercher l’information qui confirme sa manière de penser
Fatigue décisionnelle 
Détérioration de la qualité des décisions
Émotion à court terme 
Les émotions peuvent influer sur les décisions
Appel à la mémoire 
Tirer parti des expériences passées
Excès de confiance 
Tendance à trop croire en un résultat

Dans leur livre, Decisive, Chip et Dan Heath font référence à quatre de ces biais qu’ils désignent comme les « quatre vilains » en expliquant comment ils peuvent influencer les décisions et les façons de réduire leur incidence.

  • Cadrage serré : Ce biais limite notre point de vue en concentrant notre attention sur un domaine précis, comme un projecteur qui éclaire une partie d’une scène tout en laissant tout le reste dans le noir. Un cadrage serré peut nous amener à négliger des possibilités et des points importants. Pour surmonter ce biais, il est important d’élargir nos perspectives, en éclairant différentes parties de la scène afin de découvrir de nouvelles idées et de nouvelles possibilités.
  • Biais de confirmation : Ce biais nous amène à rechercher et à privilégier l’information qui confirme nos convictions. Il peut en résulter une collecte de renseignements qui vont dans le même sens que nos convictions et une sous-estimation des risques associés à la décision. Pour contrer le biais de confirmation, il est utile de tester la réalité de nos hypothèses. Une façon d’y arriver est de demander à quelqu’un de se faire l’avocat du diable, de remettre en question nos idées et de formuler des critiques constructives avant de prendre la décision.
  • Émotion à court terme : Ce biais fait référence à l’influence des émotions immédiates sur la prise de décision. Cela peut nous amener à faire des choix impulsifs sans tenir pleinement compte des conséquences à long terme. Pour atténuer l’incidence de l’émotion à court terme, il peut être avantageux de conceptualiser les répercussions de nos décisions dans un avenir rapproché. En imaginant ce qu’on pourrait ressentir au sujet de la décision six mois plus tard, on peut réduire l’influence des émotions immédiates.
  • Excès de confiance : Ce biais consiste à avoir trop confiance dans l’issue probable de nos décisions. Nous avons tendance à croire que nos jugements et nos prévisions sont plus exacts qu’ils ne le sont. Pour remédier à l’excès de confiance, il faut reconnaître l’incertitude inhérente à la prise de décisions. Il faut être prêt à accepter que l’on a peut-être tort et à comprendre les risques de baisse potentiels associés à ses choix.

Être conscient de ces biais et mettre en place des stratégies pour les éviter peut aider à prendre des décisions éclairées et rationnelles.

Ligne directrice 5 : Obtenir la contribution de tout le monde.

La dernière ligne directrice pour gérer l’incertitude souligne l’importance de faire participer toutes les parties prenantes au processus décisionnel. Lorsqu’une nouvelle idée est présentée lors d’une réunion, il est courant de ne pas l’accueillir immédiatement et de résister à ce qui est proposé. Les nouvelles idées font souvent l’objet de réactions négatives, peu importe la qualité de l’information présentée.

Il est utile de déterminer les moments où il y a de la résistance et de permettre aux parties prenantes d’exprimer leurs préoccupations et, ce faisant, d’établir un lien de confiance avec les différentes parties prenantes. La communication est également essentielle pour provoquer des changements. En s’assurant qu’il y a une discussion à chaque étape de l’examen, on peut éviter d’arriver à la fin pour découvrir que l’on a perdu l’avis de décideurs clés en cours de route.

Comment être un décideur plus efficace

Aussi décourageant que cela puisse être, il est nécessaire de prendre des décisions en matière de placement en période d’incertitude. En suivant un processus rigoureux et en étant conscient des influences qui peuvent faire dérailler le processus, on peut être un décideur plus efficace.

Se démarquer face à l’inconnu

  • Être à l’aise avec l’incertitude associée aux placements.
  • Prioriser les risques les plus pertinents pour ses objectifs.
  • Reconnaître et accepter la nature imprévisible des décisions.
  • Décomposer les décisions complexes en éléments gérables pour en faciliter l’analyse.
  • Utiliser les modèles comme outils pour mieux comprendre les options possibles, tout en sachant qu’ils ne garantissent pas un résultat réel.
  • Être attentif aux biais comportementaux qui peuvent influer sur la prise de décision et prendre des mesures pour gérer leur influence.
  • Favoriser une communication efficace pour faciliter le changement et assurer une prise de décision éclairée.

Lorsqu’on doit prendre des décisions en matière de placement, il faut savoir maintenir le cap en période d’incertitude en gardant le contrôle de soi, appliquer des stratégies rigoureuses, avoir une communication ouverte et gérer les biais de façon à faire des choix éclairés et de réussir malgré la complexité.

Abonnez-vous aux mises à jour
Several boats along the coast line of the fishing village of Jamestown, Accra, Ghana.

While the headline returns were negative for the quarter, there were several encouraging signals in the underlying performance drivers that give us confidence in the future:

  1. The strategy’s Africa portfolio has finally contributed positively to returns after being the main drag on returns over the past 18 months.

    While there are still high levels of uncertainty looming over the economies of Egypt, Kenya, and Ghana, the prices of the securities we own there appear to have stabilised. We attribute this to valuations (a lot of bad news is in the price, in our opinion), apparent flushing out of forced foreign sellers, and early signs that these countries are emerging from their respective economic crises. We observed a tightening of credit spreads across the three African countries amid a weaker US dollar, moderating food and energy inflation, and signs that policy makers are starting to address some of the structural issues that have plagued their countries’ balance sheets and impaired the functioning of their foreign currency markets. We did not mention Morocco in the above list of countries, despite it being the strategy’s largest African country exposure. Morocco’s diverse economy helped it navigate the challenges that most countries in the continent have been dealing with, and so has not been a source of drag on the strategy’s returns.   
  2. The negative quarterly returns were generated from two core holdings that we remain fundamentally bullish on in the medium to long term.

    In our previous letters, we discussed our investment thesis on Wilcon Depot (the leading Philippines-based home improvement retailer), and Indonesia’s Sido Muncul (an herbal medicine manufacturer). While the share prices of both companies were under pressure in the quarter, we see no fundamental reason to change our constructive view on these businesses. In other words, we are more bullish on these investments at current levels.
  3. Our companies continue to invest in their markets, and insiders are buying stock.

    Across most of the portfolio, capital spending is growing at a faster rate than inflation and depreciation, and management teams are hiring and adding new products and services to further their value proposition to customers.

    A good example of this is HPS, the Morocco-listed payments technology company, which has just released version 4.0 of its flagship payment software product, PowerCard. Another example is Abdullah Al Othaim Markets, the Saudi discount grocery retailer that is winning the ~$40 billion size market by doubling down on its value-for-money proposition through the opening of 10 store a quarter, to take advantage of weakening competition, a shift in shopping behaviour to more value-for-money options, and the general growth in population in the central region, to which Al Othaim is over-indexed.

    In Malaysia, we were pleased to see buying by Tan Yu Ye, the founder and executive chairman of MRDIY, the value variety store chain that has seen a weakness in share price year-to-date on a souring of consumer stocks in the country, and a technical overhang from previous private equity ownership.

After nearly two years of unprecedented dislocation in frontier and certain emerging markets, we are seeing early signs that the opportunity set for the strategy is opening again. While these are early days, we are encouraged by the IMF’s approval of a $3 billion stand-by arrangement for Pakistan, Sri Lanka’s domestic debt restructuring, Egypt’s state asset sale program, Turkey’s market-friendly appointments at the Ministry of Finance and Central Bank, and its backing of Sweden’s NATO membership bid. In Nigeria, the abrupt removal of the crippling fuel subsidies and the liberalisation of the dislocated FX market by newly elected President Bola Tinubu are necessary remedies on the long road to restoring credibility with the market. These policy developments, along with early signs of a macroeconomic bottoming in the strategy’s core markets, and historically low valuations on a few portfolio companies, bode well for our ability to deploy capital, and for the strategy to seize on the long-term growth opportunities that these markets offer.

Vergent Asset Management LLP

Beautiful morning sunrise in seaside Dammam, Saudi Arabia.

Gulf equity markets broke a streak of four consecutive negative quarterly returns in the second quarter of 2023, and materially outperformed the MSCI Emerging Markets Index.  

In Saudi, the market performed impressively, with the MSCI Saudi Index posting a 5.5% gain in the second quarter, despite the backdrop of softer oil prices and lower production through OPEC+, muted earnings expectations from the banking sector (~35% of the Saudi index), and weak Chinese data that tempered hopes of a recovery in petrochemical earnings (~15% of the Saudi index).  

The mid-cap run in Saudi that we highlighted in our last letter continued to gain strength in the second quarter, with the MSCI Saudi Midcap Index up 9.9%, building on a 7.7% gain in the first quarter. The Saudi mid-cap space has been responsible for a significant proportion of the market’s year-to-date returns, as large index sectors like banks and materials underperformed. The sustainability of the mid-cap rally is currently the subject of intense debate. On the one hand, the bar for earnings to meet the expectations embedded in the price of many mid-cap securities has meaningfully risen. On the other hand, there is increasing evidence that the opportunity for multi-year earnings growth underpinned by Vision 2030 reforms – is most visible in mid-cap sectors such as education, healthcare, tourism, transport, and technology. This setup is a challenge for our investment process, as we aim to balance growth expectations with a price at which we believe this growth will generate attractive returns on our cost basis. 

We talked in our previous letter about our willingness to make bold decisions to preserve a relatively attractive return profile for the strategy. During the second quarter, this involved the following actions: 

  1. Continuing to back companies that trade at high near-term multiples, but that we believe will grow into those multiples over time. The best example of this is Abdullah Al Othaim Markets, the discount grocery retailer that is capturing significant share of its ~$40 billion market by doubling down on its value-for-money proposition to take advantage of weakening competition, a shift in shopping behavior to more value-for-money options, and the general growth in population in the central region, to which Al Othaim is over-indexed.
  2. Reducing or exiting positions where we believe valuations have all but caught up with the blue-sky scenario in our forecasts. This is a painful but necessary decision, as it often means parting ways with companies (and management teams) we admire, but which we can no longer justify owning at current valuations. A good example here is National Company for Learning and Education, a K-12 owner/operator with a market capitalisation of $1.2 billion based on an operating income of less than $30 million. 
  3. Buying companies with highly defensive characteristics, or those where we believe the market has left valuation room for earnings to surprise to the upside in the next six to 12 months. A good example of the former is Qatar Gas Transport, the sole distributor of Qatari liquified natural gas exports, whose vessels are chartered on long-term fixed-rate contracts, with growth optionality from Qatar’s North Field expansion project. While we will refrain from sharing examples of the latter at this stage, our focus is on high-quality businesses where near-term growth rates are moderate, but whose characteristics support a high level of free cash-flow generation relative to market capitalisation.   

Our outlook statement from the last letter remains largely unchanged, but we have introduced new language in the last paragraph regarding our thinking around valuations. We continue to see favourable opportunities for the strategy. The macroeconomic backdrop remains supportive, with healthy FX reserves and balance-of-payments positions across most of the Gulf. While still early days, the Saudi-Iranian reproachment is a key event that warrants our attention, as any progress there can lead to a lower geopolitical risk premium on regional assets. OPEC+ remains committed to maintaining high oil prices to support government spending plans, which could benefit equity markets. We also note that positioning from global emerging market funds remains light and governments in the region are intent on growing their share in the emerging market capitalization, which we believe will end up manifesting itself in a quasi-short squeeze on those funds.  

We believe that valuations in the region – particularly in Saudi – will continue to remain elevated relative to their historic levels. The political will to push through an unprecedented and transformative socioeconomic agenda, coupled with enormous financial capacity, is likely to unlock significant growth opportunities for public market companies for years to come in our view. Furthermore, governments in the region have never been more vocal about the role that their stock markets will play in crystalising their growth agendas. This is a powerful combination that, if successful, can reduce the historical oil price-induced economic and asset price volatility that has long been a characteristic of investing in the region, and consequently underpins above-average valuations through cycle. We do not, however, believe this is a tide that will lift all boats. Adhering to our investment principles will be key to identifying winning companies that can deliver attractive returns to our investors.

Vergent Asset Management LLP