This is the first of a series of short posts focusing on whether incoming economic news supports or contradicts the forecast of a global “hard landing” suggested by monetary trends. 

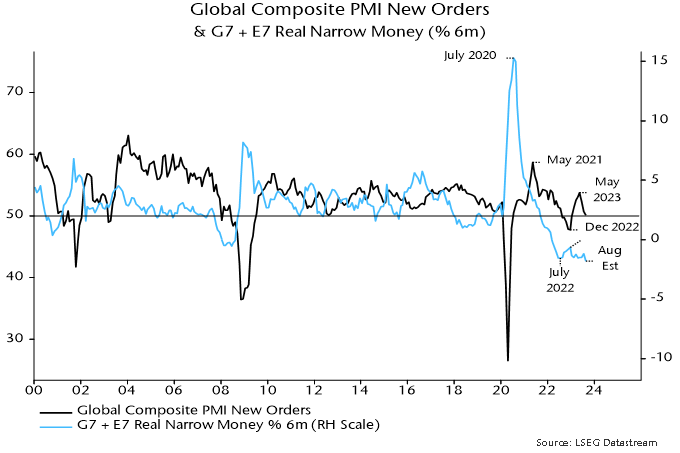
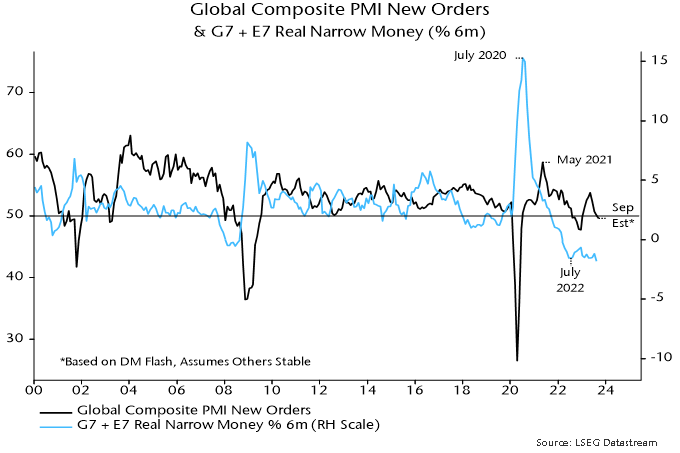
Flash results suggest that the global composite PMI new orders index – a timely indicator of demand momentum – fell for a fourth month in September, consistent with the monetary signal of a slide into early 2024, at least. 

The flash results, available for the US, Japan, Eurozone, UK and Australia, imply a decline through 50 to the lowest level since December, assuming no change in all other countries in the global aggregate – see chart 1. 

Chart 1

Chart 1 showing Global Composite PMI New Orders & G7 + E7 Real Narrow Money (% 6m)

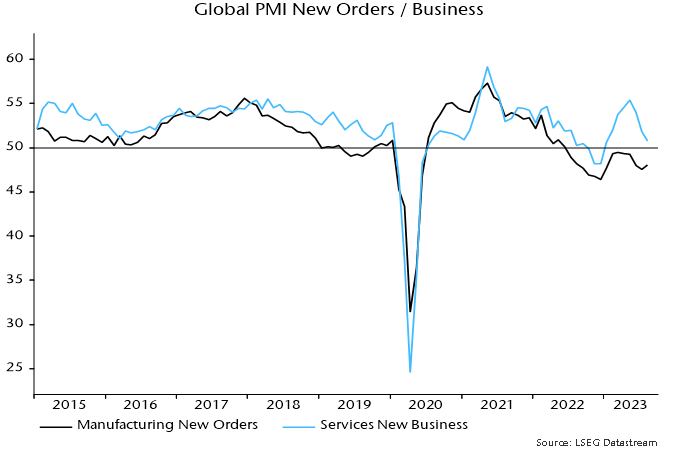
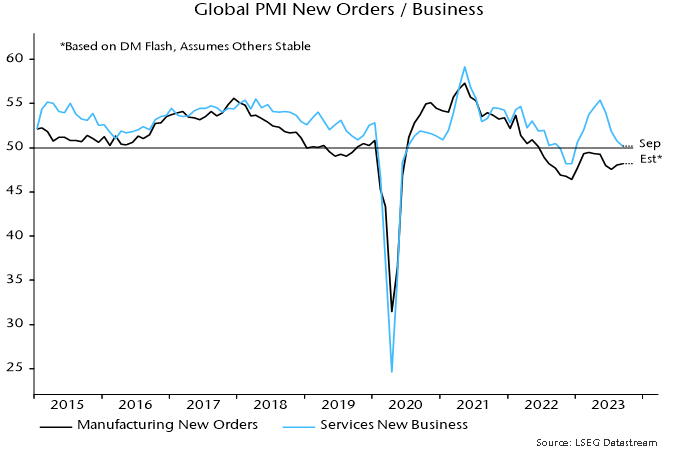
Weakness in the flash surveys was driven by a further slowdown in services new business, with manufacturing new orders little changed – chart 2.

Chart 2

Chart 2 showing Global PMI New Orders / Business

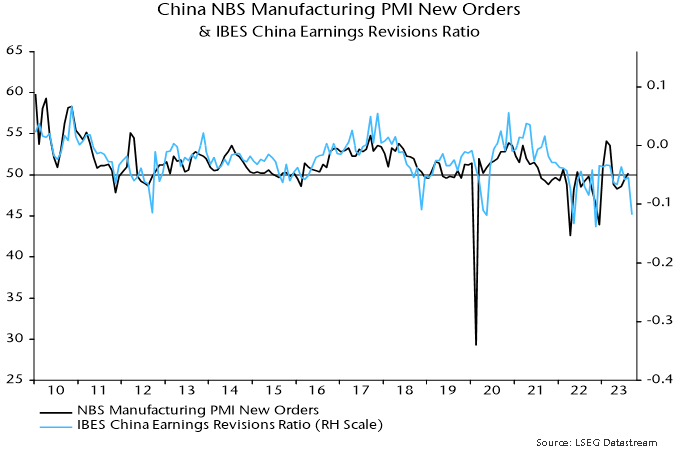
Any hopes of manufacturing stabilisation, however, may be dashed by full September results incorporating China and other emerging economies. The equity analysts’ earnings revisions ratio correlates with Chinese manufacturing PMI new orders and weakened sharply this month – chart 3. 

Chart 3

Chart 3 showing China NBS Manufacturing PMI New Orders & IBES China Earnings Revisions Ratio

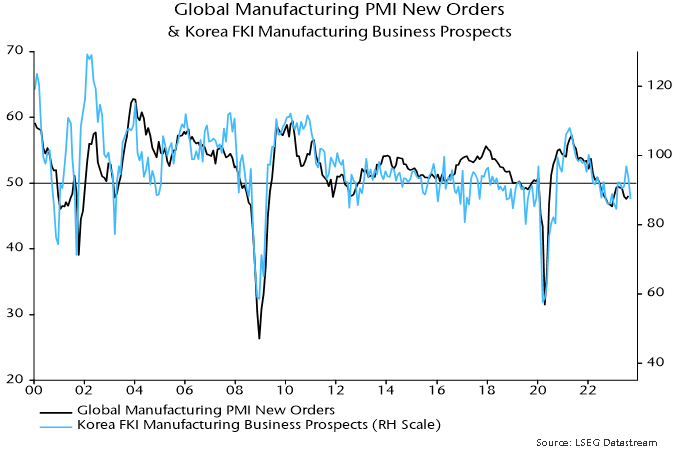
Renewed deterioration in Chinese / Asian manufacturing is also suggested by the Korean FKI survey for September, showing a relapse in the assessment of business prospects to the weakest since February – chart 4.

Chart 4

Chart 4 showing Global Manufacturing PMI New Orders & Korea FKI Manufacturing Business Prospects
A young kitten rubbing up on her adopted mama dog,

The profound and enduring love people feel for their pets is a testament to the unique and cherished bond between humans and animals. Across cultures, generations and geographies, this affection runs deep and is driving unprecedented demand for high-quality pet care, products and services. There is no doubt that pets occupy a special place in our hearts. But should they also occupy a special place in your investment portfolio?

When it comes to investment strategy, recognizing the remarkable growth within the pet industry is paramount. At Global Alpha, our preference is to invest in large and growing markets, and the pet industry perfectly aligns with this approach. As part of our meticulous investment process, it is essential to delve into the underlying factors propelling this industry’s expansion, as these drivers often vary by theme – such as demographics, innovation and environment.

How big is the pet market in North America?

As of 2023, data from the American Pet Products Association reveals that pet ownership in the United States has reached a remarkable milestone, with 66% of households, equivalent to 86.9 million homes, proudly welcoming pets into their lives. This figure marks a substantial increase from the 56% recorded in 1988, underscoring the enduring trend of pet ownership. So, how important are these pets to their owners? An astounding 85% of dog owners and 76% of cat owners affirm that their pets hold a special place as bona fide members of their families.

In 2022, Americans alone spent $136.8 billion on their pets. Back in 1996, that number was just $21 billion. Even more fascinating is that millennials comprise the highest percentage (33%) of pet owners in the US, followed by Gen X at 25% and baby boomers at 24%.

In Canada, pet industry spending reached $12.9 billion in 2022, up a whopping 486% from $2.2 billion in 1994 according to Statistics Canada.

How is the pet market different internationally?

While the US is the clear leader when it comes to spending on pets, other countries are also seeing the market grow. In the UK, the vet market is worth more than £2 billion ($2.5 billion USD) with almost two thirds of households owning a pet.

China has become the second-largest market, even though only 23% of Chinese households have pets. China’s pet industry is expected to reach $66.1 billion by the end of this year, which is 10 times the size it was a decade ago. 

At the same time, there are more than 31 million pets in India and this number is growing at an annual rate of over 12%. According to a Bonafide Research report, India’s pet care industry is expected to reach close to a billion dollars by 2025, with a CAGR of more than 19%.

How have our pet industry holdings performed?

Since inception in 2008, we have continuously maintained exposure to the animal health industry. Below are a few highlights.

VCA Antech: Profiled in our February 28, 2012 weekly

  • Founded in 1986, VCA Antech is a leading animal healthcare services company
  • The company provides lab testing for over 17,000 animal hospitals with over 30,000 veterinarians
  • Provided exposure to animal hospitals and pet diagnostics
  • Exited in Q2, 2016 as the market cap crossed the upper limit of the benchmark – the company was acquired by Mars in September 2017

Heska:

  • HSKA is a veterinary diagnostic company
  • It has 162 US patents and 139 foreign-issued patents
  • Provided exposure to veterinary diagnostics
  • Exited in Q1, 2017 as it had reached our fair value

Greencross: Highlighted in our June 3, 2016 weekly

  • Australian pet health company, founded in 1994
  • Number one pet care specialist in Australia, providing both retail and veterinary services
  • Provided exposure to animal clinics and pet retail stores
  • Exited in Q1, 2019 as it was acquired by private equity group, TPG Capital

Our current exposure to the pet industry

We are currently invested in UK pet health company, CVS Group. Founded in 1999, the company went public in October 2007.

Business overview

Headquartered in Norfolk, CVS is one of the leading veterinary services providers in the UK with about 10% market share. As of 2022, CVS has about 500 practices across its three markets, including eight specialist referral hospitals and 37 dedicated out-of-hours sites. The company also runs three laboratories, seven crematoria and an online retail business called Animed.

CVS recently entered the Australian market with a small number of acquisitions, bringing the total number of practices outside the UK to 35.

Target market

The total addressable market in the UK for veterinary products and services is over £2 billion. The market consists of six large chains and a number of independent/small chains representing 45% of the market.

On the other hand, according to IbisWorld, Australia has a $5.3 billion addressable market which is growing at 6% per annum. The level of consolidation in the Australian market is just 20% when compared to the UK, adding for future potential growth via M&A.

Competitive advantages

  • Largest and most comprehensive provider of vet services in the UK, meeting all customer needs
  • Scale – has developed shared facilities and opportunities to cross sell its products, like lab testing, generic medicines, loyalty schemes, specialist surgeries and pet cremation

Growth strategy

  • Consolidate large-animal vet practices (delivering equine & livestock care), which is more fragmented
  • Their laboratory diagnostic business could enter the farm animal diagnostics market
  • International expansion continues like their latest entry in Australia

Where we’re looking next?

We have our eyes on a few interesting companies operating in the animal health space, ranging from pet insurance and fresh pet food to a diagnostics company. Our ability to be highly selective and nimble in our portfolio holdings leaves us well-positioned to add some exposure to the animal health industry at attractive valuations.

So just one question remains: How much are you spending on your pet?

The Godil family cat

Global six-month real narrow money momentum is estimated to have broken to a new low in August, reinforcing pessimism here about economic prospects and casting strong doubt on now widely-held “soft landing” hopes. 

Real money momentum bottomed in July 2022, recovered during H2 but suffered a relapse in early 2023, retesting the 2022 low in April. The relapse has been reflected in a renewed downswing in economic momentum, as proxied by global composite PMI new orders – see chart 1. 

Chart 1

Chart 1 showing Global Composite PMI New Orders & G7 + E7 Real Narrow Money (% 6m)

A tentative stabilisation of real money momentum over the summer suggested that PMI new orders would bottom out around year-end. The further move down in August, if confirmed, signals deeper and more extended economic weakness. 

The August estimate is based on monetary data covering 70% the global (i.e. G7 plus E7) aggregate and near-complete CPI results. 

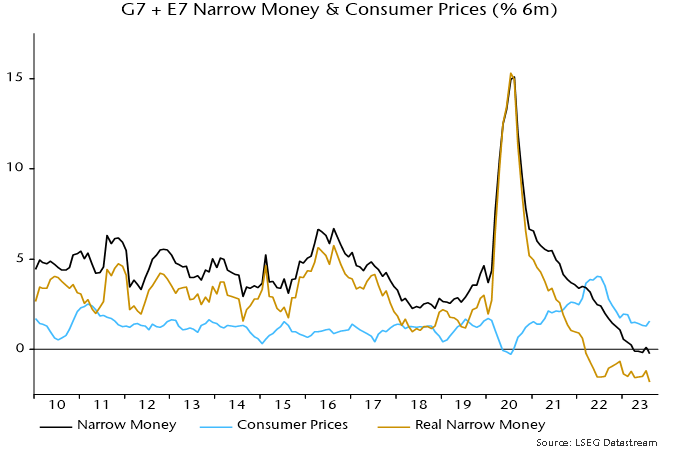
The suggested fall to a new low reflects both additional nominal money weakness and an oil-price-driven recovery in six-month CPI momentum – chart 2. 

Chart 2

Chart 2 showing G7 + E7 Narrow Money & Consumer Prices (% 6m)

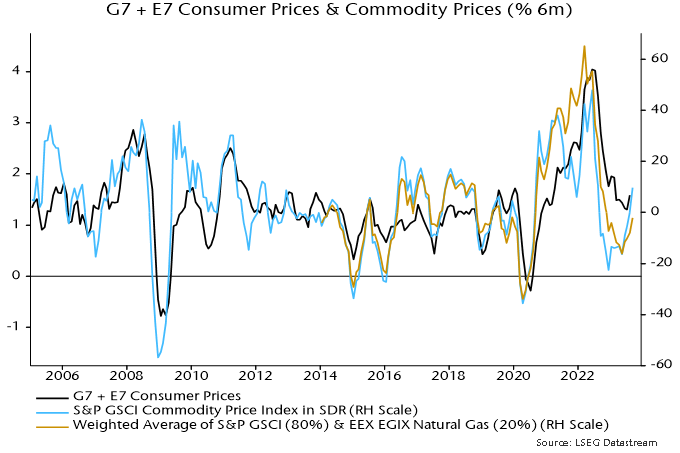
The ongoing oil price rally suggests a further near-term rise in headline CPI momentum – chart 3. A core slowdown, however, is expected to continue and may accelerate as higher oil costs squeeze spending on other items. 

Chart 3

Chart 3 showing G7 + E7 Consumer Prices & Commodity Prices (% 6m)

The further fall in real narrow money momentum has been driven mainly by China and India – chart 4. An earlier post attributed Chinese monetary weakness to misguided policy tightening in late 2022, which has since been partially reversed. Chinese August money numbers suggest greater damage from the misstep than previously assumed, implying a more urgent need for additional policy easing. 

Chart 4

Chart 4 showing Real Narrow Money (% 6m) Early Reporters

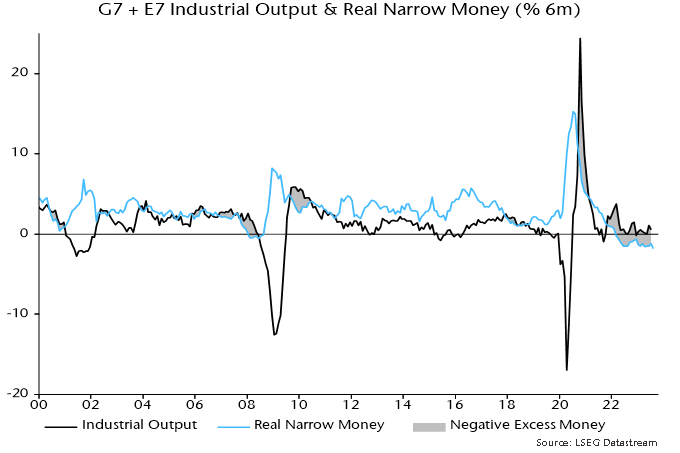
An August estimate of global industrial output is not yet available but a large negative differential between six-month rates of change of real narrow money and output is likely to have persisted – chart 5. 

Chart 5

Chart 5 showing G7 + E7 Industrial Output & Real Narrow Money (% 6m)

As previously noted, global equities have underperformed cash since this differential turned negative in early 2022 (allowing for reporting lags), despite a rally over the last 12 months. 

Why was weakness compressed into the first nine months of 2022, with a subsequent strong rebound? 

One explanation is that the Ukraine invasion and associated immediate further upward pressure on energy prices exaggerated the market response to monetary deterioration. Positioning and sentiment reached oversold extremes in late 2022, creating the potential for a relief rally as energy markets adjusted and prices fell back. 

Another possibility – admittedly difficult to assess – is that the “excess” money backdrop has been less unfavourable than suggested by the six-month momentum differential shown in chart 5, because of the existence of an overhang from the 2020-21 monetary surge. An excess stock of money, in other words, may have persisted despite the flow turning negative. 

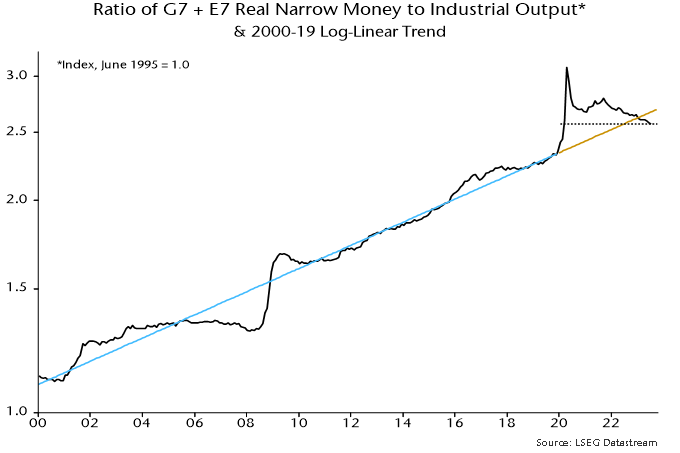
The ratio of the stock of real narrow money to industrial output has trended higher over time, with the increase reflected in rising real asset prices and wealth – chart 6. 

Chart 6

Chart 6 showing Ratio of G7 + E7 Real Narrow Money to Industrial Output* & 2000-19 Log-Linear Trend *Index, June 1995 = 1.0

A huge overshoot in 2020-21 has been correcting since late 2021 but the ratio was still above its pre-pandemic trend at end-2022, i.e. the negative flow differential had not fully offset the prior period of excess.

The stock and flow signals, however, are now aligned: the real money / output ratio moved below trend in early 2023 and its July level was the lowest since February 2020 before the policy response to the pandemic and subsequent monetary surge.
NASA image of a huge hurricane between Florida & Cuba.

This week, Global Alpha is looking at the increased frequency of natural disasters and how climate change is affecting the insurance industry.

The recent wildfires in Hawaii, the deadliest in over 100 years, is the latest in a long line of severe natural disasters. The town of Lahaina was hardest hit as damage assessment maps indicate over 2,200 buildings were destroyed or suffered some harm. Rebuilding Lahaina has been estimated to cost $5.5 billion.

Just this past Friday, a significant earthquake registering 6.8 on the Richter scale shook Morocco, leading to early estimates of over 2,800 casualties and causing severe damage to historic sites in Marrakesh. This comes after an event in February this year when Turkey and Syria were hit by an earthquake measuring 7.8 on the Richter, followed by aftershocks reaching up to 7.5. In that catastrophe, thousands of buildings collapsed, resulting in thousands of injuries and tens of thousands of deaths. It became the deadliest global disaster since 2010 and ranks as the 11th deadliest event in recorded history. Beyond the loss of life, financial assessments from the government of Turkey, the World Bank, the UN and the EU estimate the economic loss at around $91 billion, making it the 11th most costly disaster globally, after adjusting for inflation. Both events have underscored the need for stricter enforcement of modern building codes. In Syria and Turkey, a number of the buildings that fell, including newer multi-story residential structures, should have had sufficient structural integrity to mitigate significant fatalities.

Closer to home, there has been an extended period of wildfire activity across many Canadian provinces. While many of the wildfires occurred in remote regions far from major population centres, total insured losses are expected to reach several hundred million dollars and thick smoke caused hazardous air conditions in the Northeast. In June, New York and Montreal both recorded the worst air quality in the world.

Overall, the first half of 2023 experienced the highest economic impact from catastrophes since 2011, and the fifth highest on record, with the highest ever number of at least $1 billion insured loss events (18 versus the historical average of 7).

The end result is that insurers are choosing to limit exposure in some markets. Reinsurance companies are raising their rates to insurers to help cover losses above certain levels. These higher rates get passed on to consumers and other insurance buyers. Recently, State Farm and Allstate announced they are no longer providing insurance in California, the most populated US state. Reasons for their withdrawal include increased catastrophe exposure, construction costs and the reinsurance market. A similar situation is unfolding in hurricane-prone Florida, where property insurance costs are skyrocketing and Farmers Insurance pulled out of the state altogether, citing increased risk exposure.

Global Alpha holds two insurers: RLI Corp. (RLI.US) and Vienna Insurance Group (VIG.AV).

RLI is a specialty insurance company with more than 50 years of experience serving the property, casualty and surety markets. RLI focuses on niche markets that need deep and unique underwriting expertise. The company operates on both an admitted and non-admitted basis with exposures predominately in the US. RLI had some exposure to the Hawaiian wildfires primarily due to homeowner insurance in the state and recently announced its loss estimates. Although preliminary in nature, RLI estimates pretax net catastrophe losses of $65 million to $75 million related to 200 structures. These losses will be reflected in Q3-2023 results. RLI regularly monitors and attempts to manage exposure to catastrophes by limiting concentrations of locations insured to acceptable levels and by purchasing reinsurance. Catastrophe exposure models can help assess risk, but are inherently uncertain due to the sporadic observations of actual events.

Vienna Insurance Group offers insurance solutions in the property and casualty, life and health business across approximately 30 countries in Central and Eastern Europe. Vienna has a climate change strategy that provides general principles for dealing with climate change and guidelines for investments and insurance operating business. One of the first initiatives was to eliminate investments in the coal sector and significantly limit insurance coverage for new coal mining and coal-fired power plant projects. The company’s scenario analysis highlights the main natural risks as flooding, winter storms and summer (hail) storms. Science is expecting the risk of flooding and hailstorms to increase. The 2021 flooding in Bernd, Germany led to unexpectedly large losses while the same year also saw severe hailstorms in Austria and a tornado in the Czech Republic. As for winter storms, the risk is expected to increase in some countries and decrease in others. Vienna offers insurance coverage in Turkey, albeit in the less affected western part of the country. Nonetheless the company announced an expected gross impact (including active reinsurance) of €170 million.

The world is currently observing a warmer El Nino phase that often leads to shifting rainfall patterns in different parts of the world. For example, more flood-related losses have been reported in Europe, the Middle East and Africa during El Nino phases. Insurance companies have always been concerned with potential losses due to natural risks. Global warming is highlighting the critical nature of this problem. As we confront a world where the frequency and severity of natural events are exacerbated by climate shifts, the question becomes: are insurance models robust enough to adapt, or will we find ourselves financially unprepared for the evolving landscape of risk?

Chinese money rate charts, RMB rate.

Summary

  • The MSCI EM Index was down -6.13% in US$ terms for August, led by a negative month for Chinese equities.
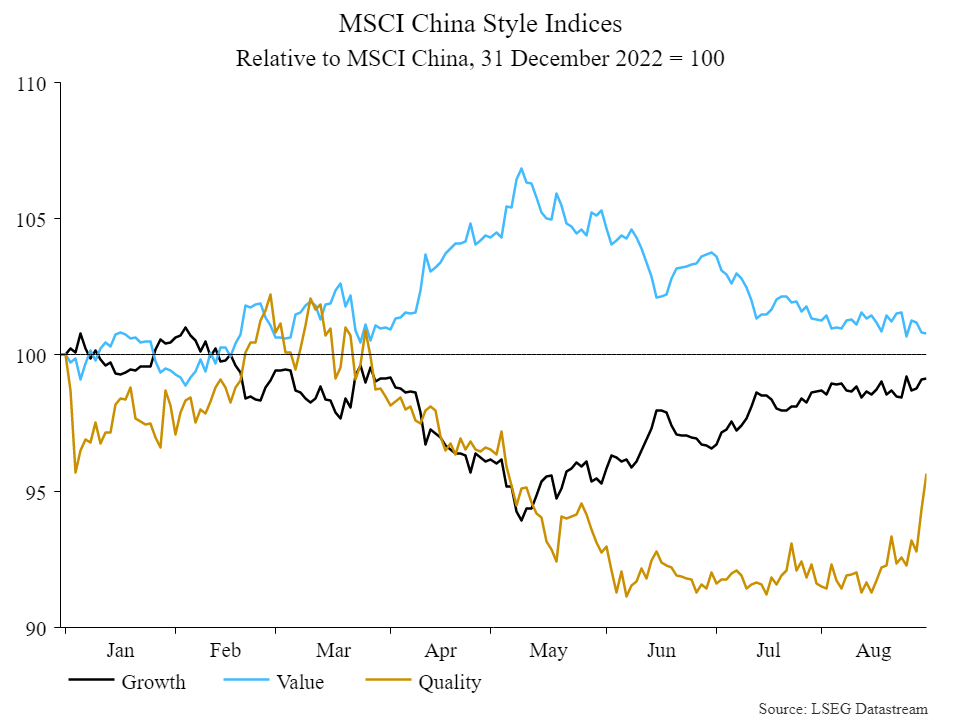
  • Stock picking in China was positive for the portfolio, as value stocks in China pulled back and quality stocks bounced following a run of poor performance through most of 2023 (chart below).
  • The Materials sector had a down month on softer economic data globally, reflected in the performance of markets with heavy exposure to commodities, including Brazil, Chile and South Africa.
  • Tech in Korea and Taiwan cooled following a strong run in 2023, fuelled by surging sentiment for AI.

India’s moon landing marks its rise

Stock picking in India was again a contributor for the portfolio, with our Indian equities flat over the month (MSCI India down nearly -2%). India celebrated a successful landing on the moon, a marker of the country’s rapid ascension – it’s the first nation to land a rover to explore the moon’s southern polar region (and on a budget of less than US$74 million). Just days earlier, Russia failed in a similar attempt.

Does BRICS+ matter?

The 15th BRICS summit took place this month, with Russia’s Putin notably absent. As a member of the International Criminal Court (ICC), South Africa would have theoretically been required to arrest Putin over ICC accusations of Russia’s alleged deportation of Ukrainian children.

The concept of the BRICS was expanded with the inclusion of Saudi Arabia, Iran, Ethiopia, Egypt, Argentina and UAE. While the idea of a body to represent and promote the interests of the “global south” is logical, some claims of what this group can achieve are wildly overstated.

Indeed, calls that this meeting marks a coherent challenge to Western predominance of international relations is overstated given the divergent economic and political interests of member states. Of the core members, only the giants China and India – strategic competitors and at times outright adversaries – offer meaningful economic and political heft to the group, while Russia, Brazil and South Africa have all gone backwards since former Goldman analyst Jim O’Neil coined the term “BRICS” in 2001. The introduction of a number of states with equally divergent views risks making the BRICS concept even more amorphous.

Early signs of recovery in China’s quality stocks

Our decision to lift portfolio exposure to a modest overweight in China last year as the economy reopened favoured higher-quality names. This reflected the view that China’s reopening would not be a V-shaped boom like what we saw in the West. Money numbers were positive and better than the rest of the world, but not especially strong in absolute terms. The authorities had also refrained from turning on the fiscal and monetary taps through lockdowns and reopening for fear of sparking the inflationary boom we have experienced in the West. Hence, we added primarily to high-quality names with robust and sustainable returns on capital as opposed to more cyclically geared stocks, given the likelihood this recovery would be fragile.

However, as the chart below illustrates, it is quality in China which has been abandoned by foreign investors over the past year. Despite the majority of our holdings posting solid results through the period, investor fears over economic malaise in China and further deterioration of Sino-US tensions saw investors sell indiscriminately as it became clear China’s path to recovery would not be so straightforward.

The chart also illustrates the divergence between performance of quality and value stocks in China, which became particularly stretched in Q2. Their outperformance since early April appears to coincide with the announcement of an SOE reform drive. Beijing is launching yet another push (one of dozens going back decades to Deng Xiaoping’s time as leader) that aims to boost the sub-par returns of these often bloated and highly inefficient companies.

In the absence of other positive stories in China, momentum-oriented domestic mutual fund managers piled into SOE stocks. While this was difficult from the perspective of relative performance for the strategy, we remain happy holders of some very strong franchises that have been posting robust results and now trade at very attractive valuations. In addition, we remain sceptical that the latest reform drive for SOEs will close the wide productivity gap between state firms and private enterprises in any meaningful way.

We remain focused on owning businesses with high returns on invested capital, low debt and management aligned with minority shareholders. This is especially important in the testing economic environment that China is in today. Our businesses should be well-positioned to weather a soft economy, while SOEs inevitably face the risk of being called up for national service by Beijing.

While only over a very short period, it was pleasing to see quality stocks in China bounce sharply in August as policies supporting the economy continue to trickle through. 

MSCI China Style Indices. Relative to MSCI China, 31 December 2022 = 100.

Steady drip feed of policy support continues in China

Last month’s commentary covered Beijing’s slow and reactive economic management, while noting signs that authorities are steadily getting a policy response into gear. Investors running for the exits may find themselves whipsawed back into China should authorities accept economic reality and act decisively. For us, while sentiment and news flow are undoubtedly poor, we remain focused on the alpha opportunity that lies between expectations and reality. A shift in the narrative from dire to very bad could be enough to spark a rally given how badly beaten up Chinese equities have been this year.

With this in mind, policy trends through the month were positive (although not exactly decisive) in August:

  • It appears that property stimulus is gathering steam on the demand side, with the PBoC lowering the minimum down-payment ratio for first and second-time homebuyers to 20%/30%, respectively.
  • The PBoC also cut key policy rates for the second time in three months, which appears to support our analysis that authorities are acting to reverse their misguided policy tightening in late 2022 and early 2023.
  • This is translating into lower rates for home loans and should provide some support to the property sector – will this help tier 1 city transactions pick up more meaningfully and move the needle for homebuyer sentiment?
  • Providing some support on the supply side (i.e. struggling private property developers like Country Garden) would also help to shore up confidence, but we are yet to hear anything concrete.
  • The State Council announced increases in personal income tax deductions for infant and children’s education and elderly care, to help ease the cost of living burden for the middle class.

None of these measures are the policy bazooka that we think can draw a line under China’s slump, but the direction of travel is positive and additional measures to address local debt challenges and ease fiscal policy should emerge in the coming months.

Thailand’s Move Forward blocked from forming government

Former real estate mogul and Pheu Thai party member, Sretta Thavisin, was sworn in as Thailand’s prime minister, having formed a 10-party coalition which includes several pro-military leaders that were previously rivals of the party. The confirmation comes hours after ousted PM and the founder of Pheu Thai’s precursor party, Thaksin Shinawatra, returned to Thailand following a 15-year exile, having fled corruption charges that have now been watered down by the monarchy.

This follows the parliament’s failure to confirm Move Forward’s leader, Pita Limjaroenrat, as the new PM in July. Despite having won the election in May, Limjaroenrat’s confirmation bid to become PM was rejected twice by parliament, driven by opposition to Move Forward’s proposal to reform laws banning criticism of the monarchy. Thaksin’s return appears to signal that a deal has been done with the monarchy to keep Move Forward out of power.

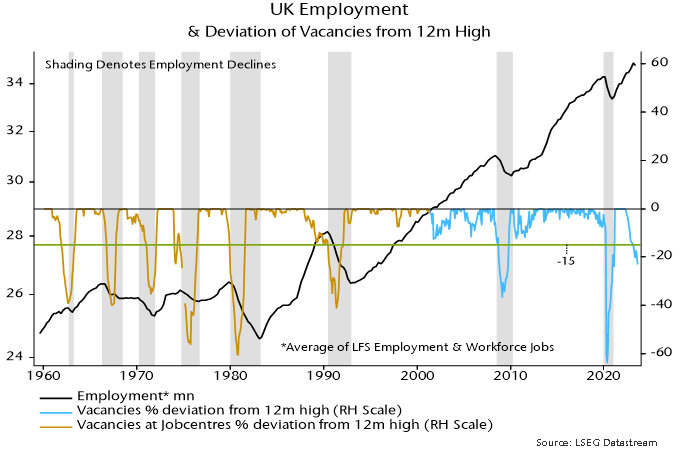
post in May suggested that UK employment would embark on a sustained decline in Q2. This was based on the stock of vacancies having fallen 17% from its 12-month peak – declines of more than 15% historically were always associated with sustained employment falls. 

Labour Force Survey employment fell by 207,000 in the three months centred on June from three months earlier, while the workforce jobs measure (of positions rather than people) was down by 153,000 between March and June. 

Vacancies have continued to collapse, with the August stock down by 23% from its 12-month high and 29% below the April 2022 peak – see chart 1. 

Chart 1

Chart 1 showing UK Employment & Deviation of Vacancies from 12m High

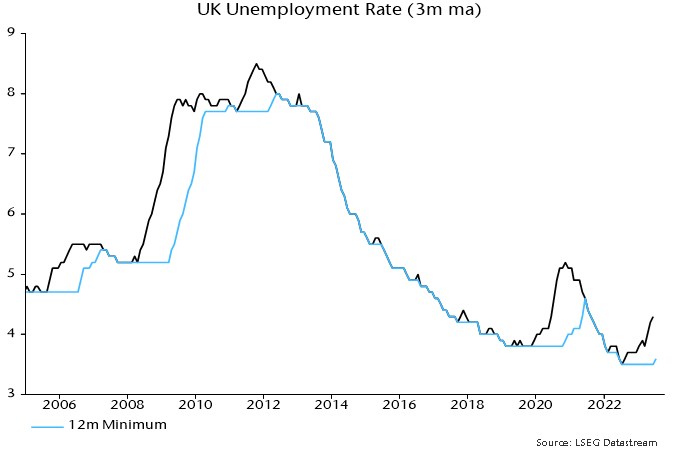
The three-month average unemployment rate, meanwhile, rose further to 4.3% in July versus an August 2022 low of 3.5%, confirming a Sahm rule recession signal (an increase of more than 0.5 pp from the 12-month minimum) – chart 2. 

Chart 2

Chart 2 showing UK Unemployment Rate (3m ma)

A July post noted that the Sahm rule has an imperfect record as an indicator of UK recessions but signals were always associated with a slowdown in average earnings growth. 

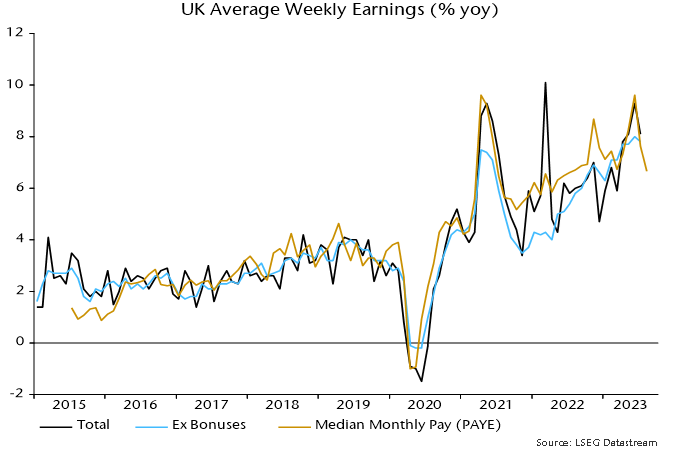
Annual growth of regular earnings ticked down from 8.0% in June to 7.8% in July, while median pay growth in the more timely PAYE dataset eased to 6.7% in August – chart 3. (Caveat: the PAYE numbers are subject to significant revision.) 

Chart 3

Chart 3 showing UK Average Weekly Earnings (% yoy)

In light of the above, claims that the latest labour market news is “mixed” and shouldn’t deflect the MPC from another rate hike next week are odd and appear to reflect confirmation bias. 

Money / credit contraction argues that current policy is much too restrictive. The ongoing collapse in vacancies and faster-than-expected deterioration in more lagging labour market indicators are consistent with this interpretation. 

MPC member Catherine Mann argues for erring on the side of overtightening because rates can be cut swiftly if a mistake becomes apparent. If only the economic damage from bad policy-making were so easily reversed.

A “double dip” in the global economy suggested by monetary trends appears to be playing out, with weakness likely to intensify into late 2023. 

The global composite PMI new orders index – a timely coincident indicator – continued its decline from a May peak last month. A relapse had been suggested by a fall in six-month real narrow money momentum from December 2022 – see chart 1. 

Chart 1

Chart 1 showing Global Composite PMI New Orders & G7 + E7 Real Narrow Money (% 6m)

The year-to-date low in real money momentum occurred in April but there was little recovery through July and another decline is possible. The suggestion is that the PMI will fall further into Q4 and remain weak into early 2024. 

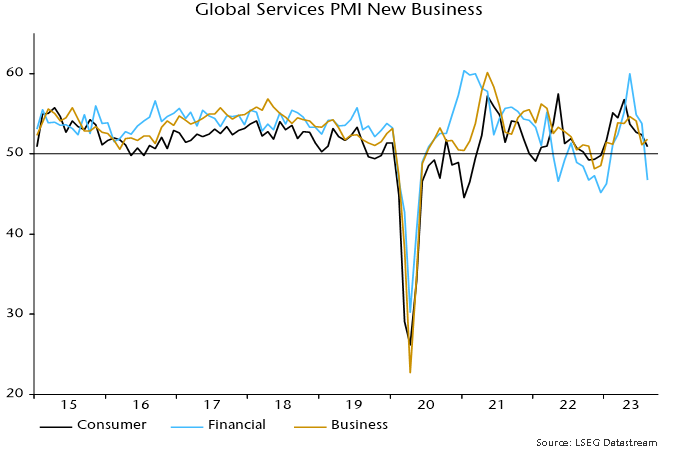
As expected, the composite PMI fall is being driven by services converging down towards weak manufacturing – chart 2. The August decline in services new business reflected a plunge in demand for financial services and a further consumer slowdown, with a partial offset from a minor recovery in business services after a larger July drop – chart 3. 

Chart 2

Chart 2 showing Global PMI New Orders / Business

Chart 3

Chart 3 showing Global Services PMI New Business

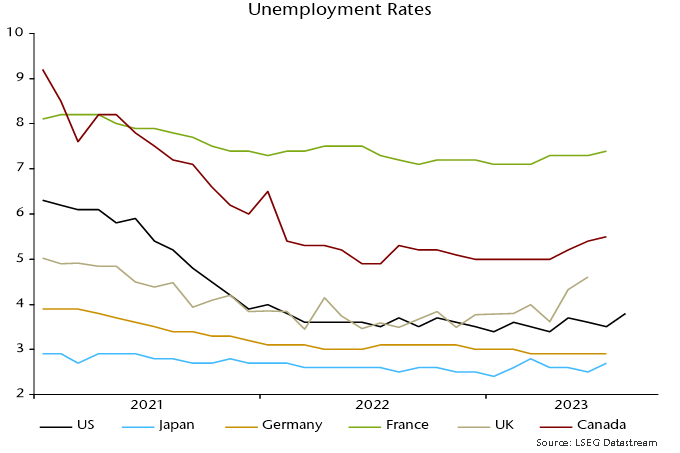
The ending of the services mini-boom, which fuelled recent employment gains, suggests a faster loosening of labour markets. Unemployment rates have reached 12+ month highs in the US, France, the UK and Canada, while a rise appears to be under way in Japan – chart 4. 

Chart 4

Chart 4 showing Unemployment Rates

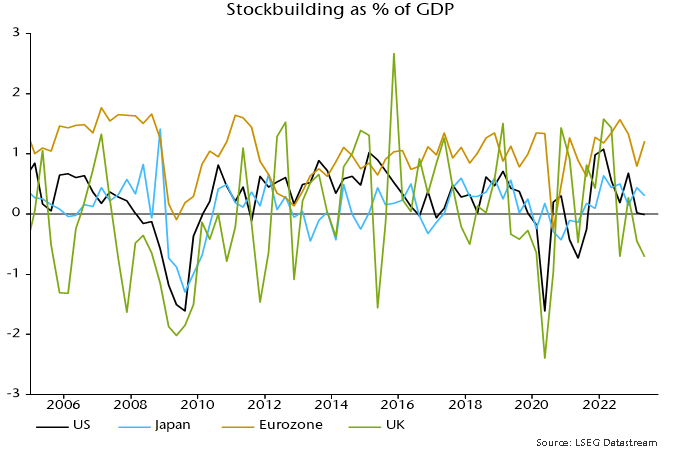
Previous posts suggested that a bottoming out of the stockbuilding cycle would support manufacturing new orders later in 2023. The cycle downswing, however, could be extended by delayed inventory cut-backs in the Eurozone: stockbuilding bounced back in Q2 as final demand contracted sharply, with recent adjustment lagging far behind the US / UK – chart 5. 

Chart 5

Chart 5 showing Stockbuilding as % of GDP
Female tying her running shoes preparing for a run.

In the wake of the unprecedented COVID-19 pandemic, global lifestyles underwent a significant transformation. As travel restrictions and lockdowns became the norm, people found themselves with limited options for entertainment and recreation. Unable to travel, many redirected their discretionary spending towards athleisure wear and comfortable shoes, fueling a boom in the sneaker and sports shoes market.   

As we come out of the pandemic, the surge in leisure goods spending is proving to be unsustainable, especially in the face of a global recession. The footwear industry, like many other sectors, is feeling the pain of this economic downturn.  

Recent earnings reports from major footwear retailers and manufacturers offer insights into this situation. Foot Locker reported its second quarter earnings last week. Revenue was down 10%, gross margins declined by 460 basis points (bps) and the company revised down guidance and paused its dividend. Reasons include weak consumer sentiment, increasing theft and shoplifting of its products and a reset strategy as Nike prioritizes its DTC channel.  

Industry giants like Nike and Adidas have their challenges too. In the quarter ending May 2023, Nike reported revenue growth of 5%. However, gross margins were down by 140 bps due to higher input and freight costs and higher markdowns. Adidas saw its revenue decline by 1% and gross margins deteriorate by 510 bps on higher supply chain costs, deeper discounting and inventory allowances for Yeezy.  

The destocking trend has been observed by one of our holdings, Coats Group PLC (COA LN), which is a world leader in thread manufacturing and structural components for apparel and footwear. It has a 24% global market share in structural components and a 28% market share in threads for the footwear category. With an extensive customer base that includes Nike, Adidas, Puma, VF Corporation and others, Coats offers invaluable insights into the worldwide footwear sector. The destocking trend emerged in the second quarter of 2022 and is expected to take another five months or so to clear the existing inventory. Coats has been in the business for over 200 years and has navigated through various market cycles to be able to anticipate upcoming shifts. This foresight has led it to implement cost-cutting measures during periods of high demand and focus on enhancing profit margins. Coats has been gaining market share consistently over the years while its competitors suffer from high leverage. 

According to Coats, the initial six months of 2023 witnessed a 30% reduction in global shoe production. However, this adjustment was not uniformly distributed across all categories. Coats observed that the performance and athletic products demonstrated a higher degree of resilience than the rest.   

Asics (7936 JP) is a Japan-based company in our portfolios that operates in this performance category. While the brand is also noticing weakness in North America and Europe, it is doing better than its peers and strong sales momentum in Asia helped the company to grow revenue by 15% in the latest quarter and improve margins by 150 bps, as price optimization was more than enough to offset the higher costs. Asics faces limited inventory risks compared to peers and does not offer deep discounts. It even revised up full year guidance and hiked its dividend forecast. The reasons behind the outperformance include:  

  • Focus on performance categories. Performance running shoes and core performance sports shoes (for athletics, tennis, volleyball and other competitive sports) account for around two thirds of Asics’s revenue. The total numbers of shoes to be sold by Asics this year is expected to be down 10%, as the company is trying to produce less entry-level products and focus on the premium models. Revenue is expected to be up 13.5% as a result of higher average sales prices.
  • Expand the profitable channels. Asics has been shifting its distribution channel from general sports goods retailers to specialty stores, with a very small portion of revenue coming from Foot Locker. In addition, the brand has been expanding its e-commerce and DTC channels, which have the highest margins. Currently, e-commerce accounts for 17% of group revenue and Asics aims to achieve 25% by 2025. The company is building a running ecosystem with its OneASICS membership program, which currently has a member base of 8.3 million. Data shows members tend to spend 50% more than non-member customers.
  • Asia reopening and inbound tourism in Japan. In the June quarter, Asics’s sales from Japan increased by 42% and sales from Greater China and Southeast/South Asia increased by 35% and 56%, respectively. In Japan, sales from inbound tourists have recovered to about 90% of 2019 levels. The anticipated recovery of Chinese tourists is expected to boost sales further. Out of the sales associated with inbound tourism, over 80% was Onitsuka Tiger (OT), Asics’s high end, stylish sneaker brand. This brand enjoys much higher margins than the company average, also contributing to its margin expansion.  

The company’s further growth will be fueled by additional market share gains, new market expansion and new product launches. Asics has been gaining market share from peers globally, now has 13% to 14% share in North America and Japan, 29% in Europe, and expects to continue this trend by offering competitive products. As a next leg of growth, Asics will look to expand its presence in emerging markets especially in Asia, as there is rising demand for sports goods and services in the region. Asics is also launching new products in other sports and has been gaining market share. It already claims the top market share in tennis shoes in Europe and the US.  

Sustainability is also a big focus for Asics. Over 90% of Asics’s running shoes contain recycled polyester. In 2022, the company unveiled the lightest ever CO2e emissions sneaker, emitting just 1.95 kg per pair, over 80% less than a regular pair of sports shoes on the market.  

With its competitive and eco-conscious product offerings, coupled with well-defined growth strategies, Asics is poised to sustain its expansion in the years to come.   

Eurozone / UK July money numbers offer further support to the assessment here that ECB / Bank of England policy tightening has been excessive and – unless reversed swiftly – will cause unnecessarily severe economic weakness and a medium-term inflation undershoot. 

The latest releases are astonishing in several respects. 

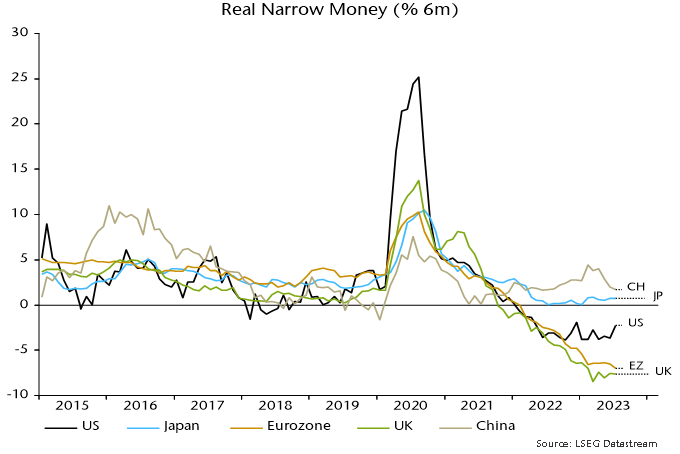
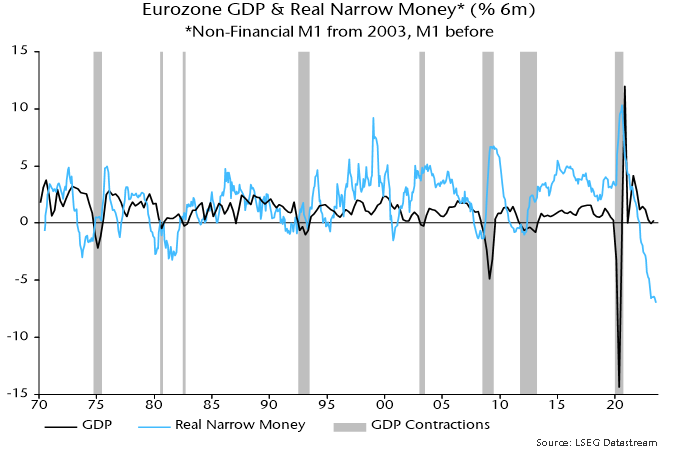
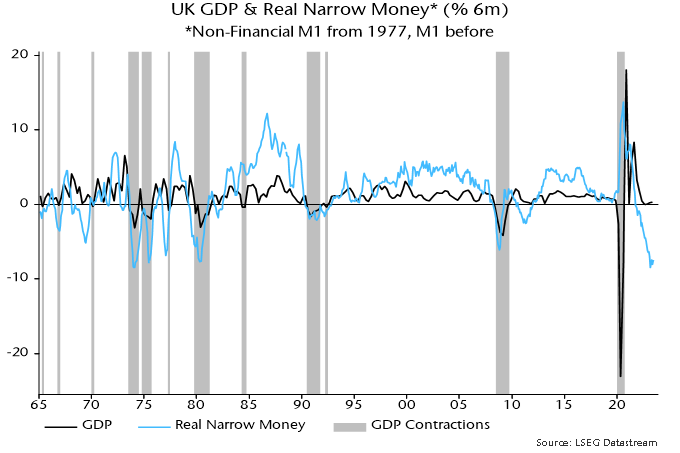
Six-month real narrow money momentum hit a new low in the Eurozone in July and is even weaker in the UK despite a recent boost from falling six-month CPI inflation. Readings are much worse than elsewhere and historically extreme – see charts 1-3. 

Chart 1

Chart 1 showing Real Narrow Money (% 6m)

Chart 2

Chart 2 showing Eurozone GDP & Real Narrow Money* (% 6m) *Non-Financial M1 from 2003, M1 before

Chart 3

Chart 3 showing UK GDP & Real Narrow Money* (% 6m) *Non-Financial M1 from 1977, M1 before

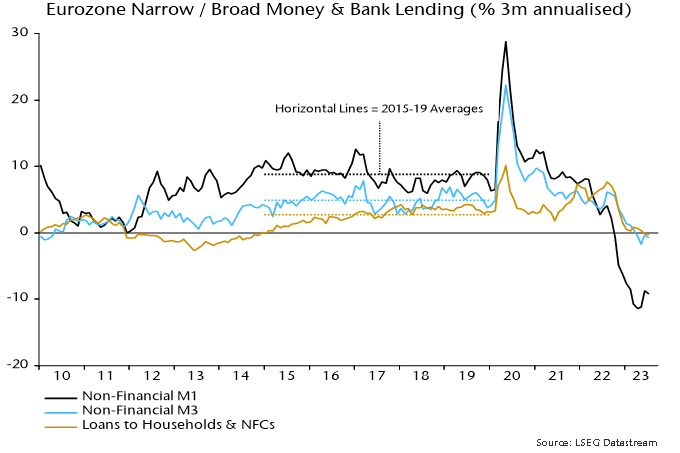
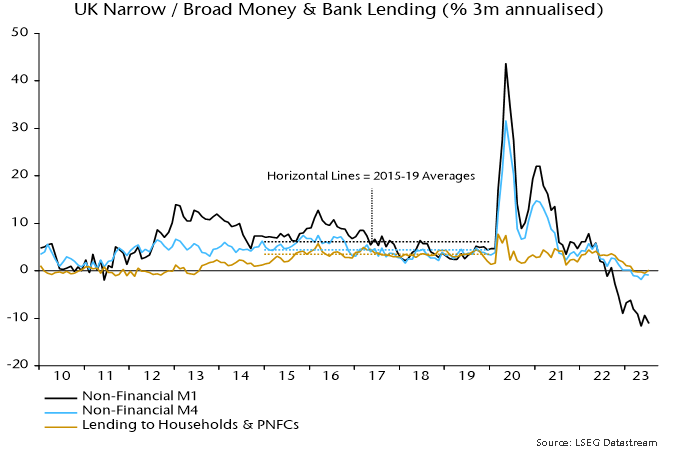
Broad money has followed narrow into nominal contraction. The preferred broad measures here, i.e. Eurozone non-financial M3 and UK non-financial M4, fell at annualised rates of 0.8% and 0.9% respectively in the three months to July – charts 4 and 5. 

Chart 4

Chart 4 showing Eurozone Narrow / Broad Money & Bank Lending (% 3m annualised)

Chart 5

Chart 5 showing UK Narrow / Broad Money & Bank Lending (% 3m annualised)

Broad money declines are rare: since 1970, the Eurozone / UK three-month changes were negative only for a brief period around the GFC, with the falls of similar magnitude to recently. 

Money leads the economy while credit is coincident / lagging. Bank lending to households and non-financial firms is starting to contract, consistent with recessions being under way – charts 4 and 5. 

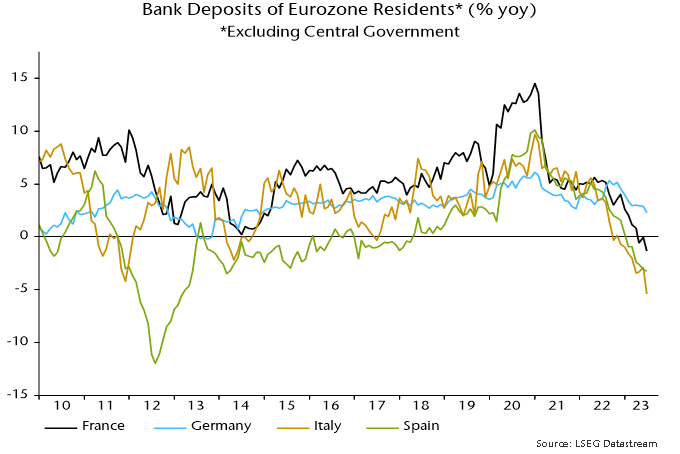
A further notable feature of the Eurozone data is a widening divergence between still-rising bank deposits in Germany and falls elsewhere – chart 6. 

Chart 6

Chart 6 showing Bank Deposits of Eurozone Residents* (% yoy) *Excluding Central Government

A similar core / periphery monetary divergence in 2011 warned of an escalating Eurozone crisis. The driver then was capital flight from the periphery, reflected in a ballooning of national central bank TARGET deficits / surpluses. 

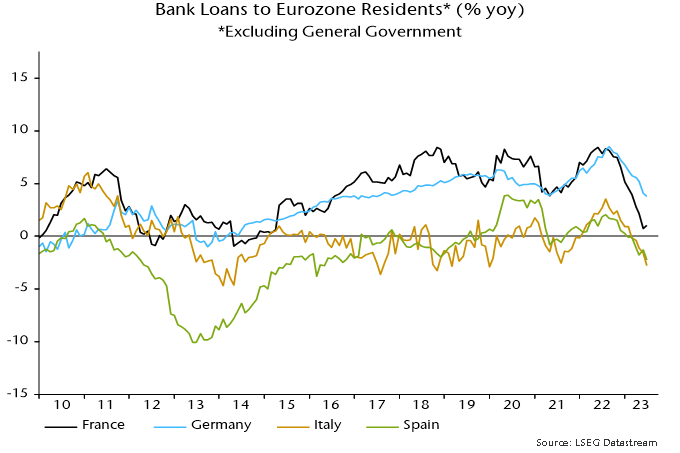
The Bundesbank’s TARGET surplus has fallen recently. Rather than capital flows, the relative resilience of German broad money is explained by less pronounced weakness in bank lending – chart 7. 

Chart 7

Chart 7 showing Bank Loans to Eurozone Residents* (% yoy) *Excluding General Government

So money / credit trends suggest that economic prospects in the rest of the Eurozone are at least as bad as in Germany. 

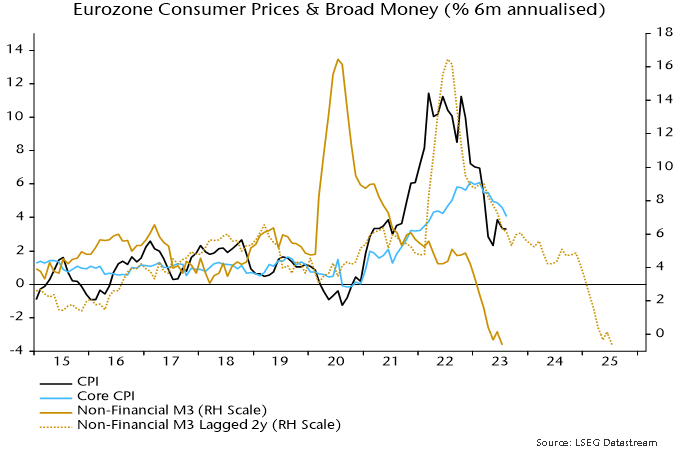
Eurozone six-month CPI momentum, meanwhile, continues to track a simplistic monetarist forecast based on the profile of broad money growth two years earlier – chart 8. Six-month headline momentum was unchanged at 3.3% annualised in August but core slowed further to 4.0%, a 17-month low. 

Chart 8

Chart 8 showing Eurozone Consumer Prices & Broad Money (% 6m annualised)

The suggestion is that six-month headline momentum will reach 2% next spring, with the annual rate following during H2. A subsequent significant undershoot is indicated unless recent monetary weakness is reversed.

Why have global government bond yields picked up over the summer despite weakening PMIs and neutral / favourable inflation news? 

The rise is attributed here to a further deterioration in the global “excess” money backdrop driven partly by unexpected output strength as an easing of supply constraints has allowed firms to work off order backlogs. Output is expected to realign with weak / falling incoming demand during H2, suggesting a reversal of liquidity tightening. 

The rise in nominal yields has been driven by the real component with inflation expectations little changed. 

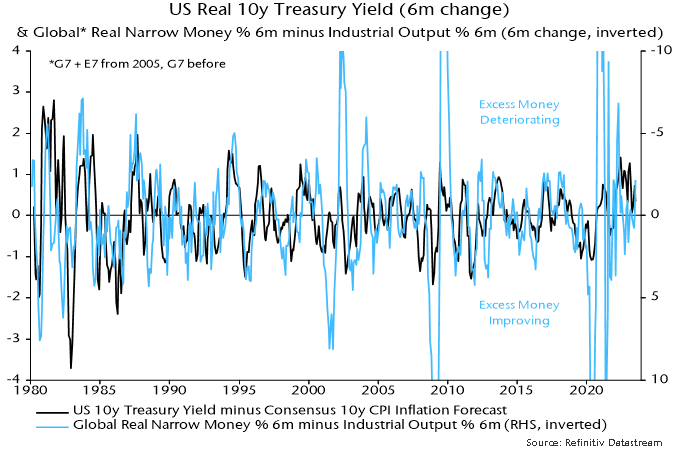
Changes in real yields have been inversely correlated historically with changes in global “excess” money momentum, as measured by the differential between six-month rates of change of real narrow money and industrial output – see chart 1. 

Chart 1

Chart 1 showing US Real 10y Treasury Yield (6m change) & Global* Real Narrow Money % 6m minus Industrial Output % 6m (6m change, inverted) *G7 + E7 from 2005, G7 before

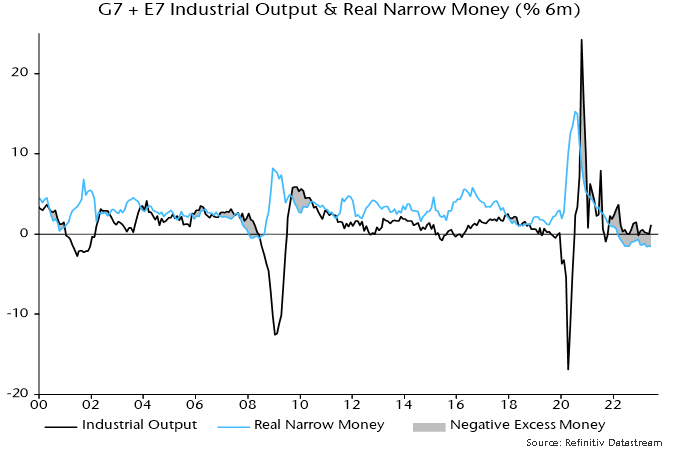
This differential has been negative since early 2022 but was expected to narrow as monetary tightening fed through to weaker economic activity and slowing inflation lifted real money momentum. Instead, industrial output growth rose to a seven-month high in June while nominal money weakness has offset a disinflation boost to real momentum – see chart 2. 

Chart 2

Chart 2 showing G7 + E7 Industrial Output & Real Narrow Money (% 6m)

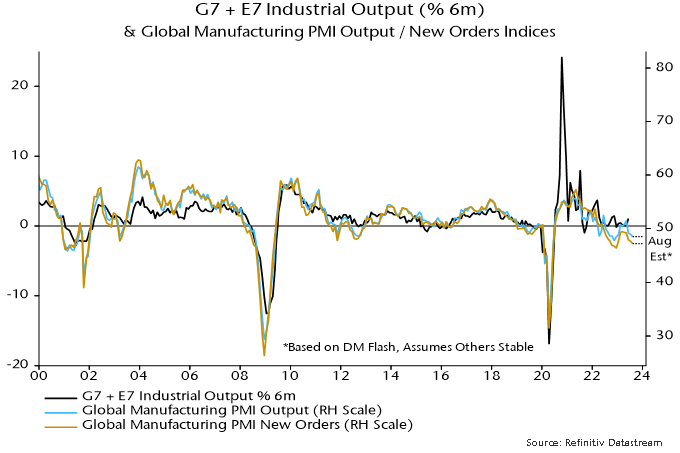
Production resilience was signalled by a recovery in the global manufacturing PMI output index, which crossed 50 in February on the way to a May high. It moved back below breakeven in June / July, however, with August flash results suggesting a return to the December 2022 level or lower – see chart 3. 

Chart 3

Chart 3 showing G7 + E7 Industrial Output (% 6m) & Global Manufacturing PMI Output / New Orders Indices

Covid-related supply disruption resulted in the PMI output index lagging the new orders index in 2021 / H1 2022, but the position has reversed over the past year as production bottlenecks have eased, allowing firms to fulfil outstanding orders. 

With the PMI delivery speed index – an inverse indicator of bottlenecks – hitting a 14-year high in May, the supply catch-up is probably ending, suggesting that the PMI output index – and hard production data – will converge with weaker new orders. At the current level of the latter index, this would imply output contraction. 

The real narrow money / industrial output momentum differential, therefore, is likely to narrow unless nominal money data weaken further and / or consumer price inflation rebounds (unlikely). While G7 tightening is still feeding through, stable / easier monetary policies are expected to promote money growth recoveries in EM. 

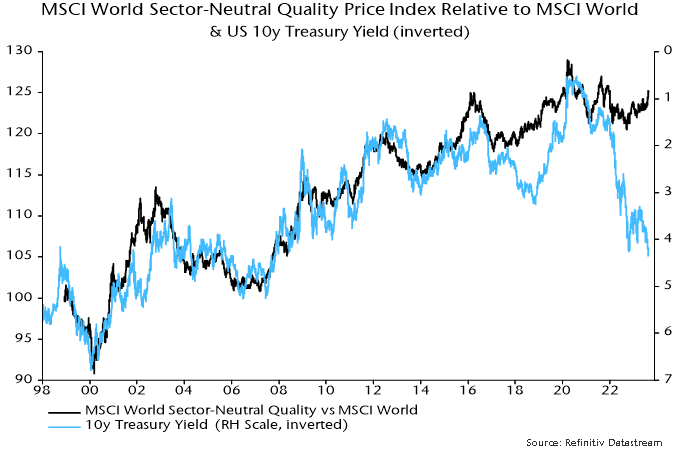
Commentaries here have suggested that the monetary / economic backdrop would favour quality stocks in 2023. The MSCI World quality index is 7.1% ahead of MSCI World in price terms year-to-date (as of yesterday’s close). This mainly reflects a high weighting in tech, but the sector-neutral quality index (which imposes MSCI World sector weights) is also now outperforming the main index and has reversed its relative weakness in 2022 – see chart 4. 

Chart 4

Chart 4 showing MSCI World Sector-Neutral Quality Price Index Relative to MSCI World & US 10y Treasury Yield (inverted)

The recent relative gain is striking against the backdrop of rising Treasury yields, with which the style has been inversely correlated historically, as the chart shows. The divergence is reminiscent of 2018, when the quality relative embarked on a sustained rise in February but a fall in Treasury yields was delayed until November. This year’s quality rally also started in February, suggesting a resolution of the current disconnect with yields by year-end.