Après une bonne année pour les marchés, nous avons amorcé 2024 dans un contexte de risques géopolitiques et d’inflation élevée au premier plan des préoccupations des investisseurs, accompagnés d’une myriade de préoccupations quant à ce qui pourrait mal tourner. Malgré certaines turbulences en cours de route, les marchés ont défié les inquiétudes, les marchés boursiers américains et mondiaux affichant des rendements particulièrement élevés pour 2024. Cette revue examine le rendement des principales catégories d’actif, ainsi que les facteurs à prendre en compte pour 2025 et à long terme.
Actions – les titans technologiques foncent
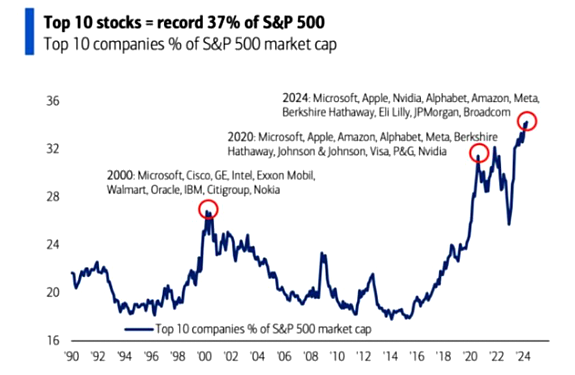
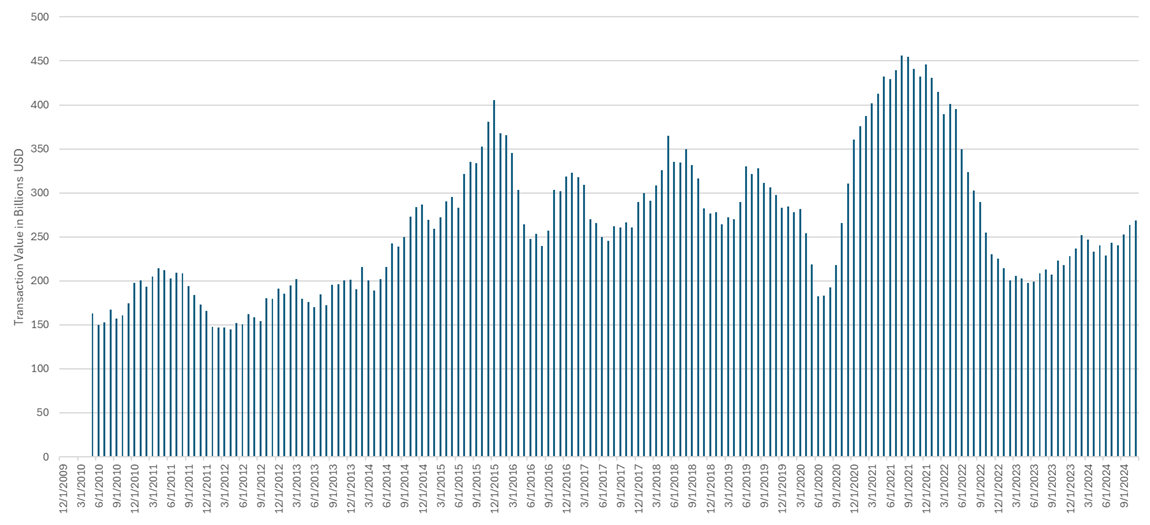
Une fois de plus, les manchettes sur les rendements boursiers ont été dominées par les titres technologiques américains des sept magnifiques : Alphabet (Google), Amazon, Apple, Meta Platforms, Microsoft, Nvidia et Tesla continuent d’orienter les marchés boursiers américains et mondiaux, grâce à l’exubérance des investisseurs face aux avantages de l’intelligence artificielle. Au cours de la dernière décennie, la capitalisation boursière de ces sept titres a considérablement augmenté, leur représentation dans l’indice S&P 500 ayant plus que triplé par rapport à il y a dix ans (figure 1).
Figure 1 – Croissance des sept magnifiques en pourcentage de l’indice S&P 500
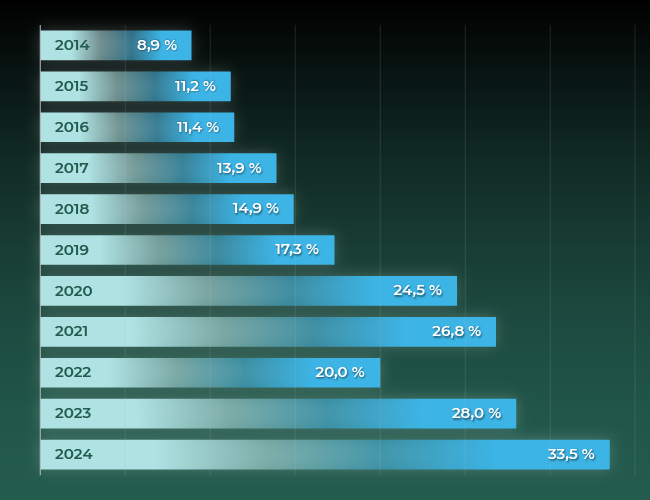
Sources : Bloomberg & S&P
Les actions américaines représentent la composante individuelle la plus importante de la plupart des portefeuilles des investisseurs, de sorte qu’avec l’augmentation du niveau de concentration, la gestion du risque de portefeuille devrait demeurer une priorité pour les investisseurs à l’approche de 2025. Cela ne veut pas dire que le secteur américain des technologies de l’information ne continuera pas à bien se comporter, mais 2022 nous a rappelé que les titres technologiques peuvent enregistrer des rendements nettement inférieurs dans des conditions moins favorables. Les sept magnifiques sont passés de près de 27 % de la part de l’indice S&P 500 à la fin de 2021 à 20 % à la fin de 2022.
Dans l’ensemble, les actions produisent de bons rendements
La figure 2 résume les rendements en dollars canadiens de plusieurs grands indices boursiers pour l’année civile 2024.
| Figure 2 – Rendements des actions en 2024 (%) | ||
|---|---|---|
| Actions canadiennes | Indice composé plafonné S&P/TSX | 21,7 |
| Actions américaines | Indice S&P 500 | 36,4 |
| Actions internationales | Indice MSCI EAEO (net) | 13,2 |
| Actions de marchés émergents | Indice MSCI Marchés émergents (net) | 17,3 |
| Actions mondiales des pays développés | Indice MSCI Monde (net) | 29,4 |
| Actions mondiales | Indice MSCI Monde tous pays (net) | 28,1 |
| Actions mondiales à petite capitalisation | Indice MSCI Monde à petite capitalisation (net) | 18,0 |
Sources : Bloomberg, S&P & MSCI
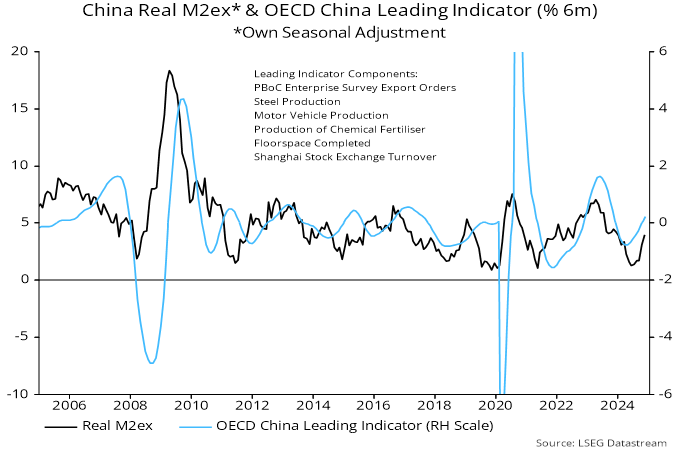
Le marché boursier américain a devancé de loin les autres grands marchés développés et a enregistré un rendement de 22,5 % en 2023. Pour mettre les choses en contexte, la dernière fois que le marché boursier américain a clôturé une deuxième année civile consécutive avec un bond d’au moins 20 % remonte à 1997-1998. La vigueur du marché boursier américain s’est également traduite par une représentation accrue des indices de référence d’actions mondiales, comme l’indice MSCI Monde. Le marché boursier international a été à la traîne des autres grands marchés en 2024, plombé par les rendements plus faibles du Royaume-Uni et de l’Europe, qui ont contrebalancé les rendements supérieurs des actions japonaises. Même si les marchés émergents ont inscrit un rendement de 17,3 % pour l’année, les actions chinoises ont été particulièrement performantes dans la région, progressant de plus de 30 %.
Titres à revenu fixe – effet négatif de la durée
En 2024, les manchettes sur les marchés des titres à revenu fixe étaient axées sur la façon dont les banques centrales mondiales réagiraient à la réduction des taux d’intérêt pour s’attaquer à la hausse de l’inflation. Les conditions économiques ont entraîné plusieurs baisses de taux tout au long de l’année. Toutefois, à divers moments de l’année, les taux des titres à revenu fixe ont rebondi en raison des préoccupations à l’égard du niveau d’inflation. La figure 3 résume les rendements de plusieurs indices de titres à revenu fixe pour l’année civile 2024.
| Figure 3 – Rendements des titres à revenu fixe en 2024 (%) | ||
|---|---|---|
| Liquidités | Indice des bons du Trésor à 91 jours FTSE Canada | 4,9 |
| Obligations universelles | Indice des obligations universelles FTSE Canada | 4,2 |
| Obligations à long terme | Indice des obligations globales à long terme FTSE Canada | 1,3 |
| Obligations à rendement élevé | Indice Merrill Lynch US High Yield Cash Pay BB | 10,5 |
Source: Bloomberg, S&P, Merrill Lynch & FTSE
Les stratégies à rendement élevé ont mené le bal des rendements des titres à revenu fixe publics par année civile. Malgré la baisse des taux à court terme au cours de l’année, les marchés des liquidités ont inscrit de très bons rendements, l’indice des bons du Trésor à 91 jours FTSE Canada progressant de 4,9 %. Du côté des titres à revenu fixe, les investisseurs, comme les fonds de dotation, les fondations et les fiducies autochtones investissent habituellement dans une combinaison de titres à revenu fixe à court, à moyen et à long terme, comme des stratégies étalonnées sur l’indice des obligations universelles FTSE Canada. L’indice des obligations universelles a enregistré un rendement de 4,2 % pour l’année civile.
Une baisse du rendement à long terme à l’horizon
Le rendement actuel de l’indice des obligations universelles fournit un indicateur raisonnable des rendements attendus à long terme. La figure 4 illustre le rendement des obligations universelles au fil du temps (ligne bleu pâle) ainsi que les rendements réels absolus subséquents sur 10 ans (ligne bleu foncé). Il existe une forte corrélation entre les deux lignes, ce qui donne à penser que le taux de 3,6 % à la fin de 2024 est un indicateur raisonnable du rendement prévu des obligations universelles au cours des 10 prochaines années.
Figure 4 – Rendements des obligations universelles et rendements subséquents sur 10 ans
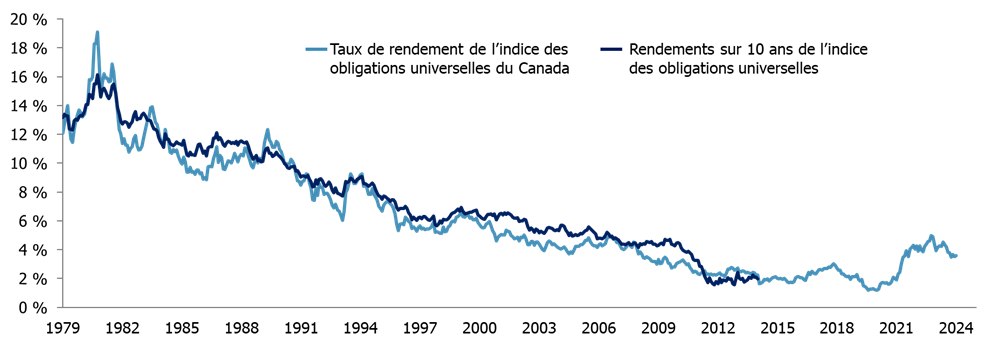
Sources : Bloomberg & FTSE
Du point de vue du rendement, compte tenu du potentiel de rendement plus faible de l’indice des obligations universelles à long terme, les stratégies à rendement plus élevé, comme les titres de créance à rendement élevé, les titres de créance des marchés émergents, les prêts hypothécaires commerciaux et le crédit privé pourraient susciter un intérêt accru de la part des investisseurs qui cherchent à améliorer les rendements des titres à revenu fixe.
Du point de vue de la gestion du risque, nous nous attendons à un intérêt continu pour les solutions de titres à revenu fixe à rendement absolu. Elles sont conçues pour produire des rendements supérieurs à ceux des liquidités sans être assujettis à la volatilité que les stratégies d’obligations universelles ont connue en 2024 (ainsi qu’au cours des deux années civiles précédentes); elles ne sont pas tributaires d’un niveau de durée de l’indice de référence et des fluctuations connexes aux variations des taux.
La dynamique des régimes à prestations déterminées
La situation est différente pour les régimes de retraite à prestations déterminées (PD) dont les titres à revenu fixe sont davantage axés sur la gestion du risque que sur la production de rendement. Les régimes à PD ont généralement une pondération importante en titres à revenu fixe à long terme pour couvrir le risque de taux d’intérêt associé aux variations de la valeur de leurs passifs. Les facteurs qui déterminent les taux à long terme sont moins influencés par la politique des banques centrales et, en 2024, ont enregistré des rendements beaucoup plus faibles que ceux des liquidités et des obligations universelles, en raison de la légère hausse des taux à long terme au cours de l’année.
L’amélioration importante de la capitalisation des régimes à PD au cours des dernières années a conduit de nombreux régimes à augmenter le niveau de couverture du risque de taux d’intérêt afin de réduire les fluctuations du niveau de financement. Les mesures spécifiques dépendent du type de régime à PD (p. ex., d’entreprise, universitaire ou public), des mesures de passif actuarielles qui dictent l’évaluation du risque, et de facteurs tels que l’ouverture ou la fermeture du régime à de nouveaux participants et l’échéance du régime (p. ex., pourcentage de participants actifs par rapport aux retraités et aux participants bénéficiant de droits différés).
Une autre tendance en matière de gestion du risque qui s’est poursuivie à un rythme élevé en 2024 avec les plans d’entreprise a été la réduction des risques au moyen d’achats de rentes auprès de compagnies d’assurance. De plus en plus appelé « transfert du risque de retraite » (TRR), l’achat de rentes permet à une société de réduire le passif en dollars de son bilan en transférant des actifs et des passifs à la compagnie d’assurance. Selon les estimations, le marché canadien des TRR en 2024 sera supérieur au record de 2023, qui était tout juste inférieur à 8 G$ CA. Le marché des TRR a considérablement évolué depuis qu’il a participé personnellement au premier rachat de rentes modernes par un régime de retraite canadien en 2009. À l’époque, la valeur annuelle du marché des rentes collectives était d’environ 1 G$ CA, la plupart des opérations étant effectuées pour des régimes de retraite qui étaient en liquidation et qui utilisaient des rentes pour régler leurs passifs de prestations de retraite plutôt que comme solution de transfert de risque populaire aujourd’hui.
Des expériences contrastées sur les marchés privés
Au cours des 10 dernières années environ, les marchés privés ont enregistré d’importantes entrées de fonds en provenance des investisseurs institutionnels. Selon PwC, l’actif sous gestion (ASG) mondial devrait atteindre 145 000 milliards de dollars américains en 2025, soit presque le double de près de 84 900 milliards de dollars américains en 2016.1 La même recherche prévoit que les placements non traditionnels dépasseront les 21 000 milliards de dollars américains d’ici 2025, ce qui représente 15 % de l’ASG total.
En ce qui concerne les marchés privés, il est difficile d’établir des généralités, car les rendements et les perspectives dépendent fortement de la stratégie de placement spécifique. Toutefois, les rendements des divers marchés privés ont été contrastés en 2024. Les stratégies de titres de créance privés et d’infrastructures ont produit des rendements convenables. Les infrastructures continuent de susciter l’intérêt des investisseurs en raison de leur rôle essentiel dans les efforts mondiaux visant à gérer le risque climatique au moyen de projets d’énergie propre, comme en témoigne le nombre croissant de stratégies axées sur la transition énergétique. Le crédit privé devrait également jouer un rôle croissant dans le financement des projets de transition énergétique.
L’immobilier commercial et le capital-investissement ont tiré de l’arrière sur les marchés privés, même si la confiance s’améliore. En période de tensions sur les marchés et de baisse des valorisations, il y a aussi des occasions, comme celles offertes par l’immobilier commercial et le lancement de diverses stratégies opportunistes.
Les fonds de couverture sont une option de placement non traditionnel souvent négligée. Il existe de nombreuses stratégies différentes, alors, encore une fois, il est difficile de généraliser. Peu de fonds de couverture auraient été en mesure de suivre le rendement de l’indice S&P 500 en 2024. La combinaison de la hausse des rendements des actions négociées en bourse, de la complexité accrue et des frais de gestion de placement plus élevés associés aux fonds de couverture peut compliquer la tâche de nombreux investisseurs qui cherchent à les intégrer à leur portefeuille. Toutefois, les marchés boursiers ne seront pas toujours aussi vigoureux et les fonds de couverture peuvent offrir une importante diversification de portefeuille dans certains contextes difficiles.
Les investisseurs canadiens ont profité des devises et des matières premières
Le dollar canadien a reculé de plus de 8 % sur 12 mois par rapport au dollar américain, ce qui a contribué à stimuler les rendements boursiers américains pour les investisseurs canadiens non couverts. La figure 5 montre la variation des taux de change depuis 1970 et illustre donc le contexte associé aux fluctuations du dollar canadien par rapport au dollar américain à l’ère moderne. Au cours de la période, le dollar canadien a connu trois baisses importantes. Du sommet au creux, ces replis ont chacun totalisé un peu plus de 30 %. Les deux premières baisses ont duré environ 10 ans, tandis que la plus récente a été la baisse la plus rapide, en raison en partie de l’effondrement brutal des prix du pétrole.
Depuis le dernier creux de 2016, le dollar canadien a continué de fluctuer dans une fourchette relativement étroite, et ce, malgré l’incertitude associée à la pandémie de COVID-19 et les niveaux élevés de l’inflation. Le dollar canadien se situait à 69,53 cents américains à la fin de 2024, se rapprochant ainsi du niveau de 68,68 cents américains pour toucher ce qui était considéré comme le creux de la dernière baisse.
Figure 5 – Historique du taux de change entre le dollar américain et le dollar canadien
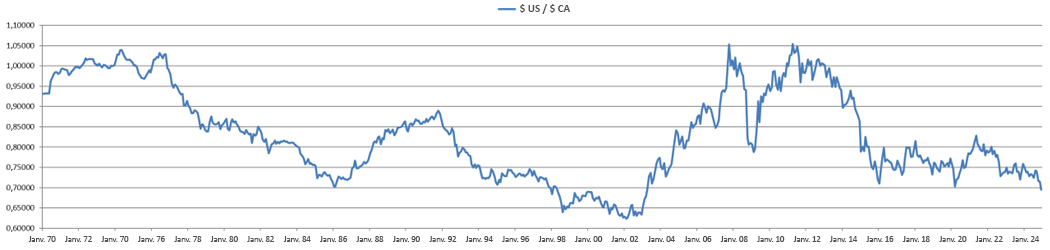
Source : Bloomberg
Bien qu’il ne s’agisse pas actuellement d’un placement populaire auprès des investisseurs institutionnels, la valeur du bitcoin a considérablement augmenté. Grâce à la baisse des taux, elle a particulièrement progressé après la victoire de Donald Trump aux États-Unis. Le bitcoin a terminé l’année à plus de 90 000 $ US, comparativement à un placement inférieur à 16 000 $ US il y a à peine deux ans, après l’effondrement de l’indice FTX, une bourse de cryptomonnaie.
Les guerres partout dans le monde ont contribué à stimuler la demande pour les placements considérés comme une valeur refuge, comme l’or. De plus, l’or, qui a profité des réductions de taux d’intérêt de la Fed, a dégagé un rendement de 27 % pour l’année. La pondération plus élevée de l’or par rapport aux autres grands marchés boursiers a permis au marché boursier canadien de profiter du rendement élevé de l’or.
Du déjà vu pour 2025?
En ce début de 2025, plusieurs des préoccupations et des incertitudes qui existaient au début de l’an dernier persistent. Un deuxième mandat de M. Trump à la présidence des États-Unis et l’absence de leadership officiel à la barre du Canada pourraient également être des sources de distraction. Malgré les incertitudes au début de 2024, l’expérience a été positive. À l’aube de 2025, il est important de se rappeler que les marchés sont difficiles à prévoir à court terme; les investisseurs ne doivent donc pas négliger l’importance de la gestion du risque de portefeuille, y compris le rééquilibrage rigoureux et la prise en compte de sources supplémentaires de diversification du portefeuille afin d’optimiser le rendement du portefeuille.
1. Rapport de PwC intitulé « Asset & Wealth Management Revolution: Embracing Exponential Change »