Last July we wrote to clients about the vicious and virtuous circles which define EM investment cycles and argued there are signs of potential shift from the former to the latter: Are emerging markets on the cusp of a “virtuous circle”?
In the piece we cautioned that fixation on dominant investment narratives can lead to investors missing opportunities in neglected asset classes:
The disparity between the US and EM over the past decade tempts investors into the behavioural trap of building conviction for future returns based on what has performed well in the recent past. It is easy to forget that the annualised returns from 2000 to end-2023 for EM were 7.6% versus 7.8% for the US, both outpacing 6.2% for MSCI World. The risk here is that a pro-cyclical mindset can lead to perverse thinking where conviction strengthens for a popular asset class as the likelihood of a good result decreases, and vice versa.
Along the same lines, we argued in December that investors needed to be mindful of success bias in US equities:
Making money as an investor is all about the delta between reality and expectations. Investors myopically fixated on market narratives about US exceptionalism as justification for extreme outperformance versus the rest of the world risk overstaying their welcome, along with missing opportunities in unloved markets.
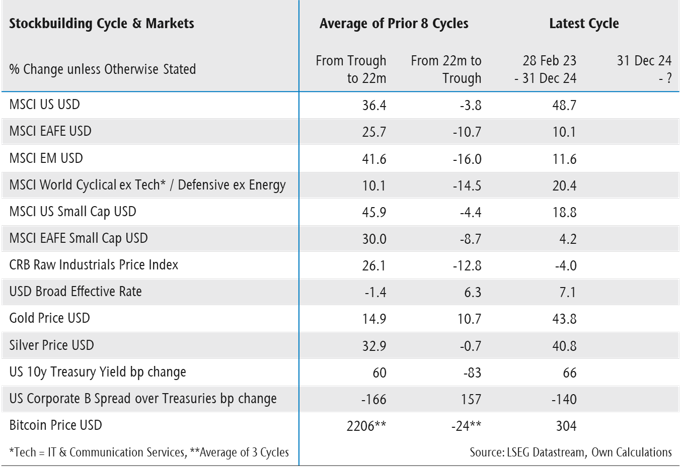
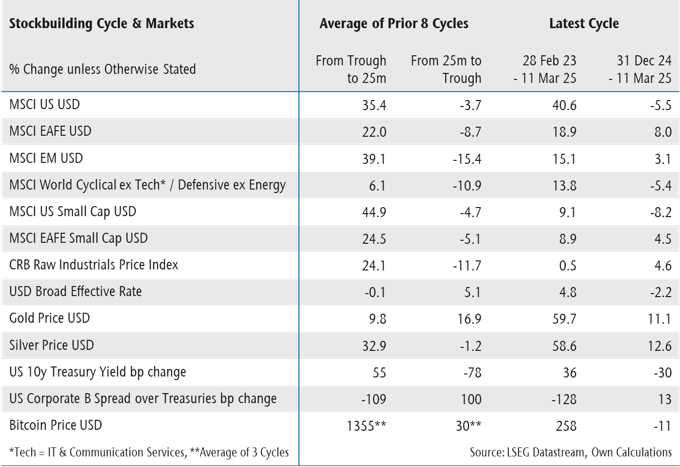
Investors adding to US exposure at the expense of the rest are making a bet that such scorching outperformance can continue.
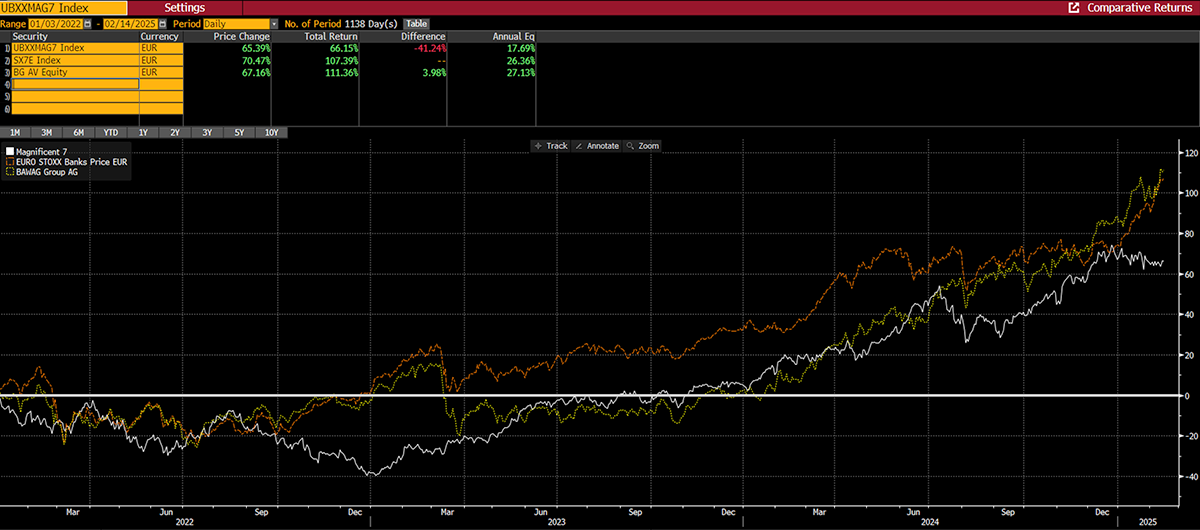
This was against a backdrop of a raging “Trump trade,” as investors bet on a hot US economy, tariffs feeding inflation, rising yields and dollar, and US stocks outperforming the rest.
These trades are now in retreat on fears of tariff blowback on the US economy, while stocks in China rip higher and the dollar plunges.
Vicious and virtuous circles
Is this the turning point we have been calling for? Let’s re-examine the vicious and virtuous circles for EM equities. The performance of US companies, especially its tech giants has indeed been exceptional, while weak fundamentals in EM have fed a self-reinforcing feedback loop which has been a major headwind for the asst class, illustrated below.
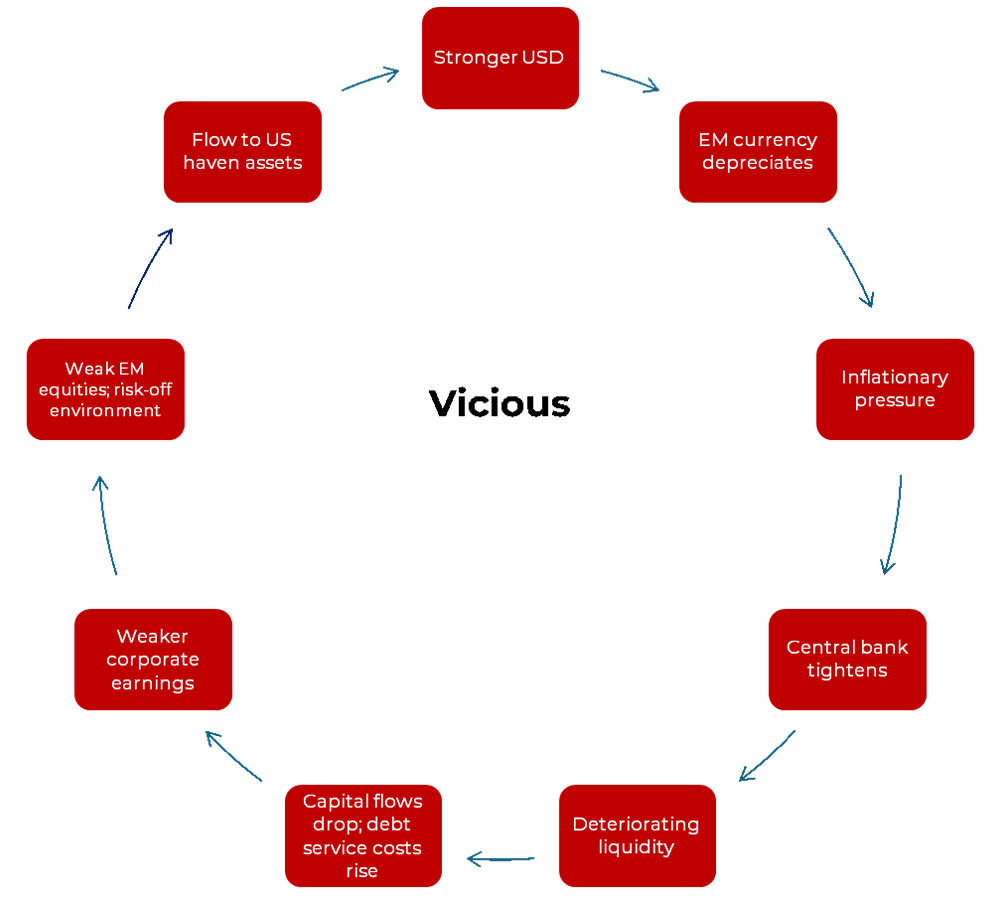
Source: NS Partners
Is China leading a shift?
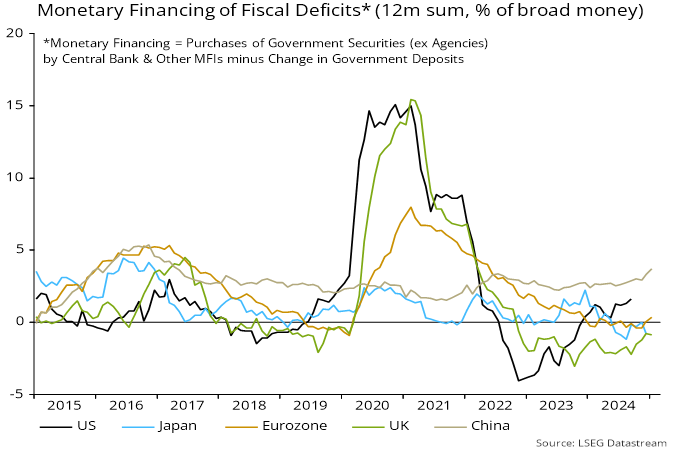
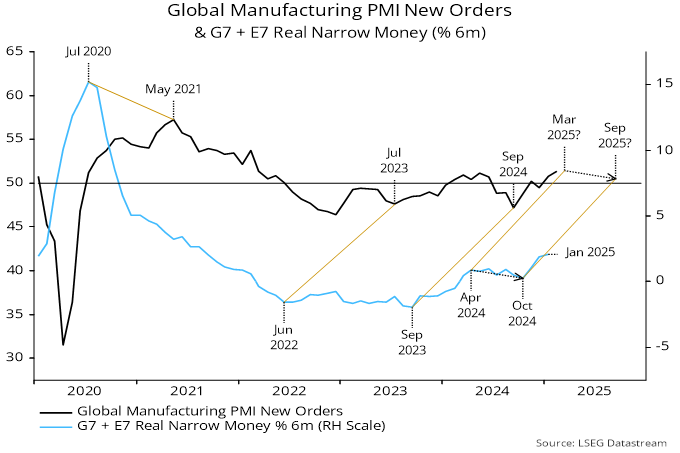
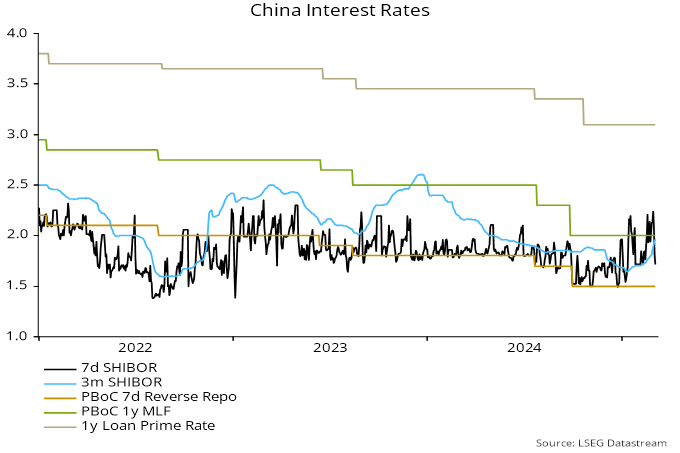
Recent dollar weakness as well as a boost to the monetary backdrop in China provides further support to the view that a shift to the virtuous circle may be approaching.
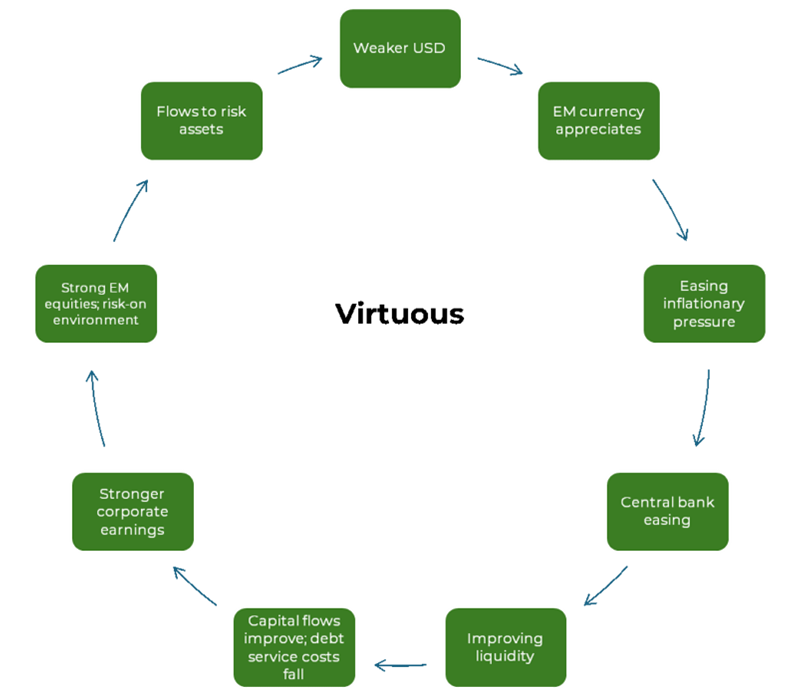
Source: NS Partners
Chinese equities have run hard over a short stretch and may well be due a pullback. However, valuations remain attractive with the market ticking up from 10x CAPE to just over 11x. The rally so far has centred on tech giants Tencent and Alibaba as investors wake up to China’s capacity to innovate in AI and compete with the United States.
There is potential for this outperformance to broaden as the economy stabilises, corporate earnings bottom out, and with the potential for more stimulus from Beijing to come in response to President Trump’s trade sorties.
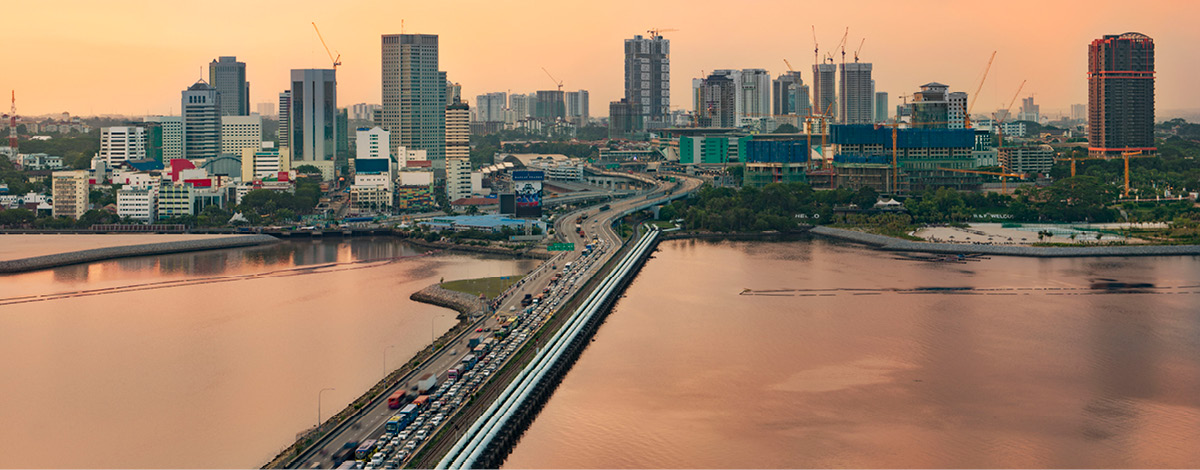
From famine to feast in Southeast Asia
It’s not just China that would enjoy a stalling dollar. There are a number of liquidity-sensitive markets likely to switch from famine to feast, where capital inflows are sterilised by central banks through money creation on commercial bank balance sheets.
The small, open trading economies of ASEAN in particular would be beneficiaries. The liquidity boost from a falling dollar would be a shot in the arm for a region already benefitting from strong foreign direct investment (FDI) flows, relatively stable politics, economic and governance reform initiatives, along with efforts to foster stronger regional economic ties. Investor positioning in the region is light as illustrated below.
ASEAN investor positioning – active investors are only overweight in Indonesia
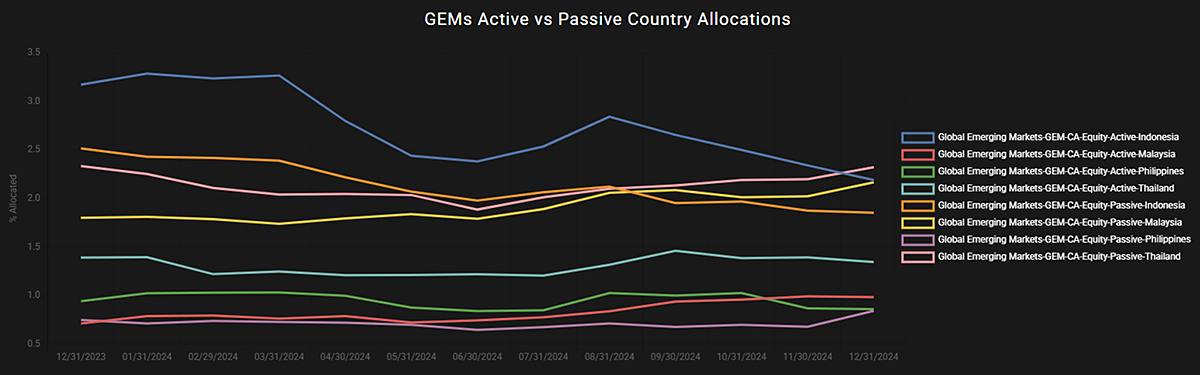
Source: EPFR as of 31 January 2025
Malaysia in particular has been unloved by EM investors, a heavy underweight with its stock market being hit by over five consecutive years of outflows. This belies what we think is an opportunity for the country to capitalise on the combination of its position at the intersection of Chinese and US FDI flows, a positive domestic economic reform story, and huge potential of greater economic links with neighbouring Singapore through the Johor-Singapore Special Economic Zone (JSSEZ) which was announced in 2024.
Malaysia’s golden opportunity
We have written previously about how a decade of reform under Modi in India has fuelled a positive development cycle acting as a driver for sustainable economic growth. Malaysia’s reform story is on a much smaller scale given a population of 35 million against India’s 1.4 billion, but it is meaningful and emblematic of wider regional reform efforts. It is also more incremental as Prime Minister Anwar manages a relatively fragile coalition government, in contrast to Modi’s commanding hold over Indian politics.
Like India’s Aadhaar program, Malaysia has introduced biometric identification in MyDigital ID. The system streamlines access to government services such as welfare payments, and reduces fraud. Anwar has also successfully axed costly diesel subsidies, which will save around RM4 billion annually, reduce smuggling, and free up cash to be redirected to healthcare, education, and infrastructure. A far more economically impactful (but equally contentious) reform of wider fuel subsidies is also on the agenda.
We think the most exciting development is the government’s ambition to form closer economic ties to Singapore through the JSSEZ. Our Co-CIO Ian Beattie met with both Prime Minister Anwar and Finance Minister II Amir Hamzah over the past few months in London to hear about opportunities for foreign investors.
The JSSEZ aims to capitalize on the geographical proximity and complementary strengths of Johor and Singapore. Singapore is bursting at the seams with people and flush with capital, pushing property prices and rents sky high. These issues are putting constraints on businesses in the bustling Asian financial hub that are looking to expand. Johor’s key advantage is in its geographical proximity to Singapore along with providing access to much more competitively priced land, water and energy, globally connected ports, as well as educated workers able to speak Malay, English and Chinese.
Meeting the Malaysian government
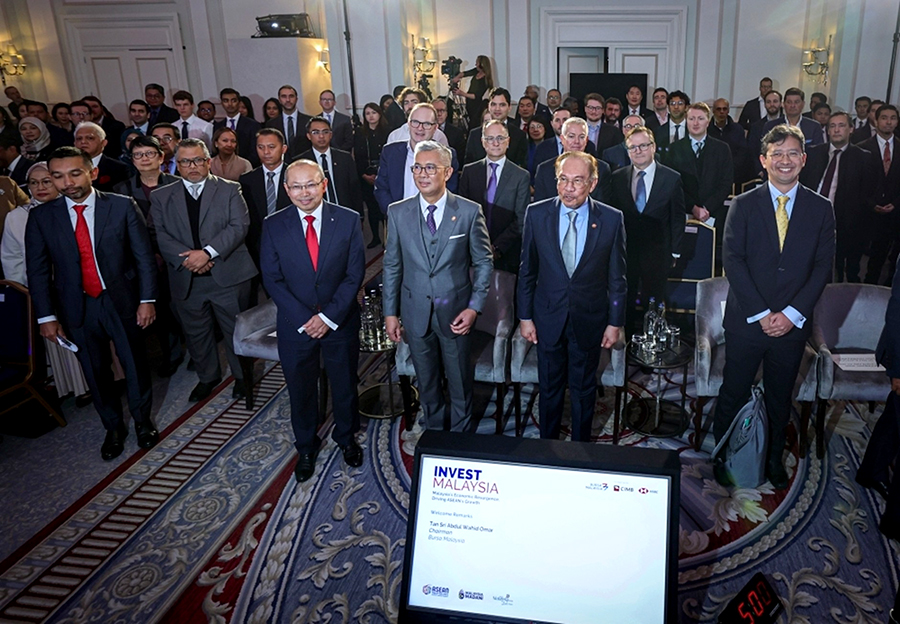
NS Partners Co-CIO Ian Beattie standing in the second row just to the right of Malaysian Prime Minister Anwar Ibrahim, who visited London in February to promote Malaysia’s promise as an investment destination. Source: Invest Malaysia 2025.
“It’s a no-brainer” – Johor-Singapore Special Economic Zone
While the meetings in London were exciting, nothing beats seeing it first-hand. Ian and I travelled to Singapore and Malaysia in late February, kicking the trip off at one of the busiest land borders in the world (10,000 people crossing per hour and rising), between Singapore and the Malaysian city Johor Bahru, the heart of the JSSEZ.
After missing our early morning train (turns out you need to be at the customs counter more than 30 minutes before departing) we were relieved to find that we could swiftly pass through a massive, automated customs facility at the entry to the bus terminal, with departures heading over the border every few minutes. We then spent the day touring the city and surrounding areas which would make up the JSSEZ, which span several areas illustrated in the map below.
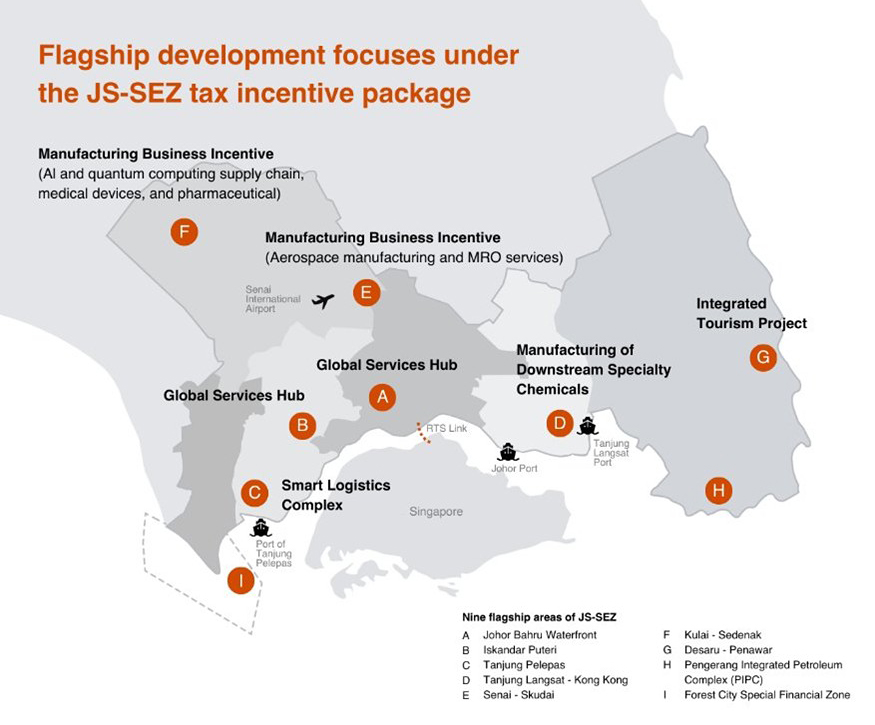
Source: PWC 2025
Each of these areas, known as flagship areas, will focus on different vital sectors such as manufacturing, business services, digital economy, education, health, tourism, energy, logistics and financial services.
Johor is already a global hub for data centres, attracting investments from US and Chinese tech giants like Nvidia, Microsoft and ByteDance. However, the combined support of the Malaysian and Singaporean governments pushing for more seamless movement of goods and people through the region through developing better transport links and cutting red tape between the economies, is seen as a game changer that will supercharge development.
It really is different this time
The JSSEZ is the latest iteration of previous (and disappointing) attempts to promote investment and development in Johor. However, as explained by the team at the Invest Malaysia Facilitation Centre (IMFC – which had been established only a week or so before we visited), this is the first coordinated push by Malaysia and Singapore, with the IMFC tasked with shepherding capital around the country.
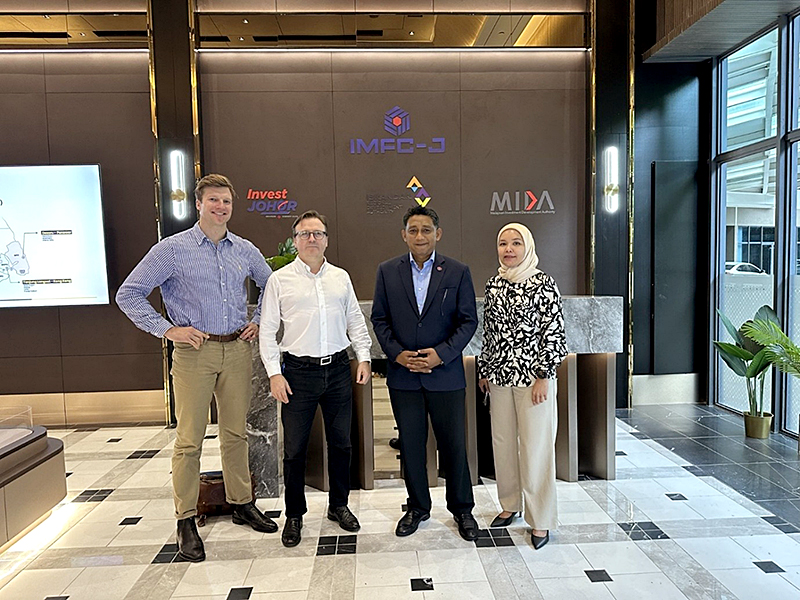
Meeting the head of IMFC Adny Jaffedon bin Ahmad and Iskandar Regional Development Authority VP Rozy Abd Rashid.
Booming Johor
While the task of getting all of the various agencies and governmental authorities to work together will be a monumental task, our discussions with companies in the region paint a bright picture. In property, we met with the team at Knight Frank Johor who said that the region had been booming even before the announcement of the JSSEZ. Residential real estate prices have risen around 50% in five years as Singapore’s growth spills over the border, with workers buying property in Johor and commuting into the city-state each day. This looks set to continue with the completion of the Singapore–Johor Rapid Transit System set for completion in 2027 which will directly connect Johor with Changi airport.
We met with property developer EcoWorld which owns a large land bank of residential, commercial and industrial sites close to the border. The company is focused on the development of large townships connected to commercial spaces set to soak up demand from Singaporean businesses looking to expand in a cost-effective way, e.g. HQ based in Singapore, but with an expanding operations team in Johor.
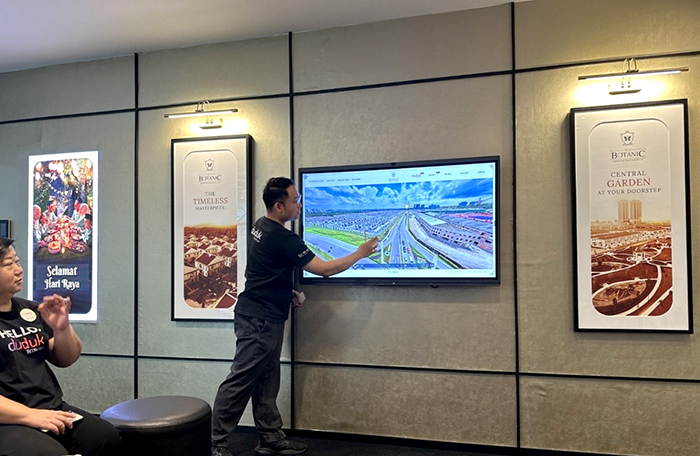
EcoWorld taking us through the plan for developing their Botanic township.

Trying out EcoWorld’s virtual sales technology.
Development in residential and commercial property is unfolding at a rapid pace. However, almost all of the companies we met with were wary about whether the local infrastructure could scale up to accommodate the influx of people and activity.
At the centre of the China-US AI investment race
Malaysia is positioning itself as a key Asian hub for where the physical manifestation of the digital world is built out. Huge investment in AI and cloud infrastructure is transforming the region through the construction of data centres, power stations, transmission cables, power plants, water reservoirs and more. Tech giants looking to invest in Malaysia rely heavily on local players across real estate, construction and banking for their knowledge of the market and ability to navigate the regulatory environment to successfully execute on projects.
Everyone we spoke with in Johor was excited about the surge in interest for industrial land to develop data centres, for both cloud and AI. We toured sites where just a few years ago there was dense jungle. Thousands of acres have given way to massive concrete and steel structures built for the some of the largest tech companies in the world.
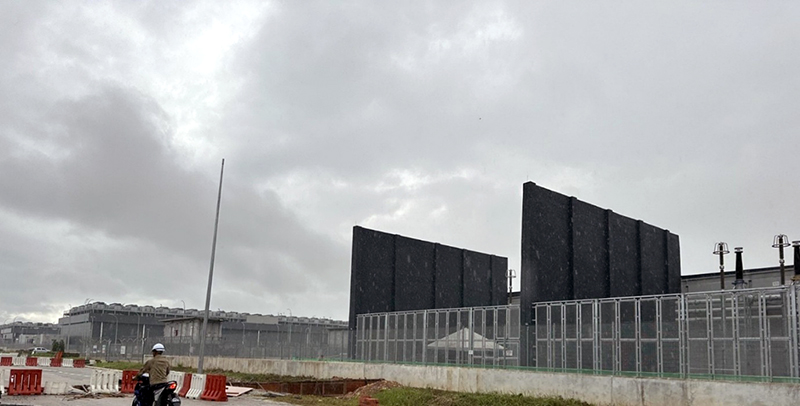
Touring an enormous data centre park.
There is so much demand that development is running into resource bottlenecks, and the government is wary that mushrooming data centres could deplete local resources at the expense of the local population. While power supply is cheap in Malaysia, the intensity of power consumption requires huge investment in renewable energy and transmission capabilities. The biggest constraint is water supply for cooling. Local authorities are furiously working to build new reservoirs to support the infrastructure. Some data centre players are looking to move so fast, they are building their own desalination plants, made possible by the close proximity of some sites to the sea.
Leading the region
We made the three-hour drive from Johor up to Kuala Lumpur to meet with a host of companies behind the development story not just in Johor, but also across Malaysia and Southeast Asia. To single out just one business, construction company Gamuda spoke with us about how their technical expertise and strong balance sheet allows them to tender for highly complex and long-term projects that deter competitors while driving double-digit margins. This includes AI and cloud projects for tech giants like Google and Microsoft, as well as for the Malaysian government in its push to improve the country’s infrastructure.
Gamuda has expanded regionally, with operations outside of Malaysia now accounting for over 85% of its business. It boasts stronger margins than peers in the major markets of Australia and Taiwan, with a tightly run project management team based in Malaysia helping to drive costs down. This, along with an innovative engineering culture, allows Gamuda to make competitive bids for highly complex projects that local peers struggle to match. In Australia, this has seen them win bids for multi-year, multi-billion-dollar mega projects in renewables and infrastructure like Sydney’s metro rail network.
Leading the construction of nine kilometres of metro rail tunnels in Sydney
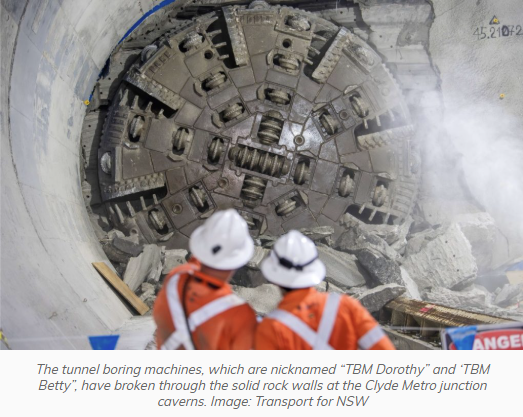
Source: Gamuda 2025
In Taiwan, Gamuda has been building underground railway lines, transmission lines, sea walls and bridges. Taiwan’s monopoly position in leading-edge semiconductors has left the country flush with capital to fuel an infrastructure upcycle. Gamuda’s order book is growing as it often finds itself the only bidder to some attractive tenders. This is down to both the complexity of projects, but also the lack of competition. Everything is tendered in Mandarin, but Chinese construction businesses are “not welcome” in the market. Local players generally do not have the strength of balance sheet or experience that Gamuda boasts, allowing the company to set very attractive prices in contracts that our contact described as “obscenely fair.”
Ambition and (cautious) optimism
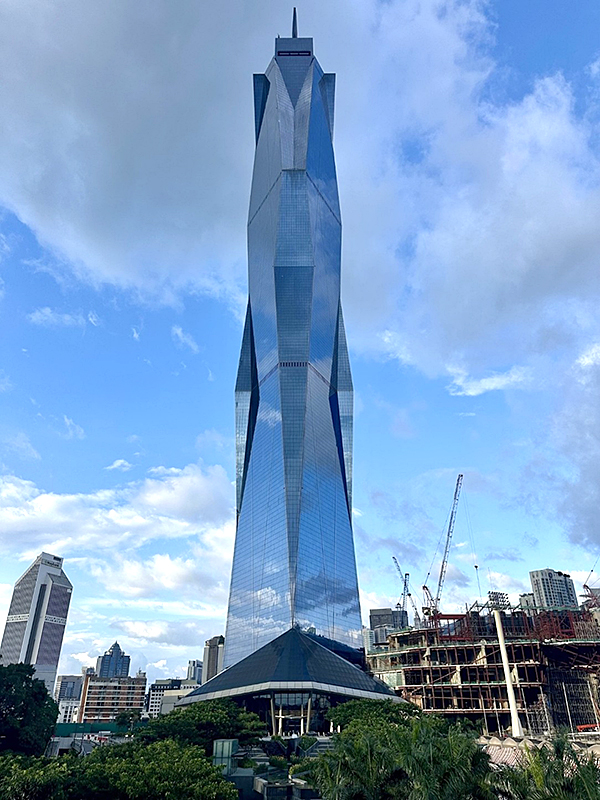
Aside from company research, we also spent a lot of time admiring Kuala Lumpur’s skyline, particularly Merdeka 118 (pictured below) which stands at 679 metres tall (its spire alone being 158 metres tall). It is the second tallest building in the world, surpassed only by the Burj Khalifa, and was officially opened in early 2024. The name « Merdeka » means « independence » in Malay, reflecting its proximity to the historic Stadium Merdeka, where Malaysia’s independence was declared. Not only does it stand as a symbol of the country’s progress, we think it also signals its ambition, potential and the opportunity on offer for many of the excellent businesses that we met.
Merdeka 118
 |
 |
Source: NS Partners 2025