As the global economy contends with mounting climate-related losses – over USD600 billion in insured damages over the last two decades – the investment case for climate adaptation is gaining strength. From flooded subways in New York and burnt-out neighborhoods in California, to drought-stricken farms in Europe and storm-ravaged coastlines in Japan, major environmental disasters are no longer fodder for movies, and the costs to rebuild are no longer abstract.
In the United States alone, hurricane Milton and Helene in 2024 were amongst the costliest hurricanes in US history, at approximately USD35 billion and USD80 billion in damages respectively, while Canada’s wildfires in 2023 became the most expensive on record for the country, with damages surpassing $1 billion.
The future also holds a sobering reality: insurance claims are likely to rise in regions that were once considered “safe.” In fact, properties along Florida’s eroding shorelines are beginning to lose insurability altogether as entire homes inch closer to the sea with every storm surge. Meanwhile, infrastructure around the world faces the stress of extreme heat, intense rainfall and prolonged droughts, putting pressure on insurers, governments, and private capital to respond.
While mitigation (reducing emissions and overall environmental impact) remains essential, adaptation (making systems more resilient to the physical impacts of climate change) is emerging as an investable trend. For long-term investors, this shift presents an opportunity to capture growth, hedge risk, and align capital with real-world resilience.
Companies that help communities, infrastructure and ecosystems adapt to physical climate risks are unlocking new growth markets while also de-risking their operations and strengthening their long-term resilience. For investors, these businesses represent not only defensive plays but also strategic exposure to rising demand for resilient systems in sectors like water, energy, agriculture and construction.
At Global Alpha, we aim to capture these adaptation-driven opportunities across our small cap portfolio. Several of our holdings are actively contributing to building climate resilience from various angles including conservation, advisory services and infrastructure.
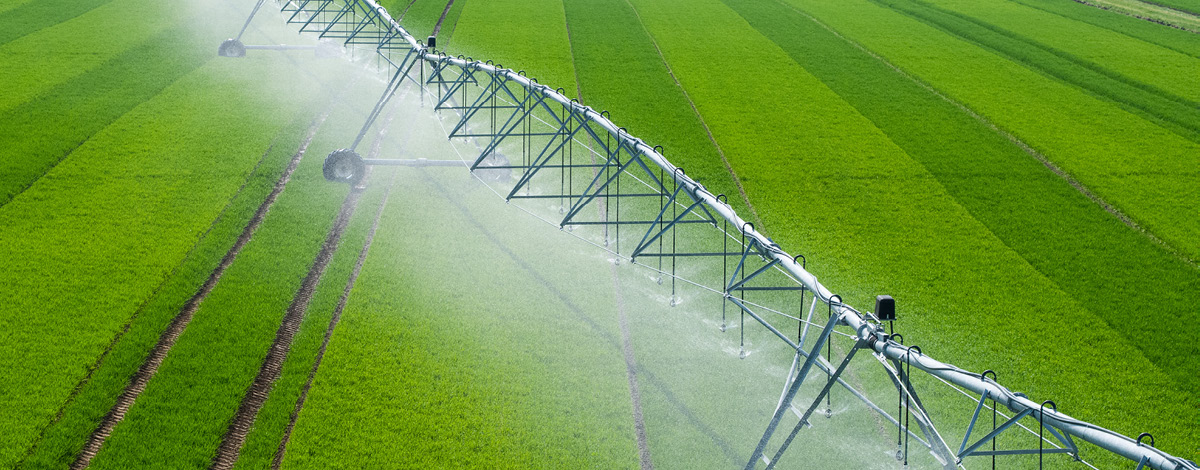
Valmont Industries Inc. (VMI US) offers advanced adaptation solutions for the agricultural sector. As climate change intensifies, the demand for efficient water management and resilient farming practices grows. Valmont’s innovative irrigation technologies, such as their Valley® centre pivots and remote monitoring systems, help farmers optimize water usage, enhance crop yields and reduce operational costs. These solutions not only support sustainable agriculture but also position Valmont as a key player in addressing the challenges posed by climate change.
Mueller Water Products Inc. (MWA US) develops smart water infrastructure, including leak detection and pressure management solutions. These technologies help cities reduce water loss, extend infrastructure lifespan, and ensure a stable supply of clean water – all essential in the face of increasing droughts and floods. By investing in smart water technologies, Mueller enables communities to make informed decisions and prioritize spending on critical assets, thereby enhancing resilience against climate-related challenges.
Montrose Environmental Group Inc. (MEG US) captures opportunities by providing end-to-end solutions for environmental risk management. From air and water quality monitoring to remediation and climate risk advisory, Montrose helps clients adapt operations to a changing climate. Their expertise in climate risk assessment and sustainability advisory helps clients navigate the complexities of climate adaptation, ensuring resilient and sustainable operations
Casella Waste Systems Inc. (CWST US) plays a critical role in climate adaptation by delivering resilient waste management and recycling services. From post-disaster clean-up to ensuring service continuity in rural and underserved areas, Casella helps communities recover quickly and maintain public health as climate-related events grow more frequent.
Rockwool A/S (ROCKB DC) supplies stone wool insulation that improves energy efficiency and helps buildings withstand extreme heat, fire and moisture. As the built environment faces growing physical risks, Rockwool’s products contribute directly to urban structural climate resilience.
Investors should consider these companies as part of a diversified portfolio aimed at capitalizing on the growing demand for climate adaptation solutions. By investing in firms that prioritize resilience, investors can not only mitigate risks but also drive sustainable growth and long-term value.